The Effects of Phase-Field Parameters on Grain Growth Morphologies
in the Solidification
Zhao Daiping, Jing Tao and Liu Baicheng
Department of Mechanical Engineering, Tsinghua University, Beijing 100084, P.R.China
Phase field models have been known as one of the most adequate deterministic models for directlysimulating the dendrite growth morphology, nevertheless, it was not clear how the grain morphologies were influenced by the constant parameters in the models. In this paper, it was studied quantitativelythat the connection between the growth morphologies and some parameters including undercooling, the coupling coefficient between the temperature field and the phase field, the anisotropic coefficient and so on. The formation and transformation between the dendrite morphologyand seaweed morphologywere discussed. Besides, the relations between the tip growth speed and the parameters were studied, the theoryof the growth tip branching-off and the theoryof side-branching were analyzed.
(Received November 5, 2002; Accepted January9, 2003)
Keywords: phase-field, dendrite, side branches, microstructure, pattern
1. Introduction
During the last decade, the capabilityto simulate numeri-callythe solidification microstructure was considerably advanced due to the improvement of the computer perfor-mance and the simulation models. Some different techniques were used for simulating microstructure evolution depending on the system size. For example, Monte Carlo method is favorable for nano-micro scale simulation, phase-field models are for micro-meso scale, and CA methods are for meso-macro scale. The phase-field method can simulate the microstructure evolution regardless of the complexityof the interface shape, so it is expected as a powerful tool to simulate the detail grain morphologies. Generally, it is considered that there are two approaches to derive the phase-field equation:1) the free energymethod and the entropy method. In the phase-field models, an interface with no-zero thickness is assumed to exist between solid and liquid. An order parameter,, is imported to represent the state of the phase. For example,¼1,¼0and a finite region in which
0< <1 represent solid, liquid and the interface, respec-tively. The time change of the phase-field is assumed to be proportional to variation of the free energyfunctional or variation of the entropyfunctional. That is the basal theoryof the phase-field models. Firstly, Kobayashi2) advanced a phase-field which simulated the dendrite growth in pure melt, and studied the effects of noise and anisotropyon the dendrite shape. Warren3) proposed a phase-field model for binary alloys(WMB model), and predict dendritic growth and microsegregation patterns in a binaryalloy. Tiaden4) ex-tended WMB model to the multi-phase and multi-component alloys. The convection effect was also introduced to the phase-field model.5,6)Karma7) and Beckermann8) discussed the evolution of the side-branch structure in the phase-field simulation, and studied quantitativelythe effects of non-conserved noise or non-conserved noise on side-branching. However few papers were found to studydetailedlythe effects of phase-field parameters on the grain morphologies. In this paper, a lot of numerical simulations were performed to search the relation between the parameters and the grain growth morphologies. To clarifythe relation is helpful to
master, ameliorate the phase-field models, and establish exactlythe connection between the phase-field parameters and the thermophysical properties.
2. Phase-field Model
A simple phase-field model in the two-dimensional space was adopted byderiving directlyfrom Karma9)Model. The dimensionless temperature field equation and phase-field control equation is given by
@tu¼Dð@2xuþ@
2
yuÞ þ
1
2@t ð1Þ
ðnn~Þ@t ¼ ½ uð1 2Þð1 2Þ þOO~ ½Wðnn~Þ2OO~
þX
p
@p jOO~ j2Wðnn~Þ
@ðWðnn~ÞÞ
@ð@p Þ
ð2Þ
where p¼x, y, represents the coordinate. D is thermal diffusivity, is the coupling coefficient between the temperature field and the phase field.is a relaxation time,
Wis the interface thickness, bothandWare functions of the interfacial normal nn~ in order to account for anisotropic surface energyand kinetics.andWare assumed to take the form:Wðnn~Þ ¼W0Asðnn~Þ,ðnn~Þ ¼0Asðnn~Þ2, with
Asðnn~Þ ¼ ð13"4Þ þ4"4ð@x Þ 4þ ð@
y Þ4 jOO~ j4
ð3Þ
where "4 is the anisotropic coefficient, W0 and 0 are
constant. All the variables are dimensionless,uis dimension-less undercooling.
3. Classification of Grain Growth Morphologies
morphologies are formatted.
ByIhle,10)the basic grain patterns are classified into two kinds: dendrite and seaweed. 1) dendrite morphology: grain grows faster in some fixed directions than others, some main branches are found obviouslyand theyare continuous in the optimum growth direction, such as Ivantsov parabola shape. 2) seaweed morphology: from patterns to view, there exists no fixed growth direction in which grain grows faster than others, no obvious main branch can be found, the growth tip often branches off.
A second classification concerns the patterns internal structures namelyfractal as opposed to compact patterns. A fractal pattern is one with a self-similar or self-affine internal structure with a scaling range of at least one order of magnitude in length scales. More side branches are found in a fractal pattern, and the branches are slender. On the contrary, a compact pattern possesses fewer side branches, generally, the branches are obese and compact.
4. Result and Discussion
In this paper, we mainlycalculate the effects of under-cooling, the anisotropic coefficient, the coupling coefficient between the temperature field and the phase field on the growth morphologies. To perform designedlya series of simulating calculation, a group of referenced parameters are given as Table1. All the calculating are performed after the referenced parameters, but some parameter is changed regularlyto studythe effects of one single parameter. To simplythe boundarycondition of simulation, the under-cooling of boundarycells is kept changeless.
4.1 The effects of undercooling on the growth morphol-ogies
Undercooling is one of the most determinative factors of the grain patterns. Different undercooling can bring out different patterns. Some purposeful simulations were per-formed to studythe effects of undercooling on grain patterns in the phase-field model. A square region was applied to simulate a single grain growth, and a nucleus was settled in the center of that region. In the beginning, the undercooling for all the cells was initialized as same, when the grain grew, those boundarycells were assumed to hold changeless undercooling. All calculating parameters referred to the Table1. The undercooling was changed orderly. Figure1is the grain patterns under different undercooling.
[image:2.595.305.552.84.112.2]Figure 1 shows sufficient growth morphologies under different undercooling. It can be found: when undercooling is small, the anisotropic behaviour is inconspicuous, the grain grows slowly, the grain pattern matches the compact dendrite morphology, the solid/liquid interface is very stable; with the improvement of undercooling, the obvious anisotropic characteristic begins to come forth, the main branch becomes slender, the pattern is the classical compact dendrite morphology, the interface is stable; as undercooling im-proves to a certain extent, the main branch thickens again, the anisotropic intensitydeclines but considerable anisotropy
Table 1 The referenced parameter group.
t x D u0 W0 0 "4
0.005 0.4 1 0.45 0.3 1 0.03 8.0
[image:2.595.58.538.466.751.2]still exist, the growth tip possiblybranches off, the grain morphologystill is dendrite but a few side branches appear, the interface is unstable. So an important conclusion can be arrived that the greater the undercooling is, the more unstable the interface is. It can be explained with the anti-noise function of the surface energy. If the undercooling was small, the noise at the interface could not be amplified quickly, so the surface energywould restrain the noise and make it vanish at last; when the undercooling was great, the noise could be amplified quickly, the surface energy could not restrain effectivelythe amplification, then the interface was unstable.
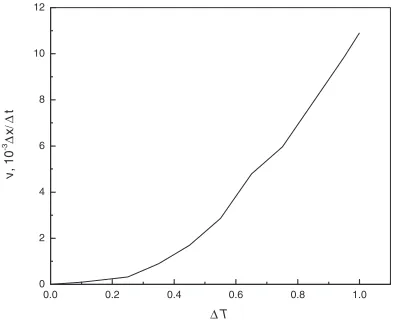
The average growth velocityof main branches under the different undercooling was calculated to find their relation. Figure 2 is the curve of the average velocityabout
under-cooling. In the two-dimensional place, when undercooling
Tis low, thePe´cletnumber is considered to be proportional to the square undercooling. From the definitionP¼R0v=2D,
when the radii of the growth tip are equal, the growth velocity is also approximatelyproportional to the square undercool-ing. Figure2shows roughlythe trend and testifythat point in a degree.
4.2The effects of the anisotropic coefficient on the growth morphologies
The anisotropic coefficient represents the anisotropic intension of surface energy, interface thickness and kinetics. It is not clear how to set exactlythe value of the anisotropic coefficient and what is its connection with real physical parameters. However, during the simulation of microstruc-ture evolution, the coefficient is so important to the dendritic growth that it could not be ignored. Several calculations were performed. The anisotropic coefficient, in which mold number is 4, ranged from 0 to 0.05, other calculating parameters referred to the Table 1. The optimum growth direction was set as 45. Different result was given as Fig. 3. When no anisotropyexists at the interface, Fig. 3(a) indicates that the grain pattern belongs to compact seaweed morphology, the growth tip branches off thoroughly, the great undercooling is the main reason; if undercooling is small, the grain shape should be circle. As the improvement of anisotropy, Figs.3(b–f), the grain pattern transforms from seaweed morphologyto dendritic morphology, the growth tip does not branch off, but the interface begins to become unstable, some side branches can be found gradually. It is necessaryto explain the morphologyin the Fig.3(f). Because the undercooling of the boundarycells is set changeless, when the grain grows there, compared with the internal
0.0 0.2 0.4 0.6 0.8 1.0
0 2 4 6 8 10 12
v
, 10
-3∆
x
/
∆
t
∆ T
Fig. 2 The relation between undercooling and the average growth velocity of main branches.
[image:3.595.72.269.273.433.2] [image:3.595.66.529.487.760.2]region, the undercooling is high. The grain can grow fast along the boundary, so some curious branches are formed. According to those results, we can conclude that if there exists no anisotropy, no dendrite appears, nevertheless biggish anisotropic coefficient complicates the grain pattern. Because the anisotropic improvement results in the unstable interface, the noise can be amplified easier. In Fig.3, it costs equal calculating time for each grain to grow adequatelyin the square region, another valuable conclusion can be arrived that there is no relation between the growth velocityand the anisotropic coefficient.
4.3 The effects of the coupling coefficient on the growth morphologies
The coupling coefficient between the phase field and the temperature field, , is another important parameter, it represents the relation of energyand solidification, deter-mines the growth pattern. The coupling parametershould be set according to the physical parameters, but the experimentation should be ideal method, regrettably, that testing still has not be found at the present. In this paper, we changed the coupling coefficient in a wide range and perform manycalculations, the diversified grain patterns were achieved.
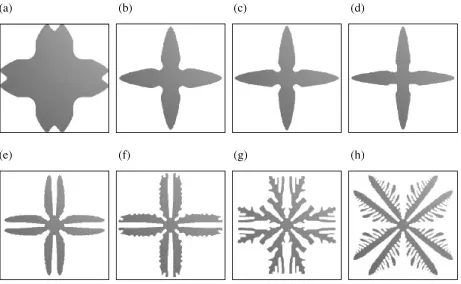
Figure 4 are the grain patterns under different coupling coefficient. Firstly, the coupling coefficient is small, Figs.
4(a–b), the grain possesses obese dendritic morphologyand the growth tip maybranch off. With the improvement of the parameter, the main branch becomes slender, the interface is verystable. If the coupling coefficient is kept improving, the dendrite morphologycould not be maintained, the growth tip
would branch off and the interface has become unstable, Figs.
4(e–f). When the coupling coefficient arrives at a great value, Figs.4(g–h), the grain pattern grows into fractal dendrite or fractal seaweed, the interface becomes veryunstable, the complicated side branches could be found. From the Fig.4, a conclusion can be reached that the greater the coupling coefficient is, the more unstable the growth interface is and the more complex the grain patterns are. It could be explained that the great coupling coefficient results in the great variation of the phase-field value about temperature, the noise can be amplified easier.
4.4 The growth tip branching-off and the evolution of side branches
In all the above calculations, it is worth discussing how the growth tip branches off and side branches develop under the condition of anisotropy.
Under some conditions, the main branch can branch off at the optimum growth directions. Byour calculations, when the undercooling is great, the anisotropic coefficient is small and the coupling is small or great, branching-off could happen, the optimum growth direction could transform. As a result of the existence of the growth competition, the undercooling becomes verydifferent at the different posi-tions of the interface, so some fast growth direcposi-tions, under the same undercooling condition, maybecome slow ones, on the contrary, some slow growth directions may become fast ones, namelythe optimum growth directions shift. That results in branching-off. Actually, when the undercooling is same, the optimum growth directions hold changeless at local position.
Fig. 4 The grain patterns under different coupling coefficient. (a)t¼308000 t,¼2, (b)t¼120000 t,¼8, (c)t¼96000 t,
¼12, (d)t¼76000 t,¼16, (e)t¼80000 t,¼20, (f)t¼84000 t,¼24, (g)t¼880000 t,¼28, (h)t¼880000 t,
[image:4.595.69.530.467.751.2]In this paper, no noise was incorporated in the control equations, but side branches could be found obviouslyin some cases. Bythe above calculations, when the under-cooling is great, the anisotropic coefficient is great or the coupling coefficient is great, side-branching could happen. Some scholars2,7,8) had studied the effects of incorporated noise on the grain patterns, and concluded that the conversed noise was the determinate reason of side-branching. Though the explanation is not absolute, it is assured that the development of side branches should be the result of some noise. In our simulation, some obvious side branches appeared with no extra noise, a reasonable explanation can be given as: the existence of the growth competition must arise the fluctuant interface, under some conditions, those fluctuations can be amplified, namelythe interface self-noise, its development can bring out side-branching.
5. Conclusions
Under the phase-field model, plentiful calculations were performed to studythe effects of the undercooling and the phase-field parameters on the grain growth patterns. The results indicated that the greater the undercooling, the anisotropic coefficient and the coupling coefficient were; the more complicated the grain growth morphologies were, the more unstable the solid/liquid interface was, the easier the
side branches happened. An interesting phenomenon, which the optimum growth directions could transform in some cases, was also found. The reason for side-branching was discussed, the fluctuant interface could result in self-noise, which is the explanation of the development of side branches.
Acknowledgments
This work was supported bythe National Science Foundation of China (No. 50005011).
REFERENCES
1) O. Machiko, K. Seong Gyoon, K. Won Tae and S. Toshio: ISIJ int.41 (2001) 1076–1082.
2) R. Kobayashi: Physica D63(1993) 410–422.
3) J. A. Warren and Boettinger: Acta Metail. Mater.43(1995) 689–703. 4) J. Tiaden, B. Nestler, H. J. Diepers and I. Steinbach: Physica D115
(1998) 73–86.
5) C. Beckermann, H. J. Diepers, I. Steinbach, A. Karma and X. Tong: J. Comput. Phys.154(1999) 468–496.
6) B. Nestler, A. A. Wheeler, L. Ratke and Sto¨cker, C: Physica D141 (2000) 133–154.