Valence Change of Cations in Ceria-Zirconia Solid Solution
Associated with Redox Reactions Studied with Electron Energy-Loss Spectroscopy
Shigeo Arai
1, Shunsuke Muto
2, Junya Murai
3, Tsuyoshi Sasaki
4, Yoshio Ukyo
4,
Kotaro Kuroda
2and Hiroyasu Saka
3;*11MV Electron Microscopy Laboratory, Eco Topia Science Institute, Nagoya University, Nagoya 464-8603, Japan 2Department of Materials, Physics and Energy Engineering, Nagoya University, Nagoya 464-8603, Japan 3Department of Quantum Engineering, Nagoya University, Nagoya 464-8603, Japan
4Toyota Central R&D Laboratories, Nagakute-cho, Aichi-gun 480-1192, Japan
It has been known that the ceria-zirconia solid solutions (Ce2Zr2O7þx,05x51) have an excellent ability for oxygen absorption/release.
The local charge states of cations in the CeO2-ZrO2solid solutions have been studied by means of electron energy-loss spectroscopy (EELS)
attached to a transmission electron microscope. The relative intensity of cerium-M4;5 white-line peaks from Ce2Zr2O7, Ce2Zr2O7:5 and
Ce2Zr2O8 showed a systematic change, which corresponded to the valence change of cerium; Ce3þin Ce2Zr2O7, Ce4þin Ce2Zr2O8. By
contrast, the valence of the zirconium ions, which are mainly at the nearest neighbor sites of absorbed or emitted oxygen atoms, remains to be quaternary irrespective of oxygen contents. It was found that the energy-loss near edge structure (ELNES) of the cerium-M4;5edge in Ce2Zr2O7:5
was well reproduced by the sum of the ELNES profiles of Ce2Zr2O7and Ce2Zr2O8with an equal weight, the phenomenon of which is known as
the ‘valence fluctuation,’ or ‘mixed valence state,’ often observed in rare earth metal compounds.
(Received May 20, 2004; Accepted August 18, 2004)
Keywords: ceria-zirconia solid solution, pyrochlore structure, electron microscopy, electron energy-loss spectroscopy, white-line, oxygen vacancy, valence fluctuation
1. Introduction
CeO2-based three-way catalysts (TWCs) have attracted
much attention as a candidate element for controlling the air pollution from automotive emissions. Recently, it was found
that the oxygen absorption/release capacity of CeO2 was
significantly improved by addition of ZrO2.1–3) A
ceria-zirconia solid solution (Ce2Zr2O7) having the pyrochlore
structure, which is prepared by reduction treatment of the 1:1
mixture of CeO2and ZrO2powders at a high temperature, is
now widely used as TWCs in automobiles because the reduced solid solution with an equimolar composition of
CeO2and ZrO2 possesses a particularly excellent ability for
oxygen absorption/release.4–6)Ce
2Zr2O7is fully oxidized to
Ce2Zr2O8, in which oxygen atoms are absorbed/released
into/from particular atomic sites, depending on the degree of oxidation/reduction. However, it is not yet fully clear why the oxygen absorption/release ability is improved by
addition of ZrO2.
Ce2Zr2O7 has the pyrochlore structure with a cubic
symmetry, the building blocks of which are cerium coordi-nated by eight oxygen atoms and zirconium by six oxygen atoms, and the two cations construct a NaCl-type ordered structure. From this feature the structure intrinsically pos-sesses ordered oxygen vacancies at the nearest neighbor sites
of zirconium7)and hence Ce
2Zr2O7can store oxygen to fill
the oxygen vacancies up to the composition of Ce2Zr2O8. It is
considered that this particular property enables this material
the reversible reactions of Ce2Zr2O7þ1/2O2,Ce2Zr2O8,
release of oxygen under a low oxygen pressure and absorption of oxygen under a high oxygen pressure at a high
temperature.4–6)
Sasaki et al. observed the crystal structure change
associated with the oxygen absorption/release in the ceria-zirconia solid solution, using X-ray diffraction, electron diffraction and high-resolution transmission electron
mi-croscopy: They found that Ce2Zr2O7, the starting material,
absorbed oxygen even at room temperature, when exposed to air for a long term, to form the metastable intermediate phase
of Ce2Zr2O7:5. The absorbed oxygen selectively occupied the
oxygen vacancy sites, which changed the space group
fromFd33mtoF443m.8,9)
The local charge compensation of Ce2Zr2O7þx(05x51)
associated with the oxygen absorption/release is usually accommodated with the local symmetry change around the cation atoms or the valence change of the cation atoms themselves. Actually both effects have been already
sug-gested in this material,7,10)and the valence change of cerium
ion from 4 to 3 was observed during the reduction of CeO2
and Ce2Zr2O8.7)The valence change should proceed so as to
satisfy the electrical neutrality condition according to the chemical composition change, which has not yet been clearly confirmed. Roughly speaking, oxygen atoms occupy three types of octahedral sites of the cation lattice, one surrounded by four cerium ions, another by four zirconium ions and the other by two cerium and two zirconium ions. Curiously, the oxygen site related to the oxygen absorption/release is the one surrounded by four zirconium ions rather than the one
surrounded by cerium ions.11)Therefore, the oxygen
absorp-tion/release characteristic is determined by a peculiar electric charge balance in this crystal structure, and this feature can be a key to solve why the oxygen absorption/ release characteristic in this material is excellent. Diffraction studies for crystallographic structure analysis have been mainly conducted on this material, while there have been few
*This Paper was Originally Published in Japanese in Japan Inst. Metals68
(2004) 264-268.
reports available on the local electric charge distributions. From the above viewpoint, we applied electron energy-loss spectroscopy (EELS) in order to examine the change of local electric charge distributions associated with the oxygen
absorption/release in Ce2Zr2O7þx.
2. Experimental
The samples used for the present experiments were prepared by the following procedures: first the precursor in
which CeO2and ZrO21:1 mol% were co-precipitated in the
aqueous nitrate solution was synthesized. The precursor was heated in the reducing furnace under the argon gas atmosphere up to 1700 K, which changed the precursor to
Ce2Zr2O7 having the pyrochlore structure.4–6) The product
was then crushed into powder in the mortar. The Ce2Zr2O7
sample powder was preserved in acetone for antioxidation, for it can absorb oxygen from the ambient atmosphere at
room temperature. The Ce2Zr2O7 powder was heat-treated
under the oxygen atmosphere at 1100 K to obtain the
Ce2Zr2O8 oxide. The intermediate phase, Ce2Zr2O7:5, was
prepared just by exposing the Ce2Zr2O7 powder to air for
nearly 1 year.8)The Ce
2Zr2O8 and Ce2Zr2O7:5 samples did
not seem to change to another phase by their exposure to air at room temperature.
The samples were put on carbon microgrid films and then immediately inserted into the microscope vacuum to avoid any further oxidation or reduction. The observation was performed with an 300 kV electron microscope (Hitachi H-9000NAR) equipped with GATAN imaging filter, GIF, and a 200 kV electron microscope (JEOL JEM-2010F) equipped with a parallel electron energy-loss spectrometer.
3. Results
A representative EEL spectra taken from Ce2Zr2O8 is
shown in Fig. 1, where oxygenK-core loss peak at 532 eV,
Cerium M5 and M4 edge spectra around 900 eV, and
zirconium L3 and L2 edge spectrums at 2222 eV. In the
present study, we focus on this cerium M4;5 edge and
zirconiumL2;3edge spectra.
3.1 ELNES of cerium-M4;5edge
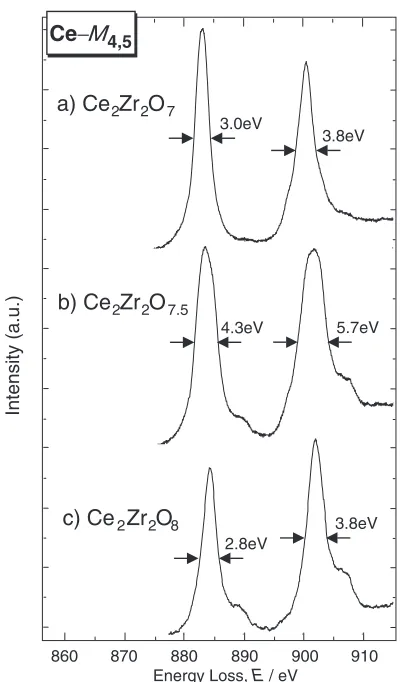
Figure 2 shows energy-loss near edge structure (ELNES)
of M4;5 edges of Ce2Zr2O7, Ce2Zr2O7:5 and Ce2Zr2O8, in
which the pre-edge and post-edge continuum background components were subtracted. The pre-edge background was
modeled with a power law,AER(E: energy loss,A,R: fitting
parameters), in a conventional manner and the shape of the
Intensity (x10
3)
Energy Loss,
E
/ eV
2200 2400 2600
Zirconium
Lcore loss
L3
2222eV
L2 2307eV
L1 2531eV
20 30 40 50 60 70
400 600 800 1000 1200 400
800 1200 1600
0
Cerium
Mcore loss
Oxygen
K core loss
M5 884eV
M4 902eV
532eV
M31185eV
Ce
2Zr
2O
8Fig. 1 O-K, Ce-Mand Zr-Lcore-loss spectra obtained from Ce2Zr2O8.
Intensity (a.u.)
860 870 880 890 900 910
Energy Loss, E / eV
4.3eV 5.7eV
b) Ce
2Zr
2O
7.52.8eV
3.8eV
c) Ce
2Zr
2O
8a) Ce
2Zr
2O
73.0eV
3.8eV
Ce
−
M
4,5Fig. 2 Ce-M4;5 white-line peaks obtained from (a) Ce2Zr2O7, (b)
Ce2Zr2O7:5 and (c) Ce2Zr2O8. FWHM of each peak is indicated. The
relative white-line peak intensity,IðM4Þ=IðM5Þ, is 0.95, 1.10 and 1.25 for
[image:2.595.327.527.167.508.2] [image:2.595.101.499.580.768.2]post-edge continuum was deduced from the Hartree-Slater
calculations.12) Two sharp peaks close to the ionization
threshold are called ‘white-line’, characteristic to the L2;3
edges of transition metals and theM4;5edges of rare earths.
The energy separation of these peaks reflects the spin-orbit
splitting of the 3d initial states in the transition and their
relative intensity is expected to change with the occupancy of
the 4f final state orbital. It was actually experimentally
shown that the relative intensity of the white-line peaks of the
4f rare earth elements from La to Lu (lanthanides) is a
monotonic function of final-state occupancy or atomic
number.12) The relative intensity of white-line peaks,
IðM4Þ=IðM5Þ, is therefore a potential source of information
about oxidation state.13–15)
The value of IðM4Þ=IðM5Þ for Ce2Zr2O7 (Fig. 2(a)) and
Ce2Zr2O8 (Fig. 2(c)) was estimated to be 0.95 and 1.25,
respectively. For comparison cerium M4;5 edges from CeF3
and CeO2 are shown in Fig. 3, as reference spectra of Ce3þ
and Ce4þ, respectively. The value ofIðM
4Þ=IðM5Þfor CeF3
was 0.95 and for CeO21.25. It can be hence interpreted that
the valence state of cerium changed from Ce3þto Ce4þby the
oxidation from Ce2Zr2O7to Ce2Zr2O8.
In the meantime, the value ofIðM4Þ=IðM5Þfor Ce2Zr2O7:5
(Fig. 2(b)) was estimated to be 1.10, which coincides with the arithmetic mean of 0.95 and 1.25. This means that the apparent valence of cerium is 3.5. Such a phenomenon is called ‘valence fluctuation’ or ‘mixed valence state’, known
as one of the characteristic behaviors of4f rare earth metal
compounds.16)
[image:3.595.328.525.72.367.2]3.2 ELNES of zirconium-L2;3spectrum
Figure 4 shows zirconiumL2;3edge spectra of Ce2Zr2O7,
Ce2Zr2O7:5 and Ce2Zr2O8. And Fig. 5 shows a reference
zirconiumL2;3 edge spectrum from ZrO2. The series of the
spectra indicates that the valence state of zirconium remained
to be Zr4þ throughout the oxidation process.
4. Discussion
4.1 Local charge equilibrium associated with oxygen
absorption
In crystals having a large measure of ionic bond character, such as the present ceria-zirconia solid solutions, the structure is in large part determined on the basis of how positive and negative ions can be stacked together on a lattice to maximize electrostatic attractive forces and minimize electrostatic repulsion. An empirical but convenient rules,
Intensity (a.u.)
860 880 900 920 940 960
Energy Loss, E / eV
a)
CeF
3b)
CeO
2Ce
−
M
4,5Fig. 3 Ce-M4;5 white-line peaks obtained from (a) CeF3 (Ce3þ) and
(b) CeO2(Ce4þ) reference samples. The relative white-line peak intensity,
IðM4Þ=IðM5Þ, is 0.95 and 1.25, respectively.
Intensity (a.u.)
2200 2250 2300 2350 2400 2450 Energy Loss, E/ eV
c) Ce2Zr2O8 b) Ce2Zr2O7.5 a) Ce2Zr2O7
Zr−
L
2,3Fig. 4 Zr-L2;3 peaks obtained from (a) Ce2Zr2O7, (b) Ce2Zr2O7:5 and
(c) Ce2Zr2O8.
0 20 40 60 80 100 120
Zr
−
L
2,3Intensity (x10
3)
ZrO
22200 2250 2300 2350 2400 2450 Energy Loss, E / eV
[image:3.595.314.542.424.576.2] [image:3.595.76.261.485.746.2]derived by Pauling,17)can give a guideline to achieve this minimum-energy condition based on properties of the ions used. In general cations are smaller in size than anions, and many ionic structures can be built up by putting small cations in the interstices between larger anions (coordination
poly-hedron). According to the Pauling’s first rule,17)the
coordi-nation number of anions around a cation is determined by the geometry necessary for the cation to remain in contact with each anion and the geometry is fixed by the radius ratio of the cation-anion combination. A particular coordination number is thus stable as long as the cation-anion radius ratio is larger than a certain critical value. In other words, a larger number of anions are necessary to stabilize the coordination polyhedron containing a cation having a larger ionic radius.
When looking into the case of Ce2Zr2O7, one can see that the
Pauling’s rule holds well: the ionic radius of Ce3þand Zr4þis
0.10 nm and 0.07 nm respectively,18)and the larger Ce3þions
are surrounded by eight oxygen atoms, while the smaller
Zr4þby six. It can be thus explained why oxygen vacancies
are introduced at the nearest neighbor sites of Zr4þ in
Ce2Zr2O7.
On the other hand, the present EELS measurements showed that the valence of the zirconium ion remained unchanged, while the valence of the cerium ion successively changed from 3 to 3.5 and 4, with increasing the oxygen content (by filling the oxygen vacancies near the zirconium
ions) in the transformations from Ce2Zr2O7 to Ce2Zr2O7:5
and Ce2Zr2O8. It has been reported that the cubic symmetry
is retained by this change in the oxygen content, and the interatomic distances between the cations and oxygen only
slightly change by the transformation between Ce2Zr2O7and
Ce2Zr2O7:5, while the transformation between Ce2Zr2O7:5
and Ce2Zr2O8 accompanies considerable atomic shuffles in
the oxygen positions.8)These features can be again explained
qualitatively in terms of the Pauling’s rule: with increasing the oxygen content, the coordination number (the number of oxygen ions) of zirconium ions increases, while the total charge neutrality is compensated by the valence change of cerium ions. It is considered that the cation-anion radius ratio of zirconium is still smaller than the critical value required
for stabilizing the coordination polyhedra in the Ce2Zr2O7:5
intermediate phase, whereas a larger coordination number of
zirconium in Ce2Zr2O8 can no longer accommodate the
radius ratio and requires the distortion of coordination polyhedra.
4.2 Valence fluctuation at intermediate phase Ce2
-Zr2O7:5
As described in 3.1, cerium ions in the Ce2Zr2O7:5
intermediate phase demonstrates a ’mixed valence state’ of
Ce3:5þ. It should be noted here that the present phenomenon
does not result from two kinds of cerium sites, each occupied
by Ce3þ and Ce4þ separately, because the cerium site is
crystallographically all equivalent in the Ce2Zr2O7:5
struc-ture.7)
The valence fluctuation or mixed valence state can be
thought of as a mixture of4fnand4fn1ions, the energies of
which are nearly degenerate.4f charge fluctuations between
the two configurations occur on a time scale vf, so-called
valence fluctuation time. Therefore, experiments which
probe the sample on a time scale much shorter thanvf will
see both configurations, while experiments which probe on a
time scale longer than vf will see only one intermediate
configuration. EELS in general should be classified into the
former category. The ceriumM4;5spectrum of the Ce2Zr2O7:5
intermediate phase should hence exhibit a profile as if a
cerium ion may take both Ce3þand Ce4þconfigurations with
an equal probability, since the apparent valence was deduced
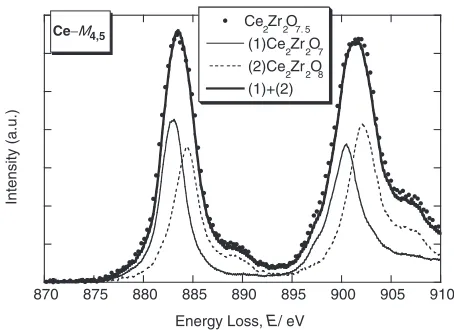
to be 3.5, as shown in sec. 3.2. As a matter of fact, Ce-M4;5
ELNES of Ce2Zr2O7:5 was perfectly reproduced by the sum
of the two other spectra from Ce2Zr2O7and Ce2Zr2O8with
an equal weight, as shown in Fig. 6. The apparent increase in
the FWHM of the white-line in Ce2Zr2O7:5 thus originates
from the different spin-orbit splitting widths of Ce3þ and
Ce4þconfigurations.
5. Summary
Changes in the valence state of cerium associated with
oxygen absorption of Ce2Zr2O7þx(05x51) were studied
by means of electron energy-loss spectroscopy (EELS). The results obtained are summarized in the following:
(1) The apparent valence state of cerium ion was Ce3þ,
Ce3:5þ and Ce4þ for Ce2Zr2O7, Ce2Zr2O7:5 and Ce2Zr2O8
respectively. On the other hand, the valence state of
zirconium ion remained Zr4þ for any case among the three
although oxygen atoms filled the structural vacancies located at the nearest neighbor sites of zirconium.
(2) The total charge neutrality associated with the oxygen absorption/release is compensated by the valence change of the cerium ion. And it was found that the Pauling’s rules could give a qualitative explanation on the reported structural
changes in the transformations from Ce2Zr2O7to Ce2Zr2O7:5
and Ce2Zr2O8.
(3) A ‘mixed valence state’ of cerium ion in the Ce2Zr2O7:5
intermediate phase was found and its Ce-M4;5 edge profile
can be perfectly reproduced by the sum of the two Ce-M4;5
edge profiles from Ce2Zr2O7 and Ce2Zr2O8 phases. This
indicates that the electronic configuration of each cerium ion
fluctuates between Ce3þand Ce4þconfigurations.
We believe that the present results above can be a 870 875 880 885 890 895 900 905 910
Ce
2Zr2O7. 5
(1)Ce
2Zr2O7
(2)Ce
2Zr2O8
(1)+(2)
Intensity (a.u.)
Energy Loss, E/ eV
Ce−M4,5
Fig. 6 Nomogram showing that experimental Ce-M4;5edge (solid circles)
in Ce2Zr2O7:5is well reproduced by the sum (thick solid line) of Ce-M4;5
[image:4.595.312.539.70.235.2]milestone for understanding why the ceria-zirconia solid solution exhibits the excellent oxygen absorption/release properties.
Acknowledgements
The authors thank Drs. A Sakai, N. Tanaka and J. Yamasaki of Nagoya University for their help in EELS recording. A part of the present work is supported by Grant-in-Aid for scientific research of Japan Society for the Promotion of Science.
REFERENCES
1) H. C. Yao and Y. F. Y Yao:J. Catal.86(1984) 254–265.
2) P. Fornasiero, G. Balducci, R. D. Monte, J. Kaspar, V. Sergo, G. Gubitosa, A. Ferreo and M. Graziani:J. Catal.164(1996) 173–183. 3) M. Luo, G. Lu, X. Zheng, Y. Zhong and T. Wu:J. Mater. Sci. Lett.17
(1998) 1553–1557.
4) M. Ozawa:J. Alloys Compd.275–277(1998) 886–890.
5) J. Kasper, P. Fornasiero and M. Graziani:Catalysis Today50(1999)
285–298.
6) H. Muraki and G. Zhang:Catalysis Today63(2000) 337–345. 7) H. Kishimoto, T. Omata, S. Otsuka-Yao-Matsuo, K. Ueda, H. Hosono
and H Kawazoe:J. Alloys Compd.312(2000) 94–103.
8) T. Sasaki, Y. Ukyo, A. Suda, M. Sugimoto, K. Kuroda, S. Arai and H. Saka:J. Ceram. Soc. Jpn.111(2003) 382–385.
9) T. Sasaki, Y. Ukyo, K. Kuroda, S. Arai and H. Saka: J. Electron Micros.52(3)(2003) 309–312.
10) R. Sharma and P. Crozier:Inst. Phys. Conf. Ser.161(1999) 569–572. 11) J. B. Tomson, A. R. Armstrong and P. G. Bruce:J. Am. Chem. Soc.118
(1996) 11129–11133.
12) T. Manoubi and C. Colliex: J. Electron Spectroscopy and Related phenomena50(1990) 1–18.
13) B. T. Thole, G. van der Laan and J. C. Fuggle:Phys. Rev. B32(1985) 5107–5118.
14) L. A. J. Garie and P. R. Buseck:J. Phys. Chem. Solids60(1999) 1943– 1947.
15) H. Xu and Y. Wang:J. Nucl. Mater.265(1999) 117–123.
16) J. M. Lawrence, P. S. Riseborough and R. D. Parks:Rep. Prog. Phys.44
(1981) 1–84.
17) L. C. Pauling:Nature of the Chemical Bond 3d ed., (Cornell Univ. press, Ithaca, N.Y., 1960).