Modification of crop management and its influence on the structure
of yield and quality of spring barley grain
K. Koutná, R. Cerkal, J. Zimolka
Mendel University of Agriculture and Forestry in Brno, Czech Republic
ABSTRACT
In 1998–2000, in a multi-factorial field experiment established by the method of split blocks and subplots, we studied the effect of three systems of beet tops management, two sowing rates and two levels of N fertilization and the effect of interactions of the factors on production and qualitative indicators of spring barley varieties Amulet and Kompakt. The evaluation shows the dominant effect of the particular year on the variability of all characters. The proportion of the effect of the year on the variability of characters ranged from 2.1 (number of plants per m2) to 80.1% (yield). The vari-ability of quality parameters was also considerably affected by the genetic factor of the variety (grain over 2.5 mm sieve 40.4%, TGW 20.5%). The level of characters was greatly variable in relation to the course of climatic conditions of the year. The highest grain yield was achieved in 1999 (7.21 t/ha), the lowest one in 2000 (5.25 t/ha). The best quality parameters were shown by grain from the 1998 harvest (yield 6.20 t/ha) with significantly highest TGW (47.76 g), a high proportion of grain over 2.5 mm sieve (92.01%, 5.54 t/ha) and a favourable content of N substances in the grain (10.60%). Ploughed down beet tops supported the creation of the yield, the average differences between variants were, however, minimal being heavily affected by the course of weather in particular years. More favourable conditions for the creation of the yield (6.17 t/ha) and for the formation of mechanical properties of the spring barley grain (TGW 45.55 g, grain over 2.5 mm sieve 85.86%) were produced by variants with late ploughing down beet tops, the smallest accumula-tion of N substances occurred in variants with harvested beet tops (11.83%). Sowing rate significantly affected values of all studied characters. Variants sown 4.5 MGS (6.27 t/ha) gave higher average grain yields, grain of better quality was obtained from the stands sown 3.5 MGS (TGW 45.22 g, grain over 2.5 sieve 84.41%, N substances 11.93%). Between particular varieties, significant differences were found both in the economic yield and the grain quality. The Kompakt variety showed on average 4.7% higher yield (6.37 t/ha) than the Amulet variety which, however, reached the higher average TGW values as well as the proportion of grain over 2.5 mm sieve (45.87 g, 88.24%). The grain quality of the Amulet variety was negatively affected by the increased accumulation of N substances in the grain (12.49%). As com-pared with control, N fertilization at the rate of 30 kg/hashowed significant increase in the yield in 1998 only (by 7.5%) while in other years, an increase in the yield was not noticed. In all years under investigation, the TGW values and the proportion of grain over 2.5 mm sieve decreased and the content of N substances in grain increased after application of N at the rate of 30 kg/ha.
Keywords: spring barley; beet tops; yield; yield structure; grain quality; N fertilization; sowing rate
Sugar beet belongs traditionally to the best forego-ing crops for the creation of yield as well as malt quality of spring barley in the production regions of its grow-ing. Present technologies of sugar beet harvesting with the subsequent ploughing down of beet tops, howev-er, represent considerable amounts of organic matter and nutrients that enter the soil. The course of mineral-ization of ploughed down matter of beet tops when re-lease of nutrients occurs significantly affects the production process of spring barley and its quality (Zi-molka et al. 1999).
Mineralization of the organic matter of beet tops and its intensity are dependent above all on the course of weather conditions at the time after ploughing down into soil and in the course of the growing season. Provazník et al. (2000) mention that mineralization of ploughed down
beet tops gives theoretically the following average amounts of nutrients into soil: 102 kg N, 12 kg P, 148 kg K, 33 kg Ca and 18 kg Mg. The shift of mineralization to later stages of the production process (shooting, grain forma-tion and ripening) is the reason for uncontrolled release of nitrogen and marked changes of its dynamics in soil with negative effects on lodging, health conditions and worsening of grain quality parameters. The cause of the retardation or even cessation of mineralization process-es in soil is early and long-term freezing of soil during winter and dry and cold weather in spring after sowing spring barley. Possibilities of affecting the processes are related to problems of the term of beet tops ploughing down and optimization of spring barley nutrition. Stress is particularly laid on the rationalization of N nutrition (Tóth 2000).
MATERIAL AND METHODS
The effects of sugar beet tops management on select-ed quantitative and qualitative parameters of spring bar-ley were studied in the plant production experimental station of the Agricultural Training Enterprise Žabčice near Brno, Mendel University of Agriculture and Forest-ry, Brno, in 1998–2000. The station is situated in the maize agricultural production region, sub-region K2, at an av-erage altitude of 185 m. The region that is part of the
Dyje-Svratka valley basin is characterized as warm, slightly dry with moderate winters.
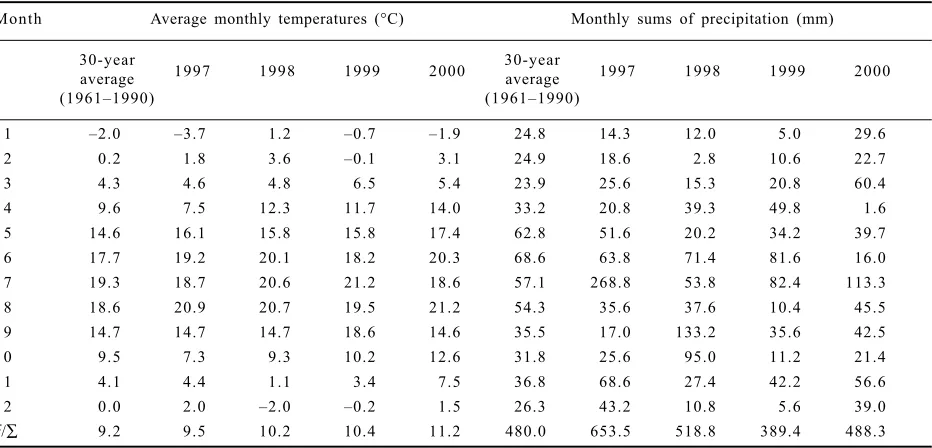
The soil type was classified as Gley Fluvisol (FLG) de-veloped on the Svratka river alluvium. As for soil texture, it is a moderately- to heavy-textured clay-loam to clay soil with the content of clay particles amounting to 55–65%. The groundwater table occurs about 1.8 m under the soil surface. The agrochemical properties of the soil are giv-en in Tables 1 and 2. The course of weather in particular years is given in Table 3.
[image:2.595.63.290.88.169.2]In a series of experiments with perpendicular-split blocks and subplots, the following factors were evaluat-ed: three systems of beet tops management (a – early ploughing down of bet tops, b – late ploughing down of bet tops, c – harvested beet tops) under two levels of mineral N fertilization (0 kg/ha N, 30 kg/ha N) with the differentiated sowing rate of 3.5 and 4.5 MGS. Each of the variants was in 4 repetitions with an area of trial plots 12.5 m2. In the experiments, the top-ranking malt varieties Amulet and Kompakt were studied. Barley was grown during all years under investigation after sugar beet fer-tilized by manure at a rate of 40 t/hain the crop rotation
Table 1. Agrochemical soil properties before the establishment of the experiment, depth 0–250 mm (Provazník et al. 2000)
Year pH/KCl Available nutrients – Mehlich II (mg/kg)
P K Ca Mg
1998 6.9 6 7 209 4 430 323
1999 7.0 102 254 5 228 352
[image:2.595.61.533.382.477.2]2000 6.84 9 1 263 3 935 318
Table 2. Content of Nan in soil (mg/kg) before establishing the experiment according to variants of beet tops management, depth 0–500 mm, 1998–2000
Year
Variants of beet tops management
a b c
0–250 250–500 0–250 250–500 0–250 250–500
1998 17.66 17.93 17.11 8.49 20.58 8.74
1999 18.17 17.51 13.81 14.33 14.58 18.23
2000 20.27 20.58 15.11 14.60 11.78 22.42
Table 3. Average monthly temperatures (°C) and monthly sums of precipitation (mm)
Month Average monthly temperatures (°C) Monthly sums of precipitation (mm)
30-year
1997 1998 1999 2000 30-year 1997 1998 1999 2000
average average
(1961–1990) (1961–1990)
1 –2.0 –3.7 1.2 –0.7 –1.9 24.8 14.3 12.0 5.0 29.6
2 0.2 1.8 3.6 –0.1 3.1 24.9 18.6 2.8 10.6 22.7
3 4.3 4.6 4.8 6.5 5.4 23.9 25.6 15.3 20.8 60.4
4 9.6 7.5 12.3 11.7 14.0 33.2 20.8 39.3 49.8 1.6
5 14.6 16.1 15.8 15.8 17.4 62.8 51.6 20.2 34.2 39.7
6 17.7 19.2 20.1 18.2 20.3 68.6 63.8 71.4 81.6 16.0
7 19.3 18.7 20.6 21.2 18.6 57.1 268.8 53.8 82.4 113.3
8 18.6 20.9 20.7 19.5 21.2 54.3 35.6 37.6 10.4 45.5
9 14.7 14.7 14.7 18.6 14.6 35.5 17.0 133.2 35.6 42.5
1 0 9.5 7.3 9.3 10.2 12.6 31.8 25.6 95.0 11.2 21.4
1 1 4.1 4.4 1.1 3.4 7.5 36.8 68.6 27.4 42.2 56.6
1 2 0.0 2.0 –2.0 –0.2 1.5 26.3 43.2 10.8 5.6 39.0
[image:2.595.67.533.536.760.2]of pea – winter wheat – sugar beet – spring barley. In the variant a, beet tops were crushed after sugar beet har-vesting (mid-October), they were evenly layered and ploughed down to a depth of 250–280 mm. In the variant b, beet tops were similarly ploughed down a month later (mid-November) and in the variant c, beet tops were removed (ploughing carried out in terms of the variant b). Table 4 gives the average values of chemical analyses of the beet tops and their amounts ploughed down in 1997, 1998 and 1999.
In spring, the pre-seeding treatment of soil was car-ried out (smoothing harrow + harrow). Nitrogen was applied as a single measure before sowing in the form of SYNFERTA combined fertilizer (12% N, 11% P, 11% K) at a rate of 0 and 30 kg/haN. The treatment of crops, using pesticides to control weeds, diseases and pests, was carried out according to standard methods for the plant protection.
In each repetition, the number of plants per unit area was determined from an area of 0.25 m2 after full heading as well as the number of created and fertile tillers on a plant (Table 5). Before the harvest, the number of spikes per m2 was evaluated, as well as the number of grains per spike and the accumulation potential of the stands. The total economic yield of grain was determined from the harvested plots after drying (14%) and prelimi-nary cleaning. The percentage and yield of grain over 2.5 mm sieve were also determined as well as the weight
of 1000 grains (TGW) and the content of N substances in the grain (%).
The results were processed by the multi-factorial anal-ysis of variance using the STATISTICA computer pro-gram. To test average differences, the test according to Tukey was used on a 5 and 1% significance level. Homo-geneity of variances was verified using Bartlett’s test.
RESULTS AND DISCUSSION
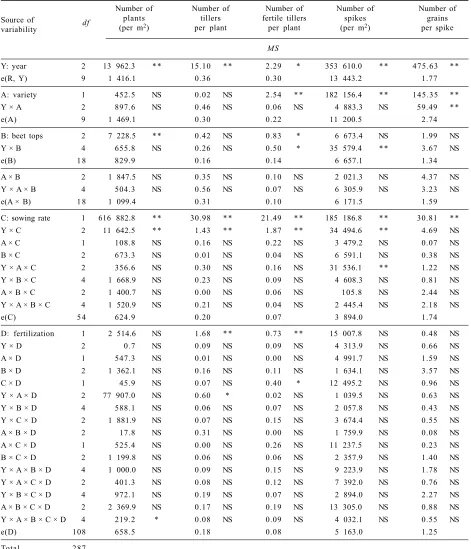
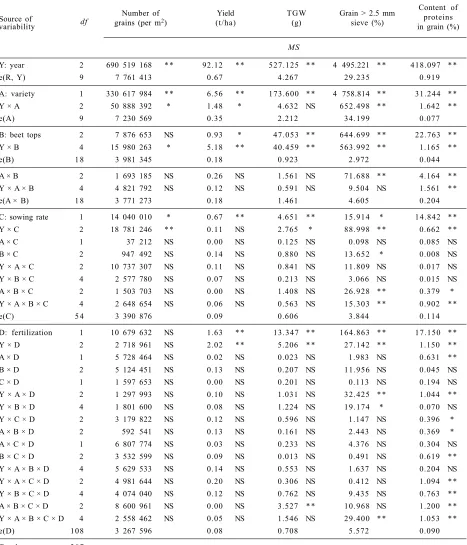
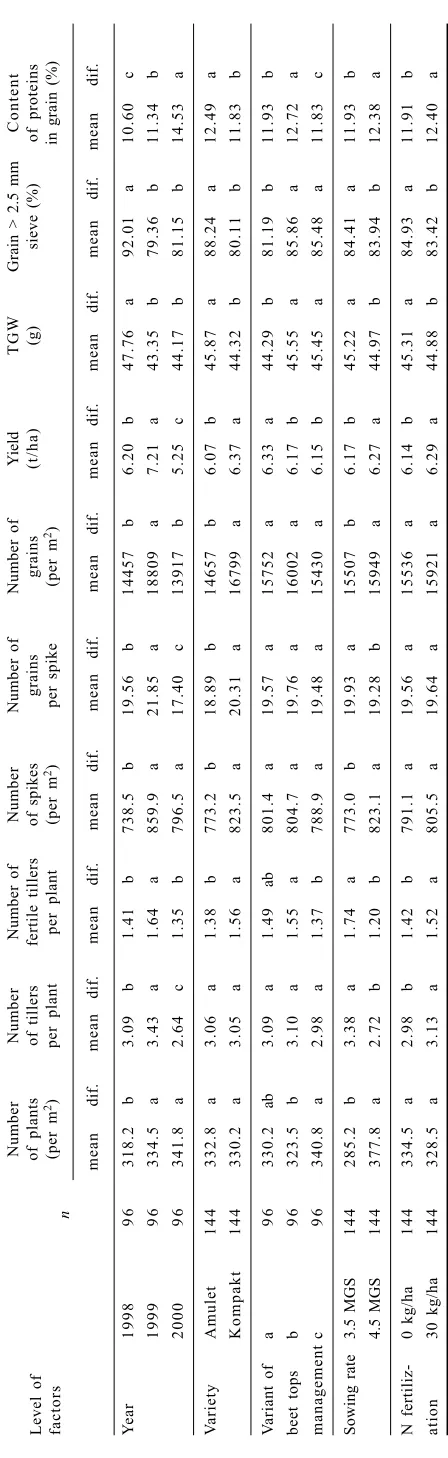
The statistical evaluation of the effect of particular fac-tors on characters under study including their interaction from a half experimental series in 1998 to 2000 is summa-rized in Table 6. Table 7 gives the differences between the particular levels of factors.
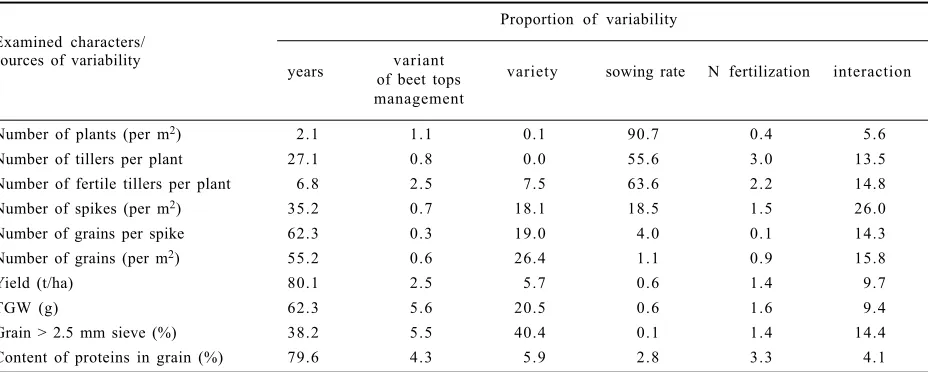
[image:3.595.64.529.82.158.2]The results show that all factors under the study af-fected highly significantly or significantly the general level of the economic yield and the parameters of the spring barley grain quality. The particular year (80.1%) in the course of the three-year study appeared as having a dominant effect on the total yield variability, the pro-portion of other factors ranged from 0.6% (sowing rate) to 5.7% (variety). In case of quality characters, the year-class affected most the variability of the content of N sub-stances in the grain (79.6%) and TGW (62.3%), the variability of quality parameters was also highly affect-ed by the genetic factor of the variety (grain over 2.5 mm
Table 4. Characteristics of incorporated beet tops
Year Yield (t/ha) Dry matter (%) Content of main macroelements (% in dry matter)
N P K Ca Mg
1997 23.96 21.15 2.12 0.28 4.15 0.88 0.41
1998 18.80 14.55 3.55 0.37 3.16 0.76 0.54
1999 21.20 16.90 3.33 0.264 4.75 0.44 0.47
Table 5. Proportion of factors on total variability of examined characters (%)
Examined characters/
Proportion of variability
sources of variability
years of beet topsvariant variety sowing rate N fertilization interaction
management
Number of plants (per m2) 2.1 1.1 0.1 90.7 0.4 5.6
Number of tillers per plant 27.1 0.8 0.0 55.6 3.0 13.5
Number of fertile tillers per plant 6.8 2.5 7.5 63.6 2.2 14.8
Number of spikes (per m2) 35.2 0.7 18.1 18.5 1.5 26.0
Number of grains per spike 62.3 0.3 19.0 4.0 0.1 14.3
Number of grains (per m2) 55.2 0.6 26.4 1.1 0.9 15.8
Yield (t/ha) 80.1 2.5 5.7 0.6 1.4 9.7
TGW (g) 62.3 5.6 20.5 0.6 1.6 9.4
Grain > 2.5 mm sieve (%) 38.2 5.5 40.4 0.1 1.4 14.4
[image:3.595.67.531.573.759.2]sieve 40.4%, TGW 20.5%). Similar results are also men-tioned by Cerkal et al. (2001), Ehrenbergerová et al. (1999), Flašarová and Onderka (1997) etc. The significant effect of the year was also demonstrated by interactions of par-ticular year-classes with other experimental factors.
The level of studied characters was considerably vari-able in relation to the intensity of particular factors
(Ta-ble 7). Between years, significant differences were found in the creation, reduction and compensation of yield-forming elements, in the yield and quality of grain. The significantly highest yield of grain was achieved in 1999 (7.21 t/ha). On the other hand, the lowest yield level was achieved in 2000 (5.25 t/ha) when the precipitation defi-cit and the occurrence of highly above-average
tempera-Table 6a. Analysis of variance for examined characters in 1998 to 2000
Source of df
Number of Number of Number of Number of Number of
variability
plants tillers fertile tillers spikes grains
(per m2) per plant per plant (per m2) per spike
MS
Y: year 2 13 962.3 * * 15.10 * * 2.29 * 353 610.0 * * 475.63 * *
e(R, Y) 9 1 416.1 0.36 0.30 13 443.2 1.77
A: variety 1 452.5 NS 0.02 NS 2.54 * * 182 156.4 * * 145.35 * *
Y × A 2 897.6 NS 0.46 NS 0.06 NS 4 883.3 NS 59.49 * *
e(A) 9 1 469.1 0.30 0.22 11 200.5 2.74
B: beet tops 2 7 228.5 * * 0.42 NS 0.83 * 6 673.4 NS 1.99 NS
Y × B 4 655.8 NS 0.26 NS 0.50 * 35 579.4 * * 3.67 NS
e(B) 1 8 829.9 0.16 0.14 6 657.1 1.34
A × B 2 1 847.5 NS 0.35 NS 0.10 NS 2 021.3 NS 4.37 NS
Y × A × B 4 504.3 NS 0.56 NS 0.07 NS 6 305.9 NS 3.23 NS
e(A × B) 1 8 1 099.4 0.31 0.10 6 171.5 1.59
C: sowing rate 1 616 882.8 * * 30.98 * * 21.49 * * 185 186.8 * * 30.81 * *
Y × C 2 11 642.5 * * 1.43 * * 1.87 * * 34 494.6 * * 4.69 NS
A × C 1 108.8 NS 0.16 NS 0.22 NS 3 479.2 NS 0.07 NS
B × C 2 673.3 NS 0.01 NS 0.04 NS 6 591.1 NS 0.38 NS
Y × A × C 2 356.6 NS 0.30 NS 0.16 NS 31 536.1 * * 1.22 NS
Y × B × C 4 1 668.9 NS 0.23 NS 0.09 NS 4 608.3 NS 0.81 NS
A × B × C 2 1 400.7 NS 0.00 NS 0.06 NS 105.8 NS 2.44 NS
Y × A × B × C 4 1 520.9 NS 0.21 NS 0.04 NS 2 445.4 NS 2.18 NS
e(C) 5 4 624.9 0.20 0.07 3 894.0 1.74
D: fertilization 1 2 514.6 NS 1.68 * * 0.73 * * 15 007.8 NS 0.48 NS
Y × D 2 0.7 NS 0.09 NS 0.09 NS 4 313.9 NS 0.66 NS
A × D 1 547.3 NS 0.01 NS 0.00 NS 4 991.7 NS 1.59 NS
B × D 2 1 362.1 NS 0.16 NS 0.11 NS 1 634.1 NS 3.57 NS
C × D 1 45.9 NS 0.07 NS 0.40 * 12 495.2 NS 0.96 NS
Y × A × D 2 77 907.0 NS 0.60 * 0.02 NS 1 039.5 NS 0.63 NS
Y × B × D 4 588.1 NS 0.06 NS 0.07 NS 2 057.8 NS 0.43 NS
Y × C × D 2 1 881.9 NS 0.07 NS 0.15 NS 3 674.4 NS 0.55 NS
A × B × D 2 17.8 NS 0.31 NS 0.00 NS 1 759.9 NS 0.08 NS
A × C × D 1 525.4 NS 0.00 NS 0.26 NS 11 237.5 NS 0.23 NS
B × C × D 2 1 199.8 NS 0.06 NS 0.06 NS 2 357.9 NS 1.40 NS
Y × A × B × D 4 1 000.0 NS 0.09 NS 0.15 NS 9 223.9 NS 1.78 NS
Y × A × C × D 2 401.3 NS 0.08 NS 0.12 NS 7 392.0 NS 0.76 NS
Y × B × C × D 4 972.1 NS 0.19 NS 0.07 NS 2 894.0 NS 2.27 NS
A × B × C × D 2 2 369.9 NS 0.17 NS 0.19 NS 13 305.0 NS 0.88 NS
Y × A × B × C × D 4 219.2 * 0.08 NS 0.09 NS 4 032.1 NS 0.55 NS
e(D) 108 658.5 0.18 0.08 5 163.0 1.25
Total 287
[image:4.595.63.534.78.627.2]tures at the time of flowering (Table 3) negatively affect-ed the productivity of spikes (17.40 grains) contributing generally to the formation of the lowest accumulation capacity of stands (13 917 grains/m2). Persisting un-favourable weather conditions in the period of grain for-mation and ripening were also the cause of the high content of N substances in grain (14.53%). Conditions
for the attainment of high economic yield in 1999 were formed already in the course of tillering (3.43 tillers) with a subsequent maintenance of the high number of produc-tive tillers (1.64) with the highest number of grains per spike (21.85). Although the significantly highest accu-mulation potential (18 809 grains/m2) was not sufficiently fulfilled (TGW 43.35 g), it was fully sufficient for
achiev-Table 6b. Analysis of variance for examined characters in 1998 to 2000
Source of df Number of Yield TGW Grain > 2.5 mm
Content of
grains (per m2) (t/ha) (g) sieve (%) proteins
variability in grain (%)
MS
Y: year 2 690 519 168 * * 92.12 * * 527.125 * * 4 495.221 * * 418.097 * *
e(R, Y) 9 7 761 413 0.67 4.267 29.235 0.919
A: variety 1 330 617 984 * * 6.56 * * 173.600 * * 4 758.814 * * 31.244 * *
Y × A 2 50 888 392 * 1.48 * 4.632 NS 652.498 * * 1.642 * *
e(A) 9 7 230 569 0.35 2.212 34.199 0.077
B: beet tops 2 7 876 653 NS 0.93 * 47.053 * * 644.699 * * 22.763 * *
Y × B 4 15 980 263 * 5.18 * * 40.459 * * 563.992 * * 1.165 * *
e(B) 1 8 3 981 345 0.18 0.923 2.972 0.044
A × B 2 1 693 185 NS 0.26 NS 1.561 NS 71.688 * * 4.164 * *
Y × A × B 4 4 821 792 NS 0.12 NS 0.591 NS 9.504 NS 1.561 * *
e(A × B) 1 8 3 771 273 0.18 1.461 4.605 0.204
C: sowing rate 1 14 040 010 * 0.67 * * 4.651 * * 15.914 * 14.842 * *
Y × C 2 18 781 246 * * 0.11 NS 2.765 * 88.998 * * 0.662 * *
A × C 1 37 212 NS 0.00 NS 0.125 NS 0.098 NS 0.085 NS
B × C 2 947 492 NS 0.14 NS 0.880 NS 13.652 * 0.008 NS
Y × A × C 2 10 737 307 NS 0.11 NS 0.841 NS 11.809 NS 0.017 NS
Y × B × C 4 2 577 780 NS 0.07 NS 0.213 NS 3.066 NS 0.015 NS
A × B × C 2 1 503 703 NS 0.00 NS 1.408 NS 26.928 * * 0.379 *
Y × A × B × C 4 2 648 654 NS 0.06 NS 0.563 NS 15.303 * * 0.902 * *
e(C) 5 4 3 390 876 0.09 0.606 3.844 0.114
D: fertilization 1 10 679 632 NS 1.63 * * 13.347 * * 164.863 * * 17.150 * *
Y × D 2 2 718 961 NS 2.02 * * 5.206 * * 27.142 * * 1.150 * *
A × D 1 5 728 464 NS 0.02 NS 0.023 NS 1.983 NS 0.631 * *
B × D 2 5 124 451 NS 0.13 NS 0.207 NS 11.956 NS 0.045 NS
C × D 1 1 597 653 NS 0.00 NS 0.201 NS 0.113 NS 0.194 NS
Y × A × D 2 1 297 993 NS 0.10 NS 1.031 NS 32.425 * * 1.044 * *
Y × B × D 4 1 801 600 NS 0.08 NS 1.224 NS 19.174 * 0.070 NS
Y × C × D 2 3 179 822 NS 0.12 NS 0.596 NS 1.147 NS 0.396 *
A × B × D 2 592 541 NS 0.13 NS 0.161 NS 2.443 NS 0.369 *
A × C × D 1 6 807 774 NS 0.03 NS 0.233 NS 4.376 NS 0.304 NS
B × C × D 2 3 532 599 NS 0.09 NS 0.013 NS 0.491 NS 0.619 * *
Y × A × B × D 4 5 629 533 NS 0.14 NS 0.553 NS 1.637 NS 0.204 NS
Y × A × C × D 2 4 981 644 NS 0.20 NS 0.306 NS 0.412 NS 1.094 * *
Y × B × C × D 4 4 074 040 NS 0.12 NS 0.762 NS 9.435 NS 0.763 * *
A × B × C × D 2 8 600 961 NS 0.00 NS 3.527 * * 10.968 NS 1.200 * *
Y × A × B × C × D 4 2 558 462 NS 0.05 NS 1.546 NS 29.400 * * 1.053 * *
e(D) 108 3 267 596 0.08 0.708 5.572 0.090
Total 287
[image:5.595.65.532.79.624.2]T
able 7. Dif
ferences between factors in 1998 to 2000
Level of n Number Number Number of Number Number of Number of Y ie ld T G W
Grain > 2.5 mm
C o ntent factors of plants of tillers fertile tillers of spik es grains grains (t/ha) (g ) sieve (%) of proteins (per m 2) per plant per plant (per m 2) per spike (per m 2)
in grain (%)
mean dif. mean dif. mean dif. mean dif. mean dif. mean dif. mean dif. mean dif. mean dif. mean dif. Y ea r 1998 9 6 3 1 8 .2 b 3.09 b 1.41 b 7 38.5 b 1 9.56 b 1 4457 b 6.20 b 47.76 a 92.01 a 10.60 c 1999 9 6 3 3 4 .5 a 3.43 a 1.64 a 8 59.9 a 2 1.85 a 1 8809 a 7.21 a 43.35 b 79.36 b 11.34 b 2000 9 6 3 4 1 .8 a 2.64 c 1.35 b 7 96.5 a 1 7.40 c 1 3917 b 5.25 c 44.17 b 81.15 b 14.53 a V ariety Amulet 1 4 4 3 3 2 .8 a 3.06 a 1.38 b 7 73.2 b 1 8.89 b 1 4657 b 6.07 b 45.87 a 88.24 a 12.49 a Kompakt 1 4 4 3 3 0 .2 a 3.05 a 1.56 a 8 23.5 a 2 0.31 a 1 6799 a 6.37 a 44.32 b 80.11 b 11.83 b V ariant of a 9 6 3 3 0 .2 ab 3.09 a 1.49 ab 801.4 a 1 9.57 a 1 5752 a 6.33 a 44.29 b 81.19 b 11.93 b beet tops b 9 6 3 2 3 .5 b 3.10 a 1.55 a 8 04.7 a 1 9.76 a 1 6002 a 6.17 b 45.55 a 85.86 a 12.72 a management c 9 6 3 4 0 .8 a 2.98 a 1.37 b 7 88.9 a 1 9.48 a 1 5430 a 6.15 b 45.45 a 85.48 a 11.83 c Sowing rate 3.5 MGS 1 4 4 2 8 5 .2 b 3.38 a 1.74 a 7 73.0 b 1 9.93 a 1 5507 b 6.17 b 45.22 a 84.41 a 11.93 b 4.5 MGS 1 4 4 3 7 7 .8 a 2.72 b 1.20 b 8 23.1 a 1 9.28 b 1 5949 a 6.27 a 44.97 b 83.94 b 12.38 a N fertiliz-0 kg/ha 1 4 4 3 3 4 .5 a 2.98 b 1.42 b 7 91.1 a 1 9.56 a 1 5536 a 6.14 b 45.31 a 84.93 a 11.91 b ation 30 kg/ha 1 4 4 3 2 8 .5 a 3.13 a 1.52 a 8 05.5 a 1 9.64 a 1 5921 a 6.29 a 44.88 b 83.42 b 12.40 a a
– early ploughing down, b – late ploughing down, c – beet tops removed; means with different letters are statistically signif
icant at
P
≤
0.05
Minimum significant differences Ye
ar α = 0.05 15.2 0.24 0.22 46.7 0.54 1123 0.33 0.83 2.18 0.39 α = 0.01 20.9 0.33 0.30 64.3 0.74 1544 0.45 1.14 3.00 0.53 V ariety α = 0.05 10.2 0.15 0.12 28.2 0.44 7 1 7 0.16 0.40 1.56 0.07 α = 0.01 14.7 0.21 0.18 40.6 0.63 1030 0.23 0.57 2.14 0.11 V
ariant of beet
ing the relatively highest yield. The proportion of grain (over 2.5 mm sieve) utilizable for malt purposes was, how-ever, significantly lowest (79.36%) amounting to 5.72 t/ha. From the viewpoint of malt quality, the content of N sub-stances was still favourable (11.34%). The grain from the 1998 harvest (yield 6.20 t/ha) showed the best parame-ters with significantly highest TGW (47.76 g), the high proportion of grain over 2.5 mm sieve (92.01%) and the favourable content of N substances in grain (10.60%).
The ploughed down beet tops supported the creation of yield, however, the average differences between vari-ants were not marked (Table 7) being heavily affected by the course of weather conditions in the particular years. The variants with the late ploughing down of beet tops created more favourable conditions for the yield of the spring barley grain. The late ploughing down of beet tops influenced positively the process of tillering and the
[image:7.595.63.536.76.530.2]sub-sequent formation of tillers (3.10 and 1.55 tillers). The spike productivity was also favourably affected (19.76 grains) thus creating conditions for the formation of stands with a high accumulation potential (16 002 grains/m2). The av-erage yield of 6.17 t/ha grain, however, did not corre-spond to the stand condition. The highest yield of grain within the evaluated period (on average) was obtained from the variants in the early ploughed down beet tops (6.33 t/ha). As compared with other variants, the grain showed, however, the significantly lowest values of me-chanical properties (TGW 44.29 g, grain over 2.5 mm sieve 81.19%), the content of N substances in grain (11.93%) was significantly lower than in the variants with the high-est content of N substances in the late ploughed down beet tops (12.72%). The lowest yield level (6.15 t/ha) in the variants with harvested beet tops was a response to the generally lowest accumulation capacity of stands
Table 8. Values of yield components, yield and grain quality in 1998 to 2000
Factors/parameters Variant of beet tops management Variety Sowing rate N fertilization
a b c Amulet Kompakt 3.5 MGS 4.5 MGS 0 kg/ha 30 kg/ha
Number of plants (m2) 1998 317.8 304.8 332.0 322.5 313.9 268.7 367.7 321.2 315.2
1999 333.5 327.9 342.1 332.7 336.3 279.2 389.8 337.5 331.5
2000 339.3 337.9 348.2 343.1 340.5 307.8 375.8 344.6 338.9
Number of tillers 1998 3.09 3.16 3.04 3.15 3.03 3.47 2.72 3.01 3.18
per plant 1999 3.52 3.52 3.25 3.47 3.40 3.85 3.01 3.33 3.54
2000 2.67 2.61 2.65 2.57 2.71 2.83 2.45 2.60 2.69
Number of fertile tillers 1998 1.48 1.55 1.20 1.31 1.51 1.77 1.05 1.33 1.49
per plant 1999 1.62 1.80 1.52 1.58 1.71 1.99 1.30 1.59 1.70
2000 1.36 1.31 1.40 1.24 1.47 1.47 1.24 1.34 1.37
Number of spikes 1998 762.1 754.9 698.6 720.4 756.6 734.1 743.0 724.6 752.4
(per m2)
1999 846.8 887.5 845.4 834.9 884.8 829.7 890.1 852.6 867.2
2000 795.2 771.8 822.7 764.2 828.9 755.1 838.0 796.1 797.0
Number of grains 1998 19.82 19.70 19.15 19.56 19.56 20.01 19.10 19.43 19.69
per spike 1999 21.86 21.75 21.93 21.28 22.42 22.31 21.39 21.88 21.82
2000 17.04 17.82 17.34 15.84 18.96 17.47 17.33 17.37 17.43
Number of grains 1998 15 108 14 891 13 374 14 095 14 820 14 711 14 204 14 077 14 838
(per m2)
1999 18 554 19 318 18 556 17 775 19 844 18 515 19 103 18 669 18 949
2000 13 595 13 796 14 361 12 100 15 735 13 295 14 539 13 861 13 974
Yield (t/ha) 1998 6.81 6.02 5.77 6.18 6.22 6.11 6.28 5.96 6.44
1999 7.07 7.33 7.22 7.04 7.37 7.16 7.25 7.22 7.20
2000 5.11 5.16 5.47 4.98 5.52 5.23 5.27 5.26 5.24
TGW (g) 1998 47.56 47.85 47.86 48.63 46.89 47.86 47.65 47.79 47.73
1999 41.06 44.50 44.50 43.88 42.83 43.66 43.05 43.83 42.88
2000 44.24 44.29 43.97 45.10 43.24 44.14 44.20 44.31 44.03
Grain > 2.5 mm sieve 1998 91.03 92.90 92.09 95.00 89.02 92.11 91.90 92.38 91.64
(%) 1999 70.86 83.46 83.76 81.53 77.19 80.62 78.10 80.72 78.00
2000 81.68 81.21 80.58 88.19 74.12 80.50 81.81 81.69 80.61
Content of proteins 1998 10.40 11.24 10.15 10.97 10.23 10.36 10.83 10.28 10.92
in grain (%) 1999 11.27 11.71 11.05 11.53 11.16 11.04 11.65 11.23 11.46
(15 430 grains/m), the low level of tiller formation partici-pating in it first of all (1.37). The yield of grain over 2.5 mm sieve and TGW were lower as compared with late plough-ing down (85.48% and 45.45 g), the content of nitrogen in grain was significantly lowest (11.83%).
Between the particular varieties, significant differenc-es were found both in the economic yield and grain qual-ity. The Kompakt variety was on average 4.7% better as for yield (6.37 t/ha) than the Amulet variety that, howev-er, achieved higher average values of TGW and the pro-portion of grain over 2.5 mm sieve (45.87 g, 88.24%). The quality of grain of the Amulet variety was negatively af-fected by the increased accumulation of N substances in grain (12.49%). The higher economic yield of the Kompakt variety was based on significantly higher numbers of created tillers (1.56) supported by the significantly high-er productivity of spikes (20.31 grains).
The sowing rate amount significantly affected the val-ues of all parameters under investigation. Variants sown 4.5 MGS have higher average yields of grain. The self-reg-ulation capacity of stands established using 3.5 MGS sow-ing rates was positively reflected in the higher numbers of formed and realized tillers (3.38, 1.74), the higher numbers of grains per spike (19.93), TGW (45.22 g) and the higher proportion of grain over 2.5 mm sieve (84.41%). The num-ber of plants per unit area decided, however, on the gener-al productivity of stands. The deficit of plants in 3.5 MGS sowing rate became the reason of the low accumulation capacity of stands (15 507 grains/m2). The average yield difference as against variants sown 4.5 MGS (6.27 t/ha) amounted to 0.1 t/ha. The accumulation of N substances in the spring barley grain developed more intensively in stands sown by denser sowing rates (12.38%). Kopecký (1983) also gives similar results in his paper.
The nitrogen fertilization at the rate of 30 kg/ha was demonstrated through the statistically significant in-crease in the yield (by 0.15 t/ha) but significantly wors-ened technological parameters of the barley grain. These trends were also corroborated by Flašarová and Onderka (1997), Kandera (1994) and Tichý et al. (1991) who noted that the effect of N fertilization was particu-larly related to the year-class and a number of other fac-tors.
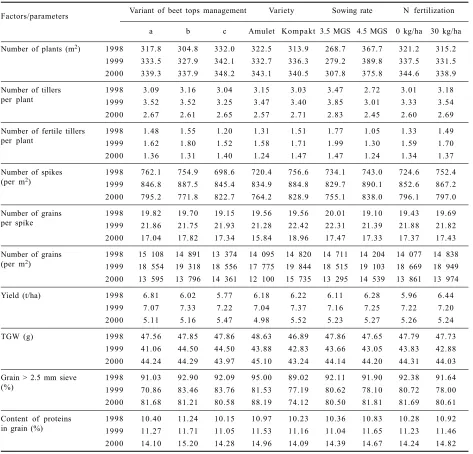
The effect of various methods of beet tops manage-ment on the creation of yield and grain quality in the course of the particular years is summarized in Table 8. With respect to the fact that the organic matter of beet tops contains considerable amounts of nutrients in dry matter (Table 4), mineralization of post-harvest residues can affect the growth and development of barley as well as its quality (Provazník et al. 2000, Cerkal et al. 2001). The course of weather ranks to the greatest extent among fac-tors that regulate effects of ploughed down beet tops. Under relatively favourable precipitation conditions (1998, 1999) when the allocation of precipitation contrib-utes to the sufficient water supply for plants from the beginning of vegetation, the ploughed down beet tops support the formation and realization of tillers, thereby
creating conditions for establishing a higher accumula-tion capacity of stands. On the other hand, in years with a dry spring and above-average temperatures (2000), the ploughing down can be depressive for yield. In order to obtain a quality yield with maximum TGW values and relatively the highest proportion of grain over 2.5 mm sieve, it is more suitable to leave beet tops to wither and to plough them down later. With respect to the lower ac-cumulation of N substances in grain, however, variants with early ploughing down and removed beet tops ap-pear to be more suitable.
The variety, which guarantees the technological quality of grain with exactly defined parameters of yield, appears to be an important factor. Each variety used an individual mechanism of genetic potential, implementation of which was shown in the course of establishing, formation and reduction of each yield-forming component. In the Kom-pakt variety, the basis of the higher yield potential and ac-tual yield was based on the higher level of tillering and on the higher number of grains per spike. The Amulet variety showed a capability to compensate for the lower accumu-lation potential by higher TGW values and by the higher proportion of grain over 2.5 mm sieve. These variety dif-ferences demonstrate limiting factors of biological materi-al in the production process. It has been shown that typical, genetically fixed properties of varieties can fully manifest themselves under favourable weather conditions of a particular year only (Ehrenbergerová et al. 1999).
According to Tichý et al. (1991), the unsuitable choice of the sowing rate can cause a depression in the yield of grain thus affecting its general quality. Experiments showed that differences between 3.5 MGS and 4.5 MGS sowing amounts were decisive from the viewpoint of the grain yield and quality. The number of plants per unit area appeared to be an important regulation element of the productivity of stands. In the stands from 3.5 MGS sowing rates, the compensation of missing plants by higher numbers of fertile tillers or higher productivity of spikes did not occur, however, grain with better quality parameters was obtained.
REFERENCES
Cerkal R., Zimolka J., Hřivna L. (2001): Using plough down of sugar beet tops to affect the production parameters of spring barley in a maize-growing region. Rostl. Výr., 47: 319–325. Ehrenbergerová J., Vaculová K., Zimolka J., Müllerová E.
(1999): Yield characters and their correlations with quality indicators of hull-less spring barley grain. Rostl. Výr., 45: 53–59. (In Czech)
Flašarová M., Onderka M. (1997): Formation and compensa-tion of yield components in chosen spring barley geno-types. Rostl. Výr., 43: 449–454. (In Czech)
Kandera M. (1994): The effect of nitrogen fertilizing on the grain yields of spring barley and its quality. Rostl. Výr., 40: 577–585. (In Czech)
Kopecký M. (1983): The effect of some intensification fac-tors on the yield and quality of spring barley Opal, Karat and Zefír. Rostl. Výr., 29: 973–984. (In Czech)
Ložek O., Bízik J., Fecenko J. (1991): Dynamics of inorganic nitrogen in the soil and its influence on the yield and quali-ty of spring barley. Rostl. Výr., 37: 441–451. (In Czech) Provazník K., Richter R., Zimolka J. (2000): Ploughing in
sugar beet tops and the effect on the content of mineral ni-trogen in the soil during spring barley cultivation. Rostl. Výr., 46: 443–449. (In Czech)
Tichý F., Kopecký M., Souček A. (1991): The influence of the basic intensification factor on yield and quality of spring barley. Rostl. Výr., 35: 1293–1305. (In Czech) Tóth Š. (2000): The influence of selected growing factors on
the spring barley yield. Rostl. Výr., 46: 297–301.
Zimolka J., Richter R., Ehrenbergerová J., Cerkal R. (1999): Effect of the date of ploughing in of sugar-beet tops on the yield and quality of malt barley. Proc. Int. Conf. ISTRO 99, Brno: 216–218.
Received on May 2, 2003
ABSTRAKT
Modifikace pěstitelských opatření ve vztahu k zaorávce chrástu a jejich vliv na strukturu výnosu a kvalitu zrna jarního ječmene
V polyfaktoriálním polním pokusu, založeném metodou dělených bloků a poddílců, byl v letech 1998–2000 sledován vliv tří systémů hospodaření s řepným chrástem, dvou výsevků a dvou úrovní dusíkatého hnojení a vliv interakcí těchto faktorů
na produkční a kvalitativní ukazatele jarního ječmene odrůd Amulet a Kompakt. Z hodnocení vyplývá dominantní vliv roč -níku na variabilitu všech sledovaných znaků. Podíl ročníku na variabilitě znaků byl od 2,1 % (počet rostlin na m2) do 80,1 % (výnos), na variabilitách jakostních parametrů měl vysoký podíl také genetický faktor odrůdy (PPZ 40,4 %, HTZ 20,5 %). Úroveň znaků byla značně variabilní v závislosti na průběhu povětrnostních podmínek ročníku. Nejvyšší výnos zrna byl dosažen v roce 1999 (7,21 t/ha), nejnižší v roce 2000 (5,25 t/ha). Nejlepší kvalitativní parametry vykázalo zrno ze sklizně
1998 (výnos 6,20 t/ha) s průkazně nejvyšší HTZ (47,76 g), vysokým podílem předního zrna (92,01 %, 5,54 t/ha) a s příznivým obsahem N látek v zrnu (10,60 %). Zaorávaný chrást podporoval tvorbu výnosu, průměrné diference mezi jednotlivými variantami byly však minimální a silně ovlivněné průběhem povětrnosti ročníků. Vhodnější podmínky pro tvorbu výnosu (6,17 t/ha) a formování mechanických vlastností zrna jarního ječmene (HTS 45,55 g, PPZ 85,86 %) vytvář e-ly varianty s pozdní zaorávkou chrástu, nejmenší akumulace dusíkatých látek byla zjištěna na variantách se sklizeným chrástem (11,83 %). Výsevek ovlivnil průkazně hodnoty všech sledovaných znaků, vyšší průměrný výnos zrna poskyto-valy varianty seté 4,5 MGS (6,27 t/ha), kvalitativně lepší zrno bylo získáno z porostů setých 3,5 MKZ (HTZ 45,22 g, PPZ 84,41 %, N látky 11,93 %). Mezi odrůdami byly zjištěny průkazné rozdíly v hospodářském výnosu i v kvalitě zrna. Odrůda Kompakt byla v průměru o 4,7 % výnosově lepší (6,37 t/ha) než odrůda Amulet, která však dosahovala vyšších průměrných hodnot HTZ a podílu předního zrna (45,87 g, 88,24 %). Jakost zrna odrůdy Amulet negativně ovlivnila zvýše-ná akumulace dusíkatých látek v zrnu (12,49 %). Hnojení dusíkem v dávce 30 kg/ha se proti kontrole projevilo statisticky významným zvýšením výnosu pouze v roce 1998 (o 7,5 %), v ostatních letech nebyl přírůstek výnosu zaznamenán. Ve všech sledovaných letech se po aplikaci dusíku v dávce 30 kg/ha snížily hodnoty HTZ i podílu předního zrna a došlo ke zvýšení obsahu dusíkatých látek v zrnu.
Klíčová slova: jarní ječmen; řepný chrást; výnos; struktura výnosu; kvalita zrna;dusíkatéhnojení; výsevek
Corresponding author: