Leaf area is the main determining factor af-fecting light interception by crop and biomass production. Therefore, any reduction of leaf ex-pansion rate is usually associated with reduction of photosynthesis and consequent decrease in above-ground biomass, grain yield and quality (Schurr et al. 2006, Váňová et al. 2006). In cere-als, especially barley and wheat, leaf blade area is just a part of total assimilatory area. Wang et al. (2001) mentioned that non-leaf green organs consisting of ear, peduncle and flag leaf sheath have a greater importance for the grain filling of wheat than flag leaf and penultimate blades. In the field, spring cereal crops are characterized by occurrence of spacious leaf area produced in short time interval which limits considerably reaching the high proportion of absorbed light needed for driving crop productivity (Tardieu et al. 2005). More detailed study of environmental effects on leaf emergence is necessary for understanding canopy growth dynamics in fluctuated environ-mental conditions.
Spring barley crop development is a succession of phenological events regulated by relationship between genotype and environment. Rate of leaf appearance is a developmental trait which, to-gether with final number of differentiated leaves, determines the length of crop cycle (Abeledo et al. 2004). Leaf area growth and thus ontogenetic and leaf area insertion changes are strongly modi-fied by temperature, radiation and shading as well as photoperiod, air humidity, water supply and nitrogen nutrition (Tardieu et al. 2005, Schurr et al. 2006).
The rate of leaf formation on the stems depends primarily on the temperature effect on leaf expan-sion, especially at the zones of cell expansion. Tamaki et al. (2002) and Bartholomew and Williams (2005) showed that emergence of new leaves is a linear function of time at any temperature regime. When temperature increases, time interval of two successive leaf tips appearance is dropped (Kirby 1995, Bos and Neuteboom 1998, McMaster et al. 2003). Leaf growth rate raises with increasing
tem-Leaf growth under temperature and light control
J. Repková, M. Brestič, K. Olšovská
Faculty of Agrobiology and Food Resources, Slovak Agricultural University in Nitra,
Nitra, Slovak Republic
ABSTRACT
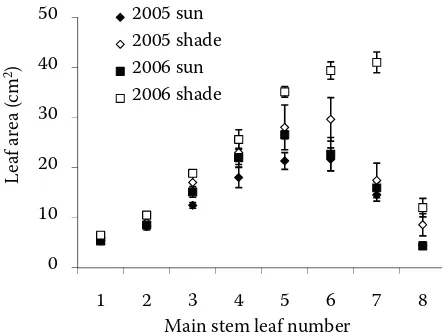
Dynamics of crop growth and photosynthesis are two main processes that are of major importance for adaptation of plants to their environment. Two experiments were carried out during 2005 and 2006 with sun and shaded barley plants. The results showed that leaf area increased with leaf position on the main stem up to leaf position 5 for sun and leaf position 6 for shaded plants, and then declined towards flag leaves. Air temperature affected leaf appear-ance, mainly at the beginning of the growing season. A positive correlation between leaf expansion duration (LED) and accumulated temperature sum was measured for both variants, LED linearly increased with temperature sum. Leaf expansion rate (LER) showed a similar dependence on accumulated air temperatures in both light variants. A strong relation was found between soil temperature and LER for the first four leaves of the main stem of shaded plants in 2006. In shaded environment the higher LER was associated with lower accumulated irradiance sum when light restriction supported an increase of leaf elongation and final leaf length.
Keywords: barley (Hordeum vulgare L.); leaf growth; leaf area; leaf expansion; temperature; irradiance; sun and shaded leaves
perature until the optimum temperature is reached, but reversely further raise of temperature could reduce leaf growth (Cao and Moss 1989, Tamaki et al. 2002). Some previous studies (Hay and Wilson 1982, McMaster et al. 2003) demonstrated that root zone temperature affects leaf growth, leaf development and physiological processes, such as carbon assimilation and transpiration of higher plants. Therefore, leaf development rate is more closely associated with soil temperature near soil surface than air temperature during early stages of crop development. As Hay and Wilson (1982) observed for wheat leaf appearance, soil tempera-ture at the depth of 5 cm was more effective than air temperature.
Light environment can also modify leaf growth and tiller appearance in cereal crops, mainly if canopy plants compete for light (Abeledo et al. 2004). Self-shading of plants within a dense canopy is associated with an increase of leaf length and reduction of tillering. These effects are linked to altered red: far red ratio light quality due to shading at canopy basis. As a consequence of compensation for lower light interception the increase of leaf area could occur, through the increased leaf elongation rate and leaf expansion duration (Bahmani et al. 2000, Evers et al. 2006). In some cases leaf shading can increase the length of elongation zone and leaf elongation rate, but Bos and Neuteboom (1998) did not find a significant effect of light intensity on leaf elongation rate. Miralles and Richards (2000) observed that increasing light intensity is usually associated with an increase of time interval between appearance of two consecutive leaves.
In cereal crops, leaf blade expansion takes plac-es rather via an increase in length than in width since their emergence from sheath bundle (Bos and Neuteboom 1998). For that reason the analysis
of area expansion of individual leaves requires an assessment of such parameters as leaf elongation rate (LER), leaf elongation duration (LED) and maximum leaf width. Effects of temperature on leaf appearance rates and growth are usually quantified as some form of thermal time calculated from air temperature above the crop canopy (McMaster et al. 2003). Since temperature varies considerably under field conditions, the aim of this work was to analyze effects of fluctuating air and soil temperatures on barley leaves growth under two contrasting light environments, full irradiation and simulated shade, applying the parameters mentioned.
MATERIAL AND METHODS
Plant material and cultivation. Barley plants (Hordeum vulgare L.) were cultivated (variety Kompakt from Slovakia) in plastic pots with soil substrate in a density of 390 plants per square meter in the natural environmental conditions within the vegetation cage of Dept. of Plant Physiology, Slovak University of Agriculture in Nitra (latitude 48°18'N, longitude 18°05'E). Experiments were carried out during the 2005 and 2006 growing seasons. Plants were fertilized and watered optimally, so that no symptoms of nutrient or water deficits were ob-served. Two variants of light regime were applied. In the first variant, plants were cultivated under natural light environment with full irradiation. The second variant, shaded, was simulated by non-weave textile restricting direct sunlight, where daily maximum did not exceed 20% of the total solar irradiation.
[image:2.595.70.532.630.758.2]Measurements. During each growing season the microclimate conditions (photosynthetic active radiation, air and soil temperature, rela-tive humidity) were monitored using a LiCor
Table 1. Climatic conditions of growing seasons 2005 and 2006: accumulated air temperature sum, average daily temperature and photosynthetic photon flux density (PPFD) measured over the canopy and in the simulated shaded conditions
Accumulated temperature
sum (°C) temperature (°C)Average daily the canopy (mol/mSum of PPFD over 2) in the shade (mol/mSum of PPFD 2)
2005 2006 2005 2006 2005 2006 2005 2006
Growing season 1787 1783 18.2 18.7 2089.90 1963.78 275.89 302.93
April (14.4.–30.4.) 221 258 13.0 15.2 300.51 328.04 49.19 68.22
May 538 505 17.4 16.3 701.13 563.82 91.25 117.63
June 609 626 20.3 20.9 697.51 662.79 88.08 84.18
1400 datalogger (LiCor, Nebraska, USA). The tem-perature and humidity sensor was 5 cm far from soil surface and the thermometer was in the depth of 10 cm in the soil. The LI-190 sensors (LiCor, USA) measuring photon flux density of PAR were located above barley canopy, at two different levels inside the canopy (at the 4th and 5th leaf level) and in the simulated shaded environment. Data of air and soil temperature were recorded each minute, photosynthetic photon flux density each second; from them daily maximum, minimum and average values were calculated. Accumulated temperature was calculated for defined time interval as a sum of average daily air or soil temperatures. Accumulated photosynthetic photon flux density (PPFD) sum was calculated in a similar way.
Leaf growth was evaluated as a leaf area increase. This measurement was done in 10 repetitions per variant, until the leaf number 8 (flag leaf for sun and for shaded variant) on the main shoot was fully elongated (during all growing season). All leaves were numbered from stem basis in order as they had appeared. All measurements were carried out in a non-destructive way.
Leaf length and width were measured with a ruler. Then leaf area was calculated as:
A = l × w × k
where: l is leaf length, w is leaf width and k is a multiplying factor (0.64) usually used for barley (Šesták et al. 1971).
Leaf elongation was evaluated as a rate of leaf expansion per unit time (LER, mm/day). LER was estimated as maximal individual leaf length divided by the growth period (Singh et al. 2006). Leaf ex-pansion duration (LED, day) of individual leaves was calculated as the number of days between the appearance and full emergence of an individual leaf (Bahmani et al. 2000).
Statistical analysis. All measured data were evaluated by the statistical packet of Microsoft Excel.
RESULTS AND DISCUSSION
The course of climatic factors during both grow-ing seasons is characterized in Table 1. Results show that accumulated air temperature sum and 0
5 10 15 20 25
14
/4
16
/4
18
/4
20
/4
22
/4
24
/4
26
/4
28
/4
30
/4
Ave
ra
ge
te
m
pe
ra
tu
re
(
°
C)
[image:3.595.65.279.58.220.2]air 05 air 06 soil 05 soil 06
Figure 1. Average daily air and soil temperatures meas-ured at the beginning of the growing season (April) – from the plant sowing day up to the 3rd and 4th leaf occurrences
0 10 20 30 40 50
1 2 3 4 5 6 7 8
Le
af
ar
ea (
cm
2)
Main stem leaf number 2005 sun
2005 shade 2006 sun 2006 shade
[image:3.595.64.285.590.757.2]average daily air temperature were similar for both seasons. Substantial temperature differences were found at the beginning of both seasons, when average daily air temperature in 2005 was by 3°C lower than in 2006 (Figure 1).
This fact resulted in an increase of time inter-val between leaf appearance and leaf expansion starting in the case of the 1st and 2nd main stem leaves according to Kirby (1995) and Tamaki et al. (2002). Also, lower temperature was a reason for higher requirements of accumulated temperature sum for the first three leaves appearance in shaded variant. The rate of leaf initiation and leaf emer-gence had linear relationships with temperature
as was also found by Porter and Gawith (1999). On the other hand, the accumulated sum of pho-tosynthetic active radiation during vegetation was 2089.90 and 1963.78 mol/m2 for sun variant in 2005 and 2006, respectively; in the shaded variant the values measured were 275.89 and 302.93 mol/m2 in 2005 and 2006, respectively, which was 13.2 and 15.4% of daily sum. These values reflected minimal differences in the amount of light incident on the canopy between both growing seasons.
Leaves on the main stem in shaded variant had larger leaf blade area than those at similar positions in sun variant. Leaf area increased from base of the main stem up to leaf position 5 for sun leaves R² = 0.9577
y= 0.0493x+ 1.2208
R² = 0.9059
y= 0.0447x+ 3.2635
0 10 20 30 40 50
0 200 400 600 800 1000
LE
D
(d
ay
)
Accumulated temperature sum
2005
sun shade
R² = 0.9547
y= 0.06x– 1.2076
y= 0.0494x+ 1.3497
R² = 0.912
-5 5 15 25 35 45
0 200 400 600 800 1000
LE
D
(d
ay
)
Accumulated temperature sum
[image:4.595.73.523.63.244.2]2006
Figure 3. Leaf expansion duration (LED, day) as a linear function of accumulated air temperature. Data were measured for leaves growing in conditions of full sunlight (full symbols) and in shaded conditions (empty sym-bols) during growing season 2005 and 2006
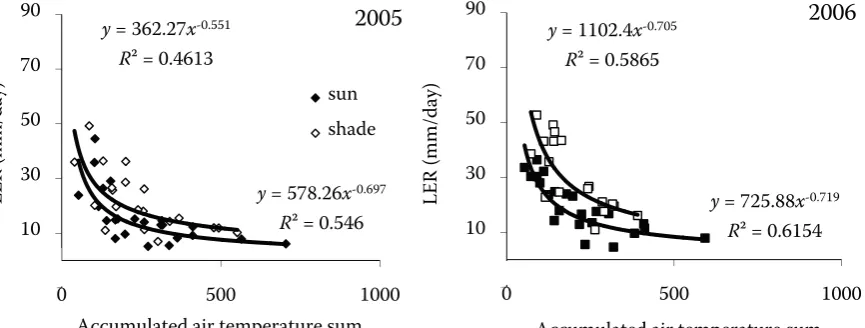
y= 578.26x-0.697
R² = 0.546
y= 362.27x-0.551
R² = 0.4613
-10 10 30 50 70 90
0 500 1000
LE
R
(m
m
/d
ay
)
Accumulated air temperature sum
2005
sun shade
y= 725.88x-0.719
R² = 0.6154
y= 1102.4x-0.705
R² = 0.5865
-10 10 30 50 70 90
0 500 1000
LE
R
(m
m
/d
ay
)
Accumulated air temperature sum
2006
Figure 4. Relationship between the leaf expansion rate (LER, mm/day) and accumulated air temperature sum in barley leaves cultivated in different light regimes (full sunlight – full symbols; shade – empty symbols) in 2005 and 2006. Plotted data were measured for all main stem leaves
R² = 0.9547 y= 0.06x- 1.2076
y= 0.0494x+ 1.3497 R² = 0.912
0 10 20 30 40 50
0 200 400 600 800 1000
Le
af
ex
pa
ns
io
n
du
ra
tio
n
(d
)
Accumulated temperature sum
2006
[image:4.595.73.506.536.700.2]and leaf position 6 for shaded leaves (Figure 2) and then declined towards flag leaves which had the smallest leaf area. In 2006, a longer time interval of leaf expansion connected with higher accumulated temperature sum was observed for 6th shaded leaves than in 2005. This pattern was strongly associated with increasing leaf elongation rate and leaf width, as it was already confirmed for cereal crop species by Kirby et al. (1982) and Bos and Neuteboom (1998). Differences in individual leaf area in shaded variant was related to increased final leaf length and leaf elongation rate as was earlier found by Bahmani et al. (2000) and Evers et al. (2006).
Hay and Porter (2006) stated that under opti-mal conditions, duration of leaf expansion from its
[image:5.595.64.529.60.236.2]emergence at a given node tends to be constant in thermal time. Our results indicated temperature influence on LED. A positive correlation between LED and accumulated air temperature sum for sun and shaded growing conditions was measured in 2005 and 2006 (Figure 3), where LED was a linear function of increased accumulated air temperatures with R2 values not less than 0.90. For leaf positions higher than position 5 for sun leaves and 6 for shade leaves, it was measured that maximal leaf length required shorter LED with lower accumulated temperature sum. Bultynck et al. (2004) mentioned that it is due to a higher extent of leaf elongation rate and leaf width of upper leaves and in several cases it could be associated with an increase of apical dome size. Figure 5. Leaf expansion rate (LER, mm/day) in relation to accumulated soil temperature sum for sun (full sym-bols) and shaded leaves (empty symsym-bols). Data were measured from the 1st leaf position to the 4th leaf position on the main stem during 2005 and 2006
y= 909.8x-0.741
R² = 0.5623
y= 289.02x-0.749
R² = 0.5941
0 10 20 30 40 50 60
0 500 1000
LE R (m m /d ay )
PPFD (mol/m2)
2005
sun shade
y= 775.49x-0.713
R² = 0.6075
y= 219.81x-0.549
R² = 0.3857
0 10 20 30 40 50 60
0 500 1000
LE R ( m m /d ay )
PPFD (mol/m2)
2006
Figure 6. Leaf expansion rate (LER, mm/day) in relation to accumulated photosynthetic active radiation sum plotted for all main stem leaves of sun and shaded variant during growing seasons 2005 and 2006
y = 568.75x–0.688
R² = 0.6514
y= 379.34x–0.551
R² = 0.5925
-10 10 30 50 70 90
0 500 1000
LE
R
(
m m /d ay)
Accumulated soil temperature sum
2005
sun shade
y= 1096.9x–0.7636
R2= 0.8630
y= 1643.8x–0.763
R² = 0.8734
-10 10 30 50 70 90
0 500 1000
LE R (m m /d ay )
Accumulated soil temperature sum
2006
LE R (m m /d ay ) LE R (m m /d ay ) LE R (m m /d ay ) LE R (m m /d ay )y= 568.75x-0.688
R² = 0.6514
y= 379.34x-0.551
R² = 0.5925
0 10 20 30 40 50 60 70 80 90
0 200 400 600 800 1000
LER
(mm/d)
Accumulated soil temperature sum
2005 sun shade
y= 1096.9x-0.7636 R2= 0.8630
y = 1643.8x-0.763
R² = 0.8734
0 10 20 30 40 50 60 70 80 90
0 200 400 600 800 1000
LE
R
(mm/d)
Accumulated soil temperature sum
2006
sun shade
[image:5.595.67.518.545.720.2]At an early stage of barley development, leaf elongation increased with main stem position, as was reported earlier (Kirby et al. 1982, Natr and Natrova 1992, Bultynck et al. 2004). In com-parison with duration of leaf elongation, the rate of leaf expansion is more sensitive to fluctuat-ing environment as was also stated by Hay and Porter (2006). LER decreased exponentially with raised accumulated temperature sum (Figure 4). Only small differences in correlations were meas-ured between the sun and shaded variant, if LER was plotted to accumulated air temperature sum; however, when LER was plotted to accumulated soil temperature sum, stronger correlation was found for the first four leaves of the main stem in 2006 in sun and shaded plants with R2 = 0.86 and R2 = 0.87, respectively (Figure 5). Results showed that soil temperature was more important for leaves emergence than air temperature, especially at the beginning of plant development as it is also con-firmed by Hay and Wilson (1982) and McMaster et al. (2003).
Although the influence of temperature on leaf expansion rate has been already well described, the effect of light intensity on leaf expansion rate is still a matter of debate (Bos and Neuteboom 1998, Bahmani et al. 2000, Evers et al. 2006). Our results pointed out that in shading conditions barley leaf elongation rate was intensive and more sensitive to temperature in both experimental years. For similar values of LER as were measured in full sunlight conditions, only small interval of accumulated irradiance sum (20–90 mol/m2) was required to achieve the maximal leaf length in shaded plants (Figure 6).
Results showed that shaded environment consist-ently increased final leaf length mainly through increased leaf expansion rate and duration of leaf expansion. Both leaf growth parameters were de-pendent on accumulated temperature sum control. This suggests that a fully developed concept of the relationship of temperature to plant growth and development is an important aspect of dynamic crop simulation models.
REFERENCES
Abeledo L.G., Calderini D.F., Slafer G.A. (2004): Leaf appearance, tillering and their coordination in old and modern barleys from Argentina. Field Crop Re-search, 86: 23–32.
Bahmani I., Hazard L., Varlet-Grancher C., Betin M., Lemaire G., Mattew C., Thom E.R. (2000):
Differ-ences in tillering of long- and short-leaved peren-nial ryegrass genetic lines under full light and shade treatments. Crop Science, 40: 1095–1102.
Bartholomew P.W., Williams R.D. (2005): Cool-season grass development response to accumulated tempera-ture under a range of temperatempera-ture regimes. Crop Sci-ence, 45: 529–534.
Bos H.J., Neuteboom J.H. (1998): Growth of individual leaves of spring wheat (Triticum aestivum L.) as in-fluenced by temperature and light intensity. Annals of Botany, 81: 141–149.
Bultynck L., Ter Steege M.W., Schortemeyer M., Poot P., Lambers H. (2004): From individual leaf elongation to whole shoot leaf area expansion: a comparison of three Aegilops and two Triticum species. Annals of Botany, 94: 99–108.
Cao W., Moss D.N. (1989): Temperature effect on leaf emergence and phyllochron in wheat and barley. Crop Science, 29: 1018–1021.
Evers J.B., Vos J., Andrieu B., Struik P.C. (2006): Ces-sation of tillering in spring wheat in relation to light interception and red: far red ratio. Annals of Botany, 97: 649–658.
Hay R.K.M., Wilson G.T. (1982): Leaf appearance and extension in field- grown winter wheat plants: the im-portance of soil temperature during vegetative growth. Journal of Agricultural Science, 99: 403–410.
Hay R.K.M., Porter J.R. (2006): The Physiology of Crop Yield. Blackwell Publishing, Oxford.
Kirby E.J.M., Appeyard M., Fellowes G. (1982): Effect of sowing date on the temperature response of leaf emergence and leaf size in barley. Plant, Cell and En-vironment, 5: 477–484.
Kirby E.J.M. (1995): Factors affecting rate of leaf emer-gence in barley and wheat. Crop Science, 35: 11–19. Miralles D.J., Richards R.A. (2000): Responses of leaf and
tiller emergence and primordium initiation in wheat and barley to interchanged photoperiod. Annals of Botany, 85: 655–663.
McMaster G.S., Wilhelm W.W., Palic D.B., Porter J.R., Jamieson P.D. (2003): Spring wheat leaf appearance and temperature: extending the paradigm? Annals of Botany, 91: 697–705.
Natr L., Natrova Z. (1992): Characteristics of leaf growth in 6 varieties of spring wheat cultivated under con-stant conditions. Rostlinná Výroba, 38: 247–251. (In Czech)
Porter J.R., Gawith M. (1999): Temperatures and the growth and development of wheat: a review. European Journal of Agricultural, 10: 23–36.
Corresponding author:
Doc. Ing. Marián Brestič, CSc., Slovenská poľnohospodárska univerzita v Nitre, Tr. A. Hlinku 2, 949 76 Nitra, Slovenská republika
phone: + 421 376 414 448, fax: + 421 377 411 451, e-mail: [email protected] Singh V., Pallaghy C.K., Singh D. (2006): Phosphorus
nutrition and tolerance of cotton to water stress II. Water relations, free and bound water and leaf expan-sion rate. Field Crop Research, 96: 199–206. Šesták Z., Čatský J., Jarvis P.G. (1971): Plant
Photosyn-thetic Production: Manual of Methods. Dr. W. Junk N.V. Publishers, Den Haag.
Tamaki M., Kondo S., Itani T., Goto Y. (2002): Tempera-ture responses of leaf emergence and leaf growth in barley. Journal of Agricultural Science, Cambridge, 138: 17–20.
Tardieu F., Reymond M., Muller B., Granier C., Si-monneau T., Sadok W., Welcker C. (2005): Linking
physiological and genetic analyses of the control of leaf growth under changing environmental condi-tions. Australian Journal of Agricultural Research, 56: 937–946.
Váňová M., Palík S., Hajšlová J., Burešová I. (2006): Grain quality and yield of spring barley in field trials under variable growing conditions. Plant, Soil and Environment, 52: 211–219.
Wang Z.-M., Wei A.-L., Zheng D.-M. (2001): Photo-synthetic characteristic of non-leaf organs of winter wheat cultivars differing in ear type and their rela-tionship with grain mass per ear. Photosynthetica, 39: 239–244.