Computed tomographic analysis of tibiotarsal bone
mineral density and content in turkeys as influenced
by age and sex
A. Charuta
1, R.G. Cooper
2, M. Pierzchała
3, J.O. Horbańczuk
31Vertebrates Morphology Department, Siedlce University of Natural Sciences and Humanities, Siedlce, Poland
2Eurohouse, Dog Kennel Lane, Walsall, UK
3Institute of Genetics and Animal Breeding PAS, Jastrzębiec, Poland
ABSTRACT: Changes in the volumetric bone mineral density (vBMD) and bone mineral content (BMC) of tibiotarsal bones of growing turkeys as affected by birds’ age, sex, and within-the-bone location, respectively, were determined by computed tomography. The research was performed on 165 heavy-type BIG 6 turkeys reared between weeks (wk) 3–16 of age. The computed tomography (pQCT) measurement, conducted at 18 and 50% of the bone length, comprised a bone fragment which was 0.07 mm thick for the compact and the spongious substance collectively. It should be noted that the diaphyses of the tibiotarsal bones in turkeys (580 mg/cm3) had greater vBMD than the proximal metaphyses (300 mg/cm3), (P ≤ 0.001). BMC was higher
in metaphyses for both sexes. Significant differences between the BMC of the metaphyses and the diaphyses were observed in males and females at wk 3 (P ≤ 0.01), 6 (P ≤ 0.05), and 9 (P ≤ 0.001), and at wk 3 (P ≤ 0.05) and 12 (P ≤ 0.01), respectively. vBMD in the diaphyses gradually attenuated with age for both sexes, from 688 mg/cm3 (wk 3) to 532 mg/cm3 (wk 16). vBMD of the metaphyses was constant in females, but in males
it achieved maximum values of 350 mg/cm3 at wk 6 and 12 and minimum of 260 mg/cm3 at wk 9 and 16.
Correlations between body weight (BW) and vBMD of the diaphyses were observed in males (r = –0.85, P ≤ 0.001) and females (r = –0.52, P ≤ 0.01). It can be concluded that vBMD loss in diaphyses diminished bone-breaking strength leading in investigated turkeys to deformities and bone fractures.
Keywords: volumetric bone mineral density; bone mineral content; tibiotarsal bone; turkey; mineralisation; computed tomography
The intensityof poultry production may lead to deformities in birds’ bone density, especially in the tibiotarsal bones and bow legs (Peters et al., 2002; Cooper and Horbańczuk, 2004; Charuta et al., 2008; Cooper et al., 2008; Tykałowski et al., 2010). Clear clinical symptoms, such as growth disorders or lame-ness (Lynch et al., 1992) occur in different fowl spe-cies (Simsa and Ornan, 2007; Simsa et al., 2007), e.g. chicken broilers (Lynch et al., 1992; Lilburn, 1994), ducks (Charuta et al., 2011), and ratites (Horbańczuk et al., 2004; Cooper et al., 2010). Birds that suffer from the described condition are bow-legged and unwilling to move; in extreme cases, fractures of the diaphysis of the tibial bone may occur (Crespo
et al., 1999). Bone mechanical strength and resist-ance are related to increasing body weight during growth, high stocking rate (Jendral et al., 2008), lack of exercise (Crespo et al., 1999; Burs et al., 2008), and problems with mineralisation including changes in mineral density and content(Tatara et al., 2004).
authors claim that pQCT is an effective technique to measure vBMD in laying hens, which allows resolution of total vBMD as well as cortical and trabecular vBMD.
The bone tissue of fast-growing birds is particu-larly exposed to mechanical injuries. Thus, it is necessary to monitor growth and chemical com-position of the tibiotarsal bones during breeding while feeding particular diets (Suchý et al., 2009; Ebeid et al., 2011). Healthy bones are, therefore, fundamental for proper functioning of a bird’s mechano-skeletal system.
The objective of the present study was to de-termine the changes in the bone mineral density and bone mineral content of tibiotarsal bones of growing turkeys as affected by birds’ age, sex, and within-the-bone location with the use of computed tomography.
MATERIAL AND METHODS
The research was conducted on 165 heavy-type BIG 6 turkeys reared according to production scheme recommended by Kartzfehn (Moorgut Kartzfehn von Kameke GmbH & Co. KG, Bösen, Germany) in wk 3–21 of age. Birds were divided into 11 age groups: 3, 6, 9, 12, and 16 wk of life (both sexes) and group of wk 21 that was composed only of males. The study was conducted on 15 males and females from each age group which were kept separately on bedding under standard turkey farm-ing conditions with free access to feed and water. Five types of mixed feeds (Bacutil Sp. z.o.o., Bedlno Radzyńskie, Poland) with different levels of protein and energy were used (Table 1). Since according to the production scheme females were kept till wk 16 of age and then they were slaughtered, the comparison of vBMD and BMC was done until this period (16 wk). The body weight (BW) and bone weight were also determined, as shown in Table 2.
The growth rate during rearing period in turkey females and males varied from 29 to 35 and 93 to 125 g per day in 3- and 16-week-old birds, respec-tively. The feed intake per kg of body weight gain in females and males ranged 1.37–1.39 kg of feed (3 wk) and 2.88–2.56 kg of feed (16 wk). In turn, the mortality rate was very low (ca. 2%) during the whole period of rearing. The density per m2 with
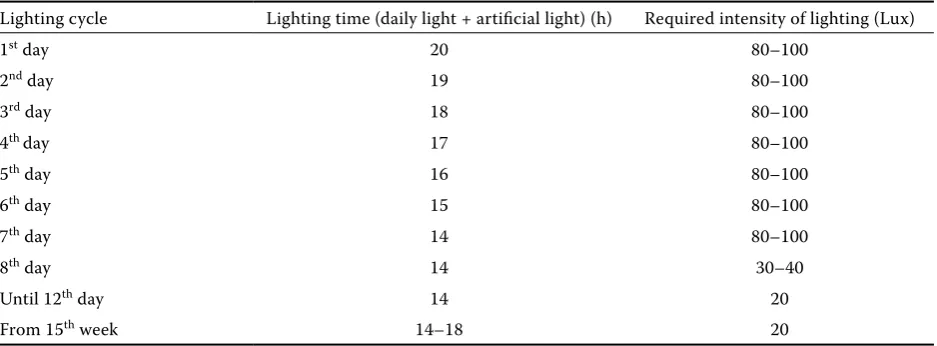
respect to age and sex was as follows: 9–10 birds till wk 5 for both sexes, and 3.5 females and 2.5 males in wk 16. The lighting cycle is shown in Table 3.
After turkey’s slaughtering the left tibiotarsal bones determined for analysis were cleaned off the soft tissues and frozen for storing at –25 to –30oC.
To record all the activities, an X-ray plate graph of the isolated bones with an aluminium trochlea was taken to make an image of the degree of bone mineralisation.
Using a high resolution peripheral quantitative computed tomography (pQCT) XCT Research SA Plus (Stratec Medizintechnik GmbH, Pforzheim, Germany), the analysis of in situ structure of the proximal metaphysis and the middle of the dia-physis of the tibiotarsal bones was performed. The taken measurements of bones are described below.
Volumetric bone mineral density (vBMD)in situ
– mean density (mg/cm3) at 18% of the length of the
metaphysis and 50% of the length of the diaphysis of the tibiotarsal bone, combined of the compact and the cancellous bone.
[image:2.595.63.532.647.758.2]Bone mineral content (BMC) in situ – bone min-eral content (mean) per 1 mm slice (mg/mm) was attained. Mineral content deduced of the total bone (within a 1 mm slice). The measurements were con-ducted at 18% of the length of the metaphysis and 50% of the length of the diaphysis of the tibiotarsal bone, collectively for the compact and the cancel-lous bone. The pQCT measurement, conducted at 18 and 50% of the bone length, comprised a bone fragment which was 0.07 mm thick for the compact and the spongious substance collectively.
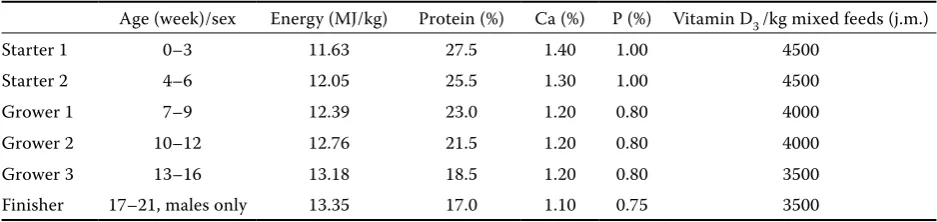
Table 1. Mixed feeds with differentiated content of energy, protein, Ca, P, and vitamin D3 used in turkeys’ diet
Age (week)/sex Energy (MJ/kg) Protein (%) Ca (%) P (%) Vitamin D3 /kg mixed feeds (j.m.)
Starter 1 0–3 11.63 27.5 1.40 1.00 4500
Starter 2 4–6 12.05 25.5 1.30 1.00 4500
Grower 1 7–9 12.39 23.0 1.20 0.80 4000
Grower 2 10–12 12.76 21.5 1.20 0.80 4000
Grower 3 13–16 13.18 18.5 1.20 0.80 3500
Tomographic analysis of the proximal metaphy-sis was conducted in 18% of the bone length, and the analysis of the middle of the diaphysis of the tibiotarsal bone in the middle (50%) of the bone length, at the voxel of 0.07 mm at the scanning speed of 4 mm/min. The area for analysis was de-termined after the initial scanning (20 mm/s) and morphometric bone measurements. The threshold coefficient, differentiating the compact bone from the cancellous bone, was determined and amounted to 0.900/cm.
Statistical analysis
The data were transformed (ln (x +1)) to obtain normal distribution. The statistical analysis for com-parison of age-specific influence on bone traits was done using the GLM Procedure of SAS (Statistical Analysis System, Version 9.2., 2008) adjusted by Tukey-Kramer method for multiple comparison for
the SAS model. Analyses were performed as a full random design, using the MIXED Procedure of SAS. The following overall linear model for comparison of the analyzed traits was used:
Yijk = µ + Si + Aj + (SA)ij + Gk + (SG)ik + (AG)jk + + (SAG)ijk + eijk
where:
Si = effect of the ithsection Aj = effect of the jthage
Gk = effect of the kth gender
eijk = usual error term
[image:3.595.67.533.114.226.2]vBMD and BMC values of 21-week-old males, in which the influence of age, sex, and interaction between these two factors were analyzed, were not used in the statistical model. The values given there are only informative. The relations between the body weight, bone weight, and vBMD and BMC of the proximal metaphysis and the middle of the diaphysis of tibiotarsal bones were determined us-ing Pearson’s correlation coefficient.
Table 2. Means and standard error of the mean of body weight (BW) and tibiotarsal bone weight in turkeys as influenced by age and sex
Age (weeks) Males (mean ± SEM) Females (mean ± SEM)
BW (g) bone weight (g) BW (g) bone weight (g) 3 740** ± 25.5 4.43** ± 0.4 612** ± 11.8 7.45** ± 0.54 6 2 714** ± 48.8 15.17* ± 0.84 2 278** ± 13.4 16.12** ± 1.03 9 5 100** ± 209.8 45.19** ± 2.58 4 162** ± 240.3 29.02** ± 1.66 12 9 344** ± 71.6 60.25** ± 1.53 6 954** ± 90.6 48.86** ± 2.97 16 14 196** ± 217.8 78.48* ± 6.36 10 435** ± 217 71.88* ± 4.77
*means within a row are different (P ≤ 0.05) **means within a row are different (P ≤ 0.01)
Table 3. Lighting cycle during the rearing of turkeys as related to the bird’s age
Lighting cycle Lighting time (daily light + artificial light) (h) Required intensity of lighting (Lux)
1st day 20 80–100
2nd day 19 80–100
3rd day 18 80–100
4th day 17 80–100
5th day 16 80–100
6th day 15 80–100
7th day 14 80–100
8th day 14 30–40
Until 12th day 14 20
[image:3.595.64.533.297.470.2]This research was approved by the Local Committee for Ethics in Experimentation on Animals (docu-ment No. 55/2008).
RESULTS AND DISCUSSION
Means for BMC and vBMD in the bone tissue in situ of the proximal metaphysis and diaphysis of the tibiotarsal bones of turkeys as influenced by age and sex are presented in Tables 4 and 5. BMC both in the proximal metaphysis and the diaphy-sis of the tibiotarsal bones in 3-week-old females occurred higher than in 3-week-old males (P ≤ 0.001), whereas at the age of 16 wk it was attenu-ated (Table 4). Additionally, BMC in the proximal metaphysis attenuated only in females between wk 12 and 16 (P ≤ 0.05) (Table 4). BMC of the proxi-mal metaphysis and the middle of tibial bones was significantly related to age (Table 4).
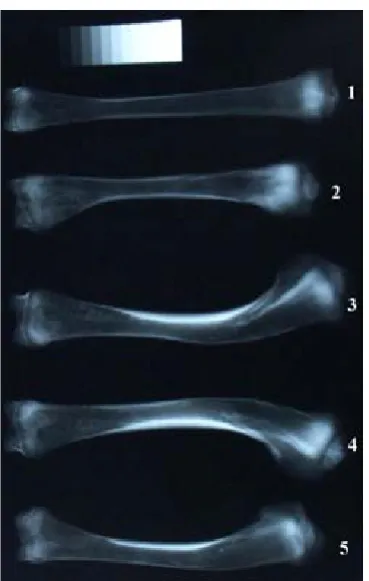
Differences in BMC between the bone sections at particular ages were observed in males in wk 3 (P ≤ 0.01), 6 (P ≤ 0.05), and 9 (P ≤ 0.001). At the age of wk 9 BMC differences between bone sections were the highest in males (P≤ 0.001). In proximal me-taphyses, BMC amounted to 75.36 mg/mm, where-as in the middle of the diaphyses it wwhere-as 40.7 mg/mm (P ≤ 0.01). Such a big difference in BMC between the bone sections may be the cause of bone de-formities in wk 9 in males (Figure 1), whereas in the group of females BMC differences between the middle of the diaphysis and the proximal metaphy-sis were observed only in wk 3 (P ≤ 0.05) and 12 (P ≤ 0.01) (Table 5).
In the middle of tibial bones BMC gradually in-creased with the age of turkeys, reaching 90 mg/mm (wk 16) in males and 70 mg/mm (wk 16) in females at slaughter maturity (Table 4).
[image:4.595.66.535.388.705.2]Differences in BMC in the middle of the diaphy-ses were observed in females age groups between
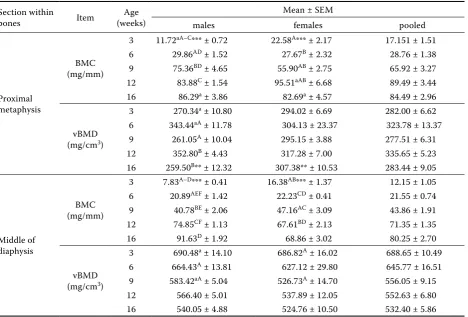
Table 4. Means and standard error of the mean of BMC and BMD in sections within bones: proximal metaphyses and in the middle of the diaphyses of tibiotarsal bones in turkeys as influenced by age and sex
Section within
bones Item (weeks)Age
Mean ± SEM
males females pooled
Proximal metaphysis
BMC (mg/mm)
3 11.72aA–C*** ± 0.72 22.58A*** ± 2.17 17.151 ± 1.51 6 29.86AD ± 1.52 27.67B ± 2.32 28.76 ± 1.38 9 75.36BD ± 4.65 55.90AB ± 2.75 65.92 ± 3.27 12 83.88C ± 1.54 95.51aAB ± 6.68 89.49 ± 3.44 16 86.29a ± 3.86 82.69a ± 4.57 84.49 ± 2.96
vBMD (mg/cm3)
3 270.34a ± 10.80 294.02 ± 6.69 282.00 ± 6.62 6 343.44aA ± 11.78 304.13 ± 23.37 323.78 ± 13.37 9 261.05A ± 10.04 295.15 ± 3.88 277.51 ± 6.31 12 352.80B ± 4.43 317.28 ± 7.00 335.65 ± 5.23 16 259.50B** ± 12.32 307.38** ± 10.53 283.44 ± 9.05
Middle of diaphysis
BMC (mg/mm)
3 7.83A–D*** ± 0.41 16.38AB*** ± 1.37 12.15 ± 1.05 6 20.89AEF ± 1.42 22.23CD ± 0.41 21.55 ± 0.74 9 40.78BE ± 2.06 47.16AC ± 3.09 43.86 ± 1.91 12 74.85CF ± 1.13 67.61BD ± 2.13 71.35 ± 1.35 16 91.63D ± 1.92 68.86 ± 3.02 80.25 ± 2.70
vBMD (mg/cm3)
3 690.48a ± 14.10 686.82A ± 16.02 688.65 ± 10.49 6 664.43A ± 13.81 627.12 ± 29.80 645.77 ± 16.51 9 583.42aA ± 5.04 526.73A ± 14.70 556.05 ± 9.15 12 566.40 ± 5.01 537.89 ± 12.05 552.63 ± 6.80 16 540.05 ± 4.88 524.76 ± 10.50 532.40 ± 5.86
BMC = bone mineral content, BMD = bone mineral density, vBMD = volumetric bone mineral density a,bmeans within a column with the same superscripts are different (P ≤ 0.05)
wk 3 and 9 as well as between wk 6 and 9 (P ≤ 0.01) (Table 4), and between sex groups at 3 wk of age (P ≤ 0.001) (Table 4). Similarly, differences in BMC of the proximal metaphysis were also ob-served between males and females in wk 3 (P ≤ 0.001) (Table 4).
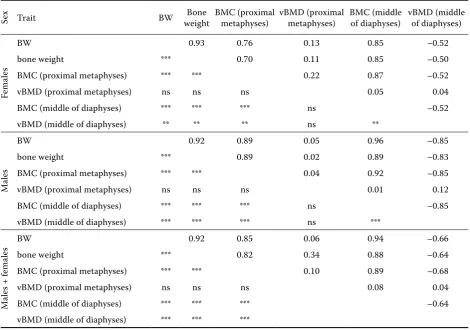
Pearson’s coefficients of simple correlations showed that BMC in proximal metaphysis of the tibiotarsal bones was positively correlated with BW of males (r = 0.89, P ≤ 0.001) and females (r = 0.76,
P ≤ 0.001) (Table 6). The correlation coefficient in the middle of tibial bones also showed the increase of BMC and amounted to r = 0.96 (P ≤ 0.001) for males and r = 0.85 (P ≤ 0.001) for females, respec-tively. When BW increased, BMC went up in the dia- physes of the tibial bones as well (Tables 2 and 6).
It was observed that when BMC increased in the diaphyses of tibiotarsal bones, vBMD in the middle of diaphyses decreased, both for males and females (Table 4). The correlation coefficient
be-tween vBMD in the middle of the diaphyses and BMC was r = –0.52 (P ≤ 0.01) for females and r =
–0.85 (P ≤ 0.001) for males, respectively (Table 6). vBMD depended significantly on the location within the bone and the birds’ age. Significantly (P ≤ 0.001) higher vBMD was found in diaphyses of the tibial bones. vBMD lowered gradually with age in the middle of the diaphyses (Table 4).
vBMD in the proximal metaphyses of the tibio-tarsal bones in 3-week-old turkeys (♂♀ pooled) amounted to 282 mg/cm3, whereas in the
diaphy-ses it was much higher and it reached to 689 mg/ cm3 (P ≤ 0.001). vBMD in the proximal metaphyses
was significantly (P ≤ 0.01) lower (two-fold) than in the diaphyses of bones (Table 4). vBMD in females was similar for all age groups in the metaphyses (Table 4), whereas in males the vBMD achieved maximum at wk 6 and 12 of age (approximately 350 mg/cm3) and minimum at wk 9 and 16
[image:5.595.63.539.368.729.2](ap-proximately 260 mg/cm3). Differences in vBMD in
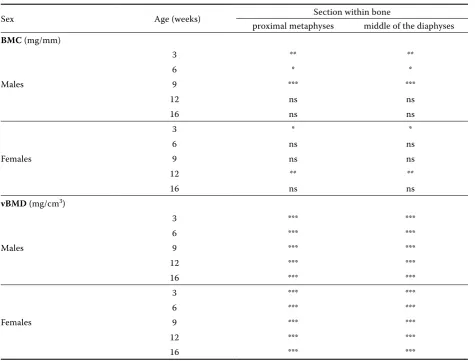
Table 5. Comparison of differences between bone sections for particular ages (contract with Table 4)
Sex Age (weeks) Section within bone
proximal metaphyses middle of the diaphyses
BMC (mg/mm)
Males
3 ** **
6 * *
9 *** ***
12 ns ns
16 ns ns
Females
3 * *
6 ns ns
9 ns ns
12 ** **
16 ns ns
vBMD (mg/cm3)
Males
3 *** ***
6 *** ***
9 *** ***
12 *** ***
16 *** ***
Females
3 *** ***
6 *** ***
9 *** ***
12 *** ***
16 *** ***
578
the proximal metaphyses were observed in males between wk 6 and 9 (P ≤ 0.01) (Table 4). It should be noted that the problem of bone deformities was observed in wk 9 mainly in males (30%) until the cessation of the fattening period (Figure 1).
The vBMD in the middle of the diaphyses of the tibial bone during the first 3 wk in both sexes had the biggest bone mass – near to 700 mg/cm3 (♂♀)
and later gradually attenuated with the age both in males and females to around 530 mg/cm3 (16 wk).
Differences in vBMD of the middle of diaphyses were observed in males between wk 3–9 (P ≤ 0.05) and 6–9 (P ≤ 0.01) (Table 4). Pearson’s correlation coefficient between the body weight and vBMD of diaphyses amounted to r = –0.52 (P ≤ 0.01) for females and r = –0.85 (P ≤ 0.001) for males. It was proved that vBMD of the diaphyses dropped in re-lation to the increasing weight of tibial bones for both sexes (Table 6). On the basis of the analysis of
the correlation coefficient, it was also observed that when BMC increased in the metaphyses, vBMD dropped in the diaphyses (r = –0.68, P ≤ 0.001) (Table 6).
It was for the first time when vBMD and BMC in the proximal metaphysis and middle of tibial bones were analyzed and described systematically dur-ing the entire developmental periodof the turkeys’ production life, i.e. from wk 3 to slaughter age using computed tomography.
Currently there has been a little information in available literature discussing the computed tomo-graphic analysis of tibiotarsal bone mineral den-sity and content in poultry. Until now Tatara et al. (2005) have analyzed mechanical parameters of the tibial and femoral bones but only in one period: in 19-week-old female turkeys with the use of com-puted tomography, and stated that the parameters and mineral density were higher in tibial than in the femoral bones. In the previous research Tatara et al. (2004) studying the internal microstructure of femoral and tibial bones in healthy vs. sick tur-keys with a computed tomography reported that in the former BMD of the trabecular bone was higher than in the latter, whereas the cortical bone density of the femoral bone in both groups of birds was similar. Thus, disorders of microstructure occurred merely in the trabecular bone.
It should be noted that BMC and vBMD and mineralisation changes of tibial bones in poultry depend on different factors, e.g. housing system, type of breeds, and growth rate of birds. Burs et al. (2008) in the research on the tibiotarsal bone strength of turkeys of the heavy type showed signif-icant differences between mechanical strength of the tibia and the system of keeping birds. According to them, in order to increase the strength of the tibial bone of turkeys, it is advisable to keep birds in a house with access to the range area. Active tur-keys had stronger bones. Thus, exercise positively influenced the process of strengthening of bones in birds. Jendral et al. (2008) found that reduction of the physical exercise of hens led to loss of the bone weight and increased the tendency of bones to fractures.
Talaty et al. (2009a, 2009b) confirmed the min-eralisation changes of bones and the differences in the features of the skeleton between various lines of meat-type chickens. In turn, Williams et al. (2003) emphasised that the growth rate of bones is strictly associated with their mineral content and density. They showed that tibial bones of slow growing birds
[image:6.595.85.270.348.639.2]6
129
Figure 1. Tibiotarsal bones of 9-week-old turkeys. Healthy
tibiotarsal bone of 9-week-old males (1), deformed
tibio-tarsal bones of 9-week-old female (2) and 9-week males
(3–5). Thebone shade is different due to different
had higher mineral content and lower bone poros-ity than those of fast growing birds.
CONCLUSION
We conclude that the diaphyses of the tibiotarsal bones in the investigated turkeys had greater vBMD than the proximal metaphyses (P ≤ 0.001). BMC was higher in metaphyses for both sexes. vBMD in the diaphyses gradually attenuated with age for both sexes, whereas in the metaphyses it was constant in females, but in males it achieved maximum value at wk 6 and 12 and minimum at wk 9 and 16. The authors suggest that computed tomography may be a suitable method to evaluate the changes in vBMD and BMC in tibiotarsal bones allowing determina-tion of the bone structure as related to bird’s age and sex. It may be a useful tool for detection of some disorders in mineralisation process during the growth period in turkey flocks.
REFERENCES
Burs M., Zdybel A., Faruga A., Laskowski J. (2008): Effect of housing conditions on the mechanical strength of the femur and tibia in turkeys. Medycyna Weteryna- ryjna, 64, 202–206. (in Polish)
Charuta A., Majchrzak T., Czerwiński E., Cooper R.G. (2008): Spongious matrix of the tibio-tarsal bone of
ostriches (Struthio camelus) – a digital analysis.
Bul-letin of the Veterinary Institute in Pulawy, 52, 175– 178.
Charuta A., Dzierzęcka M., Majchrzak T., Czerwiński E., Cooper R.G. (2011): Computer-generated radio-logical imagery of the structure of the spongious sub-stance in the postnatal development of the tibio-tarsal
bones of the Peking domestic duck (Anas
platyrhyn-chos var. domestica). Poultry Science, 90, 830–835. Cooper R.G., Horbańczuk J.O. (2004): Ostrich nutrition:
[image:7.595.63.534.102.432.2]a review from a Zimbabwean perspective. Revue Sci-entifique et Technique de L’Office International des Épizooites, 23, 1033–1042.
Table 6. Pearson’s correlation coefficient (upper part – correlation coefficients, lower part – correlation significance, P)
Sex Trait BW weightBone BMC (proximal metaphyses) vBMD (proximal metaphyses) BMC (middle of diaphyses) vBMD (middle of diaphyses)
Female
s
BW 0.93 0.76 0.13 0.85 –0.52
bone weight *** 0.70 0.11 0.85 –0.50
BMC (proximal metaphyses) *** *** 0.22 0.87 –0.52
vBMD (proximal metaphyses) ns ns ns 0.05 0.04
BMC (middle of diaphyses) *** *** *** ns –0.52
vBMD (middle of diaphyses) ** ** ** ns **
Male
s
BW 0.92 0.89 0.05 0.96 –0.85
bone weight *** 0.89 0.02 0.89 –0.83
BMC (proximal metaphyses) *** *** 0.04 0.92 –0.85
vBMD (proximal metaphyses) ns ns ns 0.01 0.12
BMC (middle of diaphyses) *** *** *** ns –0.85
vBMD (middle of diaphyses) *** *** *** ns ***
Male
s + f
emale
s BW 0.92 0.85 0.06 0.94 –0.66
bone weight *** 0.82 0.34 0.88 –0.64
BMC (proximal metaphyses) *** *** 0.10 0.89 –0.68
vBMD (proximal metaphyses) ns ns ns 0.08 0.04
BMC (middle of diaphyses) *** *** *** –0.64
vBMD (middle of diaphyses) *** *** ***
Cooper R.G., Naranowicz H., Maliszewska E., Tennett A., Horbańczuk J.O. (2008): Sex-based comparison of limb segmentation in healthy and tibiotarsal rotation ostriches aged 14 months. Journal of the South African Veterinary Association, 79, 142–144.
Cooper R.G., Horbańczuk J.O., Naranowicz H., Maliszew- ska E. (2010): Unilateral tibio-tarsal rotation in a 14-month old ostrich hen destined for slaughter.
Tan-zania Veterinary Journal,27, 11–13.
Crespo R., Stover S.M., Droual R., Chin R.P., Shivaprasad H.L. (1999): Femoral fractures in young male turkeys breeder flock. Avian Diseases, 43, 154–160.
Ebeid T., Fayoud A., Abou El-Soud S., Eid Y., El-Habbak
M. (2011):The effect of omega-3 enriched meat
pro-duction on lipid peroxidation, antioxidative status, immune response and tibia bone characteristics in Japanese quail. Czech Journal of Animal Science, 56, 314–324.
Horbańczuk J.O., Huchzermeyer F., Parada R., Płaza K.
(2004): Four-legged ostrich (Struthio camelus) chick.
Veterinary Record, 154, 736.
Jendral M.J., Korver D.R., Church J.S., Feddes J.J.R. (2008): Bone mineral density and breaking strength of white leghorns housed in conventional, modified, and commercially available colony battery cages. Poultry Science, 87, 828–837.
Korver D.R., Saunders-Blades J.L., Nadeau K.L. (2004):
Assessing bone mineral density in vivo: quantitative
computed tomography. Poultry Science, 83, 222–229. Lilburn M.S. (1994): Skeletal growth of commercial
poul-try species. Poulpoul-try Science, 73, 897–903.
Lynch M., Thorp B., Whitehead C. (1992): Avian tibia dyschondroplasia as a cause of bone deformity. Avian Pathology, 21, 275–285.
Peters T.L., Fulton R.M., Robertson K.D., Orth M.W.
(2002): Effect of antibiotics on in vitro and in vivo avian
cartilage degradation. Avian Diseases, 46, 75–86.
Simsa S., Monsonego Ornan E. (2007): Endochondral
ossification process of the turkeys (Meleagris
gal-lopavo) during embryonic and juvenile development. Poultry Science, 86, 565–571.
Simsa S., Genina O., Monsonego Ornan E. (2007): Matrix metalloproteinase expression and localization in turkey (Meleagris gallopavo) during the endochondral ossifica-tion process. Journal of Animal Science, 85, 1393–1401. Suchý P., Straková E., Herzig I., Steinhauser L., Králik G.,
Zapletal D. (2009): Chemical composition of bone tis-sue in broiler chickens intended for slaughter. Czech Journal of Animal Science, 54, 324–330.
Talaty P.N., Katanbaf M.N., Hester P.Y. (2009a): Life cycle changes in bone mineralization and bone size traits of commercial broilers. Poultry Science, 88, 1070–1077. Talaty P.N., Katanbaf M.N., Hester P.Y. (2009b): Variabil-ity in bone mineralization among purebred lines of meat-type chickens. Poultry Science, 88, 1963–1974. Tatara M.R., Majcher P., Krupski W., Studziński T. (2004):
Volumetric bone density, morphological and mechan-ical properties of femur and tibia in farm turkeys with leg deformities. Bulletin of the Veterinary Institute in Pulawy, 48, 169–172.
Tatara M.R., Sierant-Rożmiej N., Krupski W., Majcher P., Śliwa E., Kowalik S., Studziński T. (2005): Quantita-tive computer tomography for the assessment of min-eralization of the femur and tibia in turkeys. Medycyna Weterynaryjna, 61, 225–228.
Tykałowski B., Stenzel T., Koncicki A. (2010): Selected problems related to ossification processes and their disorders in bird. Medycyna Weterynaryjna, 66, 464–469. (in Polish)
Williams B., Waddington D., Murray D.H., Farquharson C. (2003): Bone strength during growth. Influence of growth rate on cortical porosity and mineralization. Calcified Tissue International, 74, 236–245.
Received: 2012–03–23 Accepted after corrections: 2012–06–28
Corresponding Author
Dr. Anna Charuta, Siedlce University of Natural Sciences and Humanities, Vertebrates Morphology Department, 08-110 Siedlce, Poland