Different Peach Cultivars and their Suitability
for Minimal Processing
Maria del Carmen FUENTES-PÉREZ1, Sergio NOGALES-DELGADO 1,
Maria Concepción AYUSO 2 and Diego BOHOYO-GIL1
1Agrifood Technology Institute (INTAEX), Badajoz, Spain; 2Agraricultural Engineering School,
University of Extremadura, Badajoz, Spain
Abstract
Fuentes-Pérez M.C., Nogales-DelgadoS., AyusoM.C., Bohoyo-Gil D. (2014): Different peach cultivars and their suitability for minimal processing. Czech J. Food Sci., 32: 413–421.
Consumption of minimally processed fruits has been increased lately mainly due to their fresh-like quality character-istics. One of the major alterations that limit the shelf-life of these products is browning caused by polyphenol oxidase (PPO) activity on phenolic compounds. Six yellow-flesh peach cultivars, Spring Lady, Royal Glory, Ruby Rich, Summer Rich, Ryan Sun, and O’Henry, were selected. Peaches were hygienised and then samples were processed in a clean room. Slices were washed in cold tap water, dried, packaged in modified atmosphere, and stored at 4°C during 9 days; physicochemical and other quality parameters were studied. Principal Component Analysis (PCA) and correlation study were carried out in order to evaluate the relation between variables and cultivars. In conclusion, Spring Lady, Royal Glory, and Ruby Rich cultivars were the cultivars that offered the most suitable fruits for fresh-cut processing, mainly due to their low BP and PPO activity.
Keywords: fresh cut fruit; visual quality; enzymatic browning; phenolic content; polyphenol oxidase
Modern consumers due to their lifestyle are de-manding fresh and healthy ready-to-eat. Minimally processed products provide an opportunity to increase healthy food consumption (Rico et al. 2007). These products are popular for their ease of consumption and its nutritional content but they are usually highly perishable. Therefore, maintaining firmness and pre-venting browning are required in order to extend shelf-life, with cultivar selection playing an important role (Arias et al. 2008; Toivonen & Brummell 2008).
Fruits are of great interest due to the presence of natural compounds such as vitamins (C and E), ca-rotenoids, and phenolic compounds that can act as natural antioxidants (Robles-Sánchez et al. 2007). Natural phenols have been reported to have excellent properties as food preservatives as well as to play an
important role in the protection against numerous pathological disturbances (Haminiuk et al. 2012). Peaches, even though having the total antioxidant capacity lower than other fruits (Wolfe et al. 2008), are economically and nutritionally important because they can be a significant component of the diet dur-ing sprdur-ing and summer because they are consumed in large quantities (Remorini et al. 2008).
The shelf-life of minimally processed fruit is gener-ally more limited by changes in their sensory prop-erties rather than by microbial growth (Ares et al. 2008). Appearance of a fresh-cut fruit is the most obvious attribute to the consumer, and strongly affects the decision to buy (Pace et al. 2011). Browning is a particular problem in fruit with white and/or yel-low flesh such as apples, pears and peaches among
others that appears as a consequence of polyphenol oxidase (PPO) action on phenolic compounds to form quinones, which are responsible for brown-ing (Barbagallo et al. 2012). A dip treatment with antioxidant agents after peeling and/or cutting is the most common way to control browning phenomena in fresh-cut fruit, because it can either affect the enzyme or their substrates (Ghidelli et al. 2013).
Among cultivars within a species there might be differences in behaviour when undergoing minimal processing, which may offer very different result in fresh-cut qualities (Hodges & Toivonen 2008). For this reason it is essential to study the response of different cultivars to the stress caused by minimal processing in order to find the most suitable cultivars. Some authors have concluded that the shelf-life of sliced peach and nectarine can vary from 2 to 12 days at 0°C, due to cut surface browning, and this can be a limiting factor to their commercial success (Gorny et al. 1999). For this reason, the aim of this work was to study different peach cultivars and assess their aptitude for minimal processing according to several quality parameters such as colour evolution, browning and phenolic content.
MATERIAL AND METHODS
Plant material. Six yellow flesh peach (Prunus persica /L./ Batch) cultivars supplied by ACOPAEX S.A. (Extremadura, Spain) were selected and ordered according to their harvest date: Spring Lady (May 30th), Royal Glory (June 15th), Ruby Rich (June 20th),
Summer Rich (July 7th), Ryan Sun (August 11th), and
O’Henry (August 16th). The fruits were harvested at
the commercial ripening stage and transported to our laboratory, sorted to eliminate damaged or defective fruit, and stored at 4°C until use, within 24 hours.
Minimal processing. The whole fruits were pre-washed in chilled water (4°C) containing 100 mg/l of sodium hypochlorite (adjusted to pH 6.5 with citric acid) for 2 minutes. The peel and stone were manually removed. Each fruit was cut into slices with sharp stainless steel knives, washed in tap water at 4°C during 2 min and then dried applying a stream of cold air (4 min). The peach slices (around 90 g) were packaged in polypropylene (PP) trays thermosealed with a PP film (TECAPACK, S.L., Cordoba, Spain). Quality analyses on peach slices were carried out at the beginning of each experiment, and after 3, 6, and 9 days of storage at 4°C.
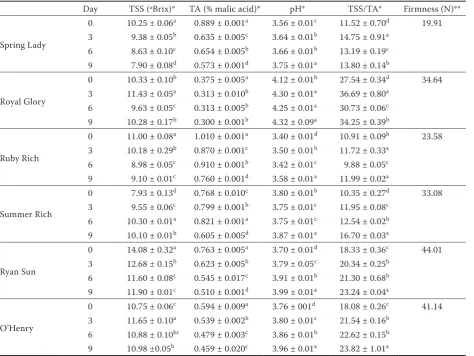
Total soluble solids, titratable acidity and pH determination. Total soluble solids (TSS) content
of a homogenate was determined by refractometry using a R40 refractometer (Mettler Toledo, S.A.E., Coslada, Madrid, Spain); results are expressed as °Brix. Titratable acidity (TA) and pH were quantified using a T50 DGI111-SG automatic titrator (Mettler Toledo, SAE, Coslada, Madrid, Spain). Values were expressed as percentage of malic acid. Acceptability index (TSS/TA) was calculated.
Firmness evaluation. Firmness was evaluated us-ing a TA-XT2i Texture Analyser (Aname, Pozuelo, Madrid, Spain) which comprises the Texture Expert software for data processing. Measurements were carried out by a penetration test, using an 8 mm diameter probe. Ten intact fruits were tested twice, at distally opposite sites from each sample. Firmness was expressed as N.
Colour measurement. Colorimetric measurements were carried out using a colorimeter (Minolta Chroma Meter model CR-200; Konica Minolta Sensing, Inc., Osaka, Japan) with an 8 mm diameter viewing area and D65 illuminant, showing the results in CIELAB space coordinates. Twenty measurements were per-formed at the central points of the slices from each sample. Colour parameters used to estimate changes in appearance of processed fruit during storage were lightness (L*), a*, b*, and hue angle (h°) calculated from Eq. 1 (Voss 1992; Hutching 1994).
h° = arctan b*/a* (1)
Browning potential. Browning potential (BP) was determined using the procedure described by other authors (Arias et al. 2008) slightly modified. Ten grams of homogenate were centrifuged at 14 000 rpm during 15 min at 4°C. The supernatant was filtered through a 110 mm diameter (0.45 mm pore size) filter paper. Finally the resulting clear juice was measured at 440 nm with a spectrophotometer (UV-2401 PC Shimadzu; Shimadzu Scientific Instruments, Inc., Columbia, USA). Four replications were evaluated from each sample. The results were expressed as absorbance units.
15 min at 4°C on a centrifuge (Allegra 25R; Beckman CoulterTM, Palo Alto, USA), and the supernatant was diluted to 50 ml with bidistilled water. Colorimetric reaction was carried out adding 1 ml of Folin-Cio-calteu reagent (Merk) to 2–3 ml of solution. After 3 min, 2 ml of sodium carbonate (20%) was added and diluted with distilled water to a final volume of 20 ml. After an hour (in darkness and cold tempera-ture), the absorbance was measured at 760 nm with a UV-2401 PC Shimadzu spectrophotometer (Shimadzu Scientific Instruments, Inc., Columbia, USA). TPC was expressed as mg gallic acid/100 g fresh sample.
Determination of polyphenol oxidase activity. Polyphenol oxidase activity (PPO) was spectrophoto-metrically determined according to the method de-veloped by Soliva-Fortuny et al. (2001) with slight modifications and using a 0.07M catechol solution as substrate. Peach extract was prepared from 5 g of homogenate which were added 10 ml of extracting solution. This extracting solution contained phos-phate buffer (0.2M, pH 6.5, Panreac), NaCl (0.1M, Panreac), 4% polyvinylpyrrolidone (Merk, Darm-stadt, Germany), 1% Triton X-100. The mixture was homogenized with an IKA T-10 basic Ultra Turrax (IKA® Werke, Staufen, Germany) for 3 min in cold. Then, the mixture was centrifuged (Allegra 25R) at 20 000 rpm during 30 min at 4°C. The supernatant was filtered through a 110 mm diameter (0.45 mm pore size) filter paper and diluted to 10 ml with 0.2M phosphate buffer. The test mixture consisted of 2.9 ml catechol solution and 100 µl enzyme extract. Enzymatic activity was measured by monitoring the absorbance at 400 nm using a UV-2401 PC Shimadzu spectrophotometer (Shimadzu Scientific Instruments, Inc., Columbia, USA). One unit of enzymatic activity was defined as the increase of 0.001 units of absorbance per minute. The results were expressed as Ug/minute.
Statistical analysis. Statistical analysis was carried out using a Statistical Package (SPSS, Vers. 18.0;
Chicago, USA). One-way ANOVA test was used for statistical data analysis and Tukey’s test was applied when significant differences were found (P < 0.05). Correlations between parameters were estimated by the Pearson test with a confidence level of 95% (P < 0.05). Moreover, all analysed parameters were subjected to principal component analysis (PCA) to evaluate relationships between them.
RESULTS AND DISCUSSION
Total soluble solids, titratable acidity and pH. TSS showed a different behaviour in each cultivar (Table 1). TSS decreased for cvs Spring Lady, Ruby Rich, and Ryan Sun, and increased in others such as cvs Summer Rich and O’Henry, and showed oscilla-tions during storage in cv. Royal Glory. Cv. Ryan Sun had the highest TSS content at the beginning and the end of storage. Whereas cv. Summer Rich had the lowest content at the beginning of storage and cv. Spring Lady had the lowest content at the end. The differences in initial TSS between the various cultivars might be explained by the fact that they are related to the date of harvest, with the late cultivars being richer in sugars than the early ones.
TA of the peach slices showed significant differ-ences between the cultivars (Table 1). Cv. Ruby Rich showed the highest TA and cv. Royal Glory the lowest. A marked decrease in acidity occurred for all culti-vars except cv. Royal Glory which was maintained from day 3 to day 9 and in cv. Summer Rich where the acidity increased until day 6 and then decreased until the end. In general, pH increased during stor-age, possibly related to TA decrease. Royal Glory cv. had the highest pH value.
It was found that cv. Royal Glory could have good consumer acceptability, because it was the cultivar with the highest TSS/TA (Table 1). Cvs Ryan Sun and O’Henry also had a high index. Crisosto and
–16 –14 –12 –10 –8 –6 –4 –2 0 2 4
0 3 6 9
a*
Days
50 55 60 65 70 75 80
0 3 6 9
b
*
Days
Spring Lady Royal Glory Ruby Rich
[image:3.595.78.532.608.718.2]Summer Rich Ryan Sun O’Henry
Crisosto (2005) stated that the consumer accept-ability is closely related to the type of cultivar and other quality attributes such as fruit aroma intensity, flavour and texture, and therefore sweetness and acidity indexes cannot be generalised.
Firmness. Although the fruit was harvested accord-ing to commercial criteria for fresh fruit distribution according to ripening values (> 13–27 N) given by Gorny et al. (1998), firmness results showed that Spring Lady and Ruby Rich cultivars were partially ripe (Table 1), whereas the rest of the cultivars of-fered higher firmness.
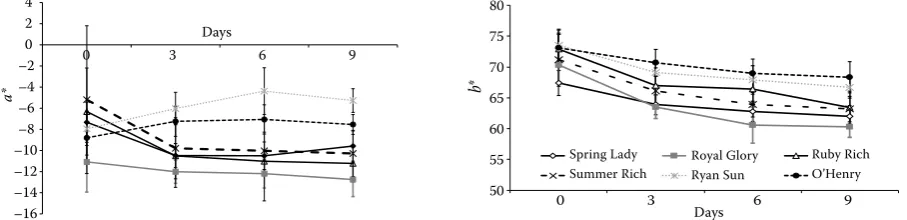
Colour evolution. Some authors evaluate brown-ing usbrown-ing (L*) and (h°) as good indicators of the surface browning because their decrease is associ-ated with an increase in the intensity of browning of minimally processed fruits such as apple, pear and peach (González-Buesa et al. 2011). However, L* and h° values presented an increase for most of the
cultivars, this could be related to the development of whitish colour of the sliced surface. This behav-iour is known as white blush and it was described for peach and nectarine (Boun & Huxsoll 1991; Gorny et al. 1998), it was concluded that white blush was caused by lignin formation. On the contrary, for cv. Ryan Sun, both parameters were decreased and for cv. O’Henry, h° was decreased. Table 2 shows small decreases in L* and h° which were significant changes, so the tissues of these cultivars were rather brown. This might explain the sharp a* increase for cvs Ryan Sun and O’Henry (Figure 1).
[image:4.595.64.539.101.457.2]Other authors associate changes in a* as a good indicator of the surface browning because its increase is associated with an increase of surface browning in fruits such as apple or pear (Arias et al. 2008; González-Buesa et al. 2011); in our work, only cvs Ryan Sun and O’Henry showed an increase (Figure 1). Therefore, some surface browning was found for these Table 1.Physicochemical characteristics of fresh-cut peach cultivars stored at 4ºC for 9 days
Day TSS (ºBrix)* TA (% malic acid)* pH* TSS/TA* Firmness (N)**
Spring Lady
0 10.25 ± 0.06a 0.889 ± 0.001a 3.56 ± 0.01c 11.52 ± 0.70d 19.91
3 9.38 ± 0.05b 0.635 ± 0.005c 3.64 ± 0.01b 14.75 ± 0.91a
6 8.63 ± 0.10c 0.654 ± 0.005b 3.66 ± 0.01b 13.19 ± 0.19c
9 7.90 ± 0.08d 0.573 ± 0.001d 3.75 ± 0.01a 13.80 ± 0.14b
Royal Glory
0 10.33 ± 0.10b 0.375 ± 0.005a 4.12 ± 0.01b 27.54 ± 0.34d 34.64
3 11.43 ± 0.05a 0.313 ± 0.010b 4.30 ± 0.01a 36.69 ± 0.80a
6 9.63 ± 0.05c 0.313 ± 0.005b 4.25 ± 0.01a 30.73 ± 0.06c
9 10.28 ± 0.17b 0.300 ± 0.001b 4.32 ± 0.09a 34.25 ± 0.39b
Ruby Rich
0 11.00 ± 0.08a 1.010 ± 0.001a 3.40 ± 0.01d 10.91 ± 0.09b 23.58
3 10.18 ± 0.29b 0.870 ± 0.001c 3.50 ± 0.01b 11.72 ± 0.33a
6 8.98 ± 0.05c 0.910 ± 0.001b 3.42 ± 0.01c 9.88 ± 0.05c
9 9.10 ± 0.01c 0.760 ± 0.001d 3.58 ± 0.01a 11.99 ± 0.02a
Summer Rich
0 7.93 ± 0.13d 0.768 ± 0.010c 3.80 ± 0.01b 10.35 ± 0.27d 33.08
3 9.55 ± 0.06c 0.799 ± 0.001b 3.75 ± 0.01c 11.95 ± 0.08c
6 10.30 ± 0.01a 0.821 ± 0.001a 3.75 ± 0.01c 12.54 ± 0.02b
9 10.10 ± 0.01b 0.605 ± 0.005d 3.87 ± 0.01a 16.70 ± 0.03a
Ryan Sun
0 14.08 ± 0.32a 0.763 ± 0.005a 3.70 ± 0.01d 18.33 ± 0.36c 44.01
3 12.68 ± 0.15b 0.623 ± 0.005b 3.79 ± 0.05c 20.34 ± 0.25b
6 11.60 ± 0.08c 0.545 ± 0.017c 3.91 ± 0.01b 21.30 ± 0.68b
9 11.90 ± 0.01c 0.510 ± 0.001d 3.99 ± 0.01a 23.24 ± 0.04a
O’Henry
0 10.75 ± 0.06c 0.594 ± 0.009a 3.76 ± 001d 18.08 ± 0.26c 41.14
3 11.65 ± 0.10a 0.539 ± 0.002b 3.80 ± 0.01c 21.54 ± 0.16b
6 10.88 ± 0.10bc 0.479 ± 0.003c 3.86 ± 0.01b 22.62 ± 0.15b
9 10.98 ±0.05b 0.459 ± 0.020c 3.96 ± 0.01a 23.82 ± 1.01a
cultivars. The b* value decreased for all cultivars, i.e. they suffered some discoloration process possibly due to phenolic degradation taking part on tissues.
Browning potential. Cultivars showed very differ-ent BP values (Figure 2). Cvs Ryan Sun and O’Henry had the highest values, and this was consistent with colour results. This high BP may be due to their high TPC and PPO activities, since both of them are said to be the main factors responsible for enzymatic brown-ing. A certain correlation between these parameters was observed by some authors on peach (Lee et al. 1990), apple (Murata et al. 1995) and pear (Arias
et al. 2008). However, other authors have not found this relation (González-Buesa et al. 2011). For all cultivars, except cv. O’Henry, BP suffered rises and falls throughout storage (Figure 2). However, it has been shown that the rate of browning of fruit products depends on the nature, concentration and interaction of the phenolic compounds that are co-present in tissues (Lee et al. 1990). This would be the reason why there may be differences in behaviour between cultivars.
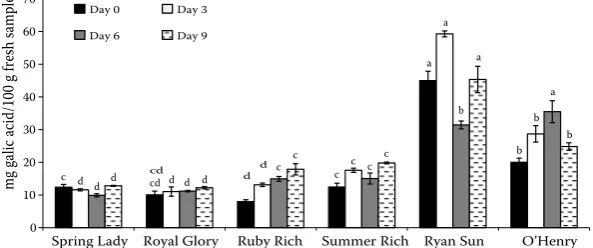
[image:5.595.64.355.85.205.2]Total phenolic content. There were significant differences between cultivars in TPC. Ryan Sun and O’Henry, both late cultivars, showed the TPC much higher than the rest, especially cv. Ryan Sun (Fig-ure 3). Cvs Royal Glory, Ruby Rich, and Summer Rich showed increases of phenolic content during storage (Figure 3). These increases might be the response of plant tissues to stress suffered during processing (Haminiuk et al. 2012), because mechanical damage
provokes de novo synthesis of the enzyme phenyla-lanine ammonia-lyase (PAL; EC 4.3.1.5), which is the key enzyme in phenolic biosynthesis (Tomás-Barberán & Espín 2001). However, for the rest of the cultivars, no trend was observed, especially for cvs Ryan Sun and O’Henry, whose TPC evolution was irregular, with a considerable decrease between day 3 and 6 for cv. Ryan Sun and between day 6 and 9 for cv. O’Henry. This fact could be explained by different rate of phenolic synthesis (due to stress) and degradation (due to PPO activity and surface healing). Thus, depending on the cultivar and tissue, different evolution during storage could be expected, with alternative dominance of phenolic synthesis and degradation (Fernando Reyes et al. 2007). Many authors have studied and analysed the relationship between phenolic compounds, PPO and enzymatic browning in fruits such as apple (Murata et al. 1995), pear (Arias et al. 2008), and peach (Lee et al. 1990; Cheng & Crisosto 1995; González-Buesa et al. 2011), however, this issue remains unclear today. In our case, it can be seen that BP and TPC data are consistent for all cultivars, i.e. higher phenolic content entails higher BP, except for cv. Summer Rich, which had a high BP in spite of having a low phenolic content.
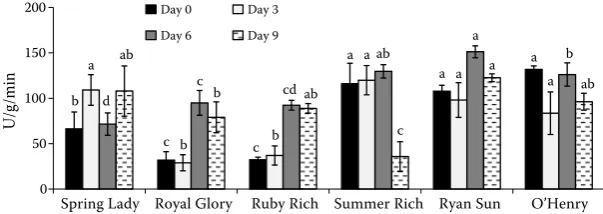
[image:5.595.64.361.633.757.2]PPO activity. The results were quite similar to those found for whole peaches (Lee et al. 1990). Cvs Summer Rich, Ryan Sun and O’Henry were the cultivars that showed the highest enzymatic activity (Figure 4). These results are consistent with those Figure 2. Browning potential (abs 440 nm) in the minimally processed peach cultivars stored for 9 days at 4°C Data shown mean and standard deviation (n = 4); vertical bars for a same day followed by different letters indicate that the mean values are statistically different by Tukey’s test (P < 0.05)
d c b a b 0 0.5 1.0 1.5 2.0 2.5
Absorbance 440 nm
Day 0 Day 3
Day 6 Day 9
Spring Lad Royal Glory Ruby Rich Summer Rich Ryan Sun O’Henry
d d b b b a a a a a c c c c c c c cd bc
Figure 3. Total phenolic content (mg galic acid/100 g) in the minimally processed peach cultivars stored for 9 days at 4°C Data shown mean and standard deviation (n = 4); vertical bars for a same day follo-wed by different letters indicate that the mean values are statistically different by Tukey’s test (P < 0.05)
cd d b d b b a d c a b 0 10 20 30 40 50 60 70
Spring Lady Royal Glory Ruby Rich Summer Rich Ryan Sun O’Henry
a a c c c c c
cd d d
d d d c
Day 0 Day 3
Day 6 Day 9
obtained in BP and TPC, except for cv. Summer Rich, which had moderately high BP and low TPC. The case of cv. Spring Lady is also noteworthy, since it had a relatively higher PPO activity in spite of having low BP and TPC. On the other hand, the evolution of enzymatic activity was very variable (Figure 4), probably due to inaccurate measurements that might have contributed to a large analytical error. Other studies have shown similar trends during storage of minimally processed peach (González-Buesa et al.
2011). This behaviour could be due to the decompart-mentalisation of latent forms of PPO, which occurs for the cell lysis favouring the contact of enzyme and substrate. Moreover, it has been seen that the degree of latency can vary widely among species and tissues (Tomás-Barberán & Espín 2001).
Correlation coefficients between parameters. Relationships between all studied variables were assessed by using the Pearson test. Generally, it may be said that BP was correlated with all parameters to a greater or lesser extent (P < 0.01) except with those that were related to acidity (Table 3). In some cases, such as the relationship between BP and TPC, this correlation was stronger (0.762**), whereas its relationship with L* or PPO was weaker (0.442**
and 0.476**, respectively). The same pattern ap-pears in TPC. The relationship between TPC and TSS (0.717**) was noteworthy, where cultivars (Ryan Sun and O’Henry) with the highest content of TSS during the whole storage would have the highest phenolic content. Surprisingly, there was not a close relationship between TPC and PPO. In fact, it was one of the weakest relations, which makes us think that the oxidation of phenols, causative browning, would be caused by other factors besides by PPO.
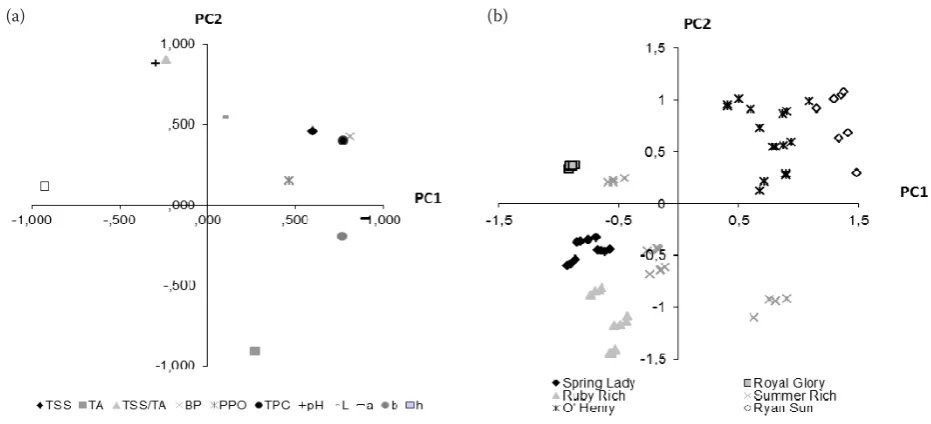
[image:6.595.67.532.102.258.2]Principal component analysis (PCA). A principal component analysis (PCA) was used to explore re-lationships between the studied parameters, as well as the sample location in principal components 1 and 2 of space (PC1 and PC2, respectively), which accounted for 69.62% of the original data variability (Figure 5). On the one hand, PC1 explained 39.29% of data and was strongly influenced by BP and colour parameters a* and hº, and in a weaker way by TSS, TPC and b* (Figure 5a). On the other hand, PC2 explained 30.34% of variability. This was strongly influenced by TA, TSS/TA and pH. At an interme-diate point in the space were L* and PPO and this could be due to the fact that both parameters were explained by a third component, suggesting a weak Table 2.Lightness and hue angle values for fresh-cut peach cultivars stored for 9 days at 4°C
Day Spring Lady Royal Glory Ruby Rich Summer Rich Ryan Sun O’Henry
L*
0 69.60d 70.98d 71.15d 74.05d 76.32b 77.03d
3 76.01c 75.24c 75.43a 75.22a 76.37a 77.64c
6 77.01a 75.37b 75.23b 76.26b 75.44d 78.54b
9 76.99b 77.37a 74.37c 77.51c 75.83c 79.02a
hº
0 96.21d 98.95d 94.95d 94.17d 96.16a 96.87a
3 99.31b 100.71c 98.92c 98.42c 94.99b 95.85b
6 99.49a 101.38b 99.42b 98.92b 93.69d 95.85d
9 98.79c 101.94a 100.03a 99.24a 94.51c 96.30c
L* – lightness. h° – hue angle; in each column values for a same cultivar followed by different letters show significant differ-ences by Tukey’s test (P < 0.05) (n = 20)
Figure 4. PPO activity (U/g/min) in the minimally processed peach cultivars stored for 9 days at 4°C
Data shown mean and standard deviation (n = 4); vertical bars for a same day follo-wed by different letters indicate that the mean values are statistically different by Tukey’s test (P < 0.05)
b
c c
a
a a
a
b b
a
a a
d
c cd
ab a b
ab
b ab
c
a
ab
0 50 100 150 200
Spring Lady Royal Glory Ruby Rich Summer Rich Ryan Sun O’Henry
U/g/min
Day 0 Day 3
[image:6.595.64.366.651.758.2]influence on the rest of the parameters. These re-sults confirm again the close relationship between BP, colour parameters and TPC.
When samples were plotted on the plane defined by PC1 and PC2 (Figure 5b), cvs Ryan Sun and O’Henry were located on the positive side of PC1 axis. These were the cultivars with the highest values of BP, TPC (Table 3) and TSS content (Table 1) and with an in-crease in a* value during storage (Figure 1). In contrast, cultivar Royal Glory was just located in the opposite area of the same axis (negative side). Cvs Spring Lady and Summer Rich were located in the negative side of the PC1 and PC2 axes, because both cultivars showed a decrease of a* from day 0 to day 3 of storage, although
cv. Summer Rich was located in the positive side of PC1 axis and in the positive side of PC2 axis too, indicating that this behaviour was due to the interaction of sev-eral factors including BP, TPC, and TA. Finally, Ruby Rich was located in the most negative side PC2 axis, indicating that this cultivar was strongly influenced by TA and inversely by TSS/TA and pH.
[image:7.595.61.527.81.293.2]The disposition of cultivars on the plane makes us think that the cultivars that had a positive PC1 value related to the parameters involved in brown-ing are not recommendable for minimal processbrown-ing. According to these results, TA, BP, TSS, TPC and colour parameters hº and a* are useful for fresh-cut peach characterisation.
Table 3. Pearson correlation coefficients between physicochemical and functional parameters
TSS TA TSS/TA pH L* a* b* h° BP TPC PPO
TSS – ns 0.389** ns ns 0.380** 0.488** –0.419** 0.610** 0.717** ns
TA – –0.909** –0.918** –0.395** 0.246* 0.335** –0.283** ns ns ns
TSS/TA – 0.919** 0.230** –0.245* –0.219* 0.265** ns ns ns
pH – 0.239** –0.245* –0.336** 0.287** ns ns ns
L* – ns –0.224* NS 0.442** 0.352** 0.375**
a* – 0.652** –0.988** 0.640** 0.584** 0.393**
b* – –0.756 0.516** 0.380** ns
hº – –0.653** –0.580** –0.356
BP – 0.762** 0.476**
TPC – 0.404**
[image:7.595.62.537.555.715.2]TSS – total soluble solids (ºBrix); TA – titratable acidity (% malic acid); TSS/TA – acceptability index; L* – lightness; a* – coordinate chromaticity; b* – coordinate chromaticity; hº – hue angle; BP – browning potential (absorbance 440 nm); TPC – total phenolic content (mg galic acid/100 g fruit); PPO – polyphenol oxidase activity (U/g/min); *P < 0.05;**P < 0.01; ns – not significant Figure 5. Principal component analysis of minimally processed peach cultivars (69.62% of data; PC1: 39.29%, PC2: 30.34%), for (a) the paramaters and (b) peach cultivars in study.
CONCLUSION
It can be concluded that cvs Ryan Sun and O’Henry are the cultivars that offer the least suitable fruit for fresh-cut processing, mainly due to their high BP and PPO activity, related to a* increase and L* decrease, respectively (undesirable attributes for minimal pro-cessing that might imply visual quality loss). Neverthe-less, the high phenolic content of this cultivar does not necessarily rule it out from minimal processing. It may be that additional barrier techniques need to be applied. Further studies should include firmness of fruit slices and sensory analysis, paying attention to firmness and surface dehydration.
Acknowledgements. D. Bohoyo-Gil thanks the Instituto Nacional de Investigación y Tecnología Agra-ria y AlimentaAgra-ria (INIA) for his research contract. S. Nogales-Delgado and M.C. Fuentes-Pérez thank the research Grant (TEC 08084 and TE10016). Finally, we thank ACOPAEX.
References
Ares G., Martínez I., Lareo C., Lema P. (2008): Failure criteria based on consumers’ rejection to determine the sensory shelf life of minimally processed lettuce. Post-harvest Biology and Technology, 49: 255–259.
Arias E., González J., López-Buesa P., Oria R. (2008): Optimization of processing of fresh-cut pear. Journal of the Science of Food and Agriculture,88: 1755–1763. Barbagallo R.N., Chisari M., Patané C. (2012): Poly-phenol oxidase, total Poly-phenolics and ascorbic acid changes during storage of minimally processed “California Won-der” and “Quadrato d’Asti” sweet peppers. LWT-Food Science and Technology, 49: 192–196.
Boun H.R., Huxsoll C.C. (1991): Control of minimally pro-cessed carrot (Daucus carota) surface discoloration caused by abrasion peeling. Journal of Food Science, 56: 416–418. Cheng G.W., Crisosto C.H. (1995): Browning potential, phe-nolic composition, and polyphenoloxidase activity of buffer extracts of peach and nectarine skin tissue. Journal of the American Society for Horticultural Science, 120: 835–838. Crisosto C.H., Crisosto G.M. (2005): Relationship
between ripe soluble solids concentration (RSSC) and consumer acceptance of high and low acid melting flesh peach and nectarine (Prunus persica (L.) Batsch) culti-vars. Postharvest Biology and Technology, 38: 239–246. Fernando Reyes L., Emilio Villarreal E.,
Cisneros-Zevallos L. (2007): The increase in antioxidant capacity after wounding depends on the type of fruit or vegetable tissue. Food Chemistry, 101: 1254–1262.
Ghidelli C., Mateos M., Rojas-Argudo C., Pérez-Gago M.B. (2013): Antibrowning effect of antioxidants on extract, precipitate, and fresh-cut tissue of artichokes. LWT-Food Science and Technology, 51: 462–468. González-Buesa J., Arias E., Salvador M.L., Oria R.,
Ferrer-Mairal A. (2011): Suitability for minimal pro-cessing of non-melting clingstone peaches. International Journal of Food Science & Technology, 46: 819–826. Gorny J.R., Hess-Pierce B., Kader A.A. (1998): Effects
of fruit ripeness and storage temperature on the dete-rioration rate of fresh-cut peach and nectarine slices. HortScience, 33: 110–113.
Gorny J.R., Hess-Pierce B., Kader A.A. (1999): Qual-ity changes in fresh-cut peach and nectarine slices as affected by cultivar, storage atmosphere and chemical treatments. Journal of Food Science, 64: 18–21. Haminiuk C.W.I., Maciel G.M., Plata-Oviedo M.S.V.,
Peralta R.M. (2012): Phenolic compounds in fruits – an overview. International Journal of Food Science & Technology, 47: 2023–2044.
Hodges D.M., Toivonen P.M.A. (2008): Quality of fresh-cut fruits and vegetables as affected by exposure to abiotic stress. Postharvest Biology and Technology, 48, 155–162. Hutchings J.B. (1994): Food Colour and Appearance.
Blackie, London.
Lee C.Y., Kagan V., Jaworski A.W., Brown S.K. (1990): Enzymatic browning in relation to phenolic compounds and polyphenoloxidase activity among various peach cultivars. Journal of Agricultural and Food Chemistry, 38: 99–101.
Lima V.L.A.G., Mélo E.A., Maciel M.I.S., Prazeres F.G., Musser R.S., Lima D.E.S. (2005): Total phenolic and carotenoid contents in acerola genotypes harvested at three ripening stages. Food Chemistry, 90: 565–568. Murata M., Tsurutani M., Tomita M., Homma S.,
Kaneko K. (1995): Relationship between apple ripen-ing and brownripen-ing: changes in polyphenol content and polyphenol oxidase. Journal of Agricultural and Food Chemistry, 43: 1115–1121.
Pace B., Cefola M., Renna F., Attolico G. (2011): Re-lationship between visual appearance and browning as evaluated by image analysis and chemical traits in fresh-cut nectarines. Postharvest Biology and Technology, 61: 178–183.
Remorini D., Tavarini S., Degl’Innocenti E., Loreti F., Massai R., Guidi L. (2008): Effect of rootstocks and harvesting time on the nutritional quality of peel and flesh of peach fruits. Food Chemistry, 110: 361–367. Rico D., Martín-Diana A.B., Barat J.M., Barry-Ryan C.
Robles-Sánchez M., Gorinstein S., Martín-Belloso O., Astiazarán-García H., González-Aguilar G., Cruz-Valenzuela R. (2007): Frutos tropicales mínima-mente procesados: potencial antioxidante y su impacto en la salud. Interciencia, 32: 227–232.
Soliva-Fortuny R.C., Grigelmo-Miguel N., Odrio-zola-Serrano I., Gorinstein S., Martín-Belloso O. (2001): Browning evaluation of ready-to-eat apples as affected by modified atmosphere packaging. Journal of Agricultural and Food Chemistry, 49: 3685–3690. Toivonen P.M.A., Brummell D.A. (2008): Biochemical
bases of appearance and texture changes in fresh-cut fruit and vegetables. Postharvest Biology and Technol-ogy, 48: 1–14.
Tomás-Barberán F.A., Espín J.C. (2001): Phenolic com-pounds and related enzymes as determinants of quality in fruits and vegetables. Journal of the Science of Food and Agriculture, 81: 853–876.
Voss D.H. (1992): Relating colorimeter measurement of plant color to the Royal Horticultural Society colour chart. HortScience, 27: 1256–1260.
Wolfe K.L., Kang X., He X., Dong M., Zhang Q., Liu R.H. (2008): Cellular antioxidant activity of common fruits. Journal of Agricultural and Food Chemistry, 5-6: 8418–8426.
Received for publication July 8, 2013 Accepted after corrections January 17, 2014
Corresponding author: