Populations with cereal-based diets and/or those that inhabit regions with soil mineral imbalance, can often lack Fe, Zn, Ca, Mg, Cu, I or Se (White and Broadley 2009). Indeed, it was estimated that 60% to 80% of the world population is Fe deficient, > 30% is Zn deficient, about 30% is I deficient, and about 15% is Se deficient (Combs 2001, Kennedy et al. 2003).
Selenium is an essential micronutrient for hu-mans and it is predominantly provided by con-sumption of cereals, meat and fish (Combs 2001). However, Se malnutrition in humans prevails due to low Se concentrations and availability in soils, with the consequent low Se concentrations in crop
plants (White and Broadley 2009). Since direct Se supplementation suffers from low bioavailability of inorganic Se and possible accidental excess Se intake by humans, agronomic biofortification is considered more advantageous (Hartikainen 2005). To date, foliar and soil application of Se fertilis-ers was demonstrated to be feasible approaches to increase Se concentrations in the edible parts of crop plants (Combs 2001, Hartikainen 2005, Lyons et al. 2005).
Zinc is widely involved in human metabolism, and thus Zn deficiency has many deleterious ef-fects on human health and development (Alloway 2008). Considerable efforts are being put into
Impact of double Zn and Se biofortification of wheat plants
on the element concentrations in the grain
M. Germ
1, P. Pongrac
1, M. Regvar
1, K. Vogel-Mikuš
1, V. Stibilj
2, R. Jaćimović
2, I. Kreft
11
Biotechnical Faculty, University of Ljubljana, Ljubljana, Slovenia
2Jožef Stefan Institute, Ljubljana, Slovenia
ABSTRACT
Optimisation of the concentrations of essential mineral elements in staple grain diet and reduction in non-essential and potentially toxic elements would considerably alleviate mineral malnutrition and improve the health of hu-mans. Here, wheat (Triticum aestivum L.) plants were biofortified with Zn and/or Se to determine the changes across 36 elements in the grain. The element concentrations were determined by multielemental k0-instrumental neutron activation analysis (k0-INAA). In comparison to grain from non-biofortified plants, Zn fertilisation in-creased the grain Zn, Ca, and Mo concentrations, whereas the foliar application of Se only inin-creased the grain Se concentrations. Double biofortification (combined Zn fertilisation and foliar Se) was more effective for the in-creased Se concentrations in the grain, in comparison to the Se-only biofortified plants, with the grain Zn, Ca and Mo concentrations remained at the same levels as those for the Zn-only biofortified plants. Except for Ba, Br and Rb, the concentrations of the elements analysed were below the detection limits. Double biofortification might be a feasible strategy to efficiently coordinate the mineral quality of wheat grain, although the considerable concentra-tions of other essential and non-essential elements should not be neglected.
Keywords: Triticum aestivum; malnutrition; k0-instrumental neutron activation analysis
biofortification of Zn in staple foods, with vari-ous success rates reported. For example, foliar or combined soil/foliar application of Zn fertilisers under field conditions was shown to effectively increase Zn concentrations in whole wheat grain (e.g., by 3-fold; Cakmak 2008). Recently, N ferti-lisation was shown to positively affect Zn and Fe concentrations in wheat grain (Kutman et al. 2011), which confirms that the plant mineral status as a whole can respond readily to (even single) mineral changes in the soil solution.
There were only a few studies conducted to investigate the impact on grain concentrations of more than one mineral used in a biofortifica-tion strategy. Therefore, while monitoring a total of 36 elements accessed simultaneously with the k0-instrumental neutron activation analysis (k0 -INAA), we used a combination of Zn fertilisation and foliar application of Se with wheat plants, as a comparison with these individual biofortifications to determine the magnitude of the increases in Zn and Se concentrations in the grain and to assess the impact of these biofortification strategies on the concentrations of the essential elements in the grain.
MATERIAL AND METHODS
The wheat (Triticum aestivum cv. Reska) was grown in Mitscerlich pots, which are 21.5 cm high and 20 cm wide and can contain 7 kg soil, at the experimental field of Biotechnical Faculty, University of Ljubljana, Ljubljana, Slovenia (320 m a.s.l.; 46°35'N, 14°55'E). At the time of the experi-ments, the mean temperature was 14.8°C and the mean humidity was 11.7% (http://meteo.arso.gov. si/met/sl/climate/tables/yearbook/2010/station-data/). The wheat plants were grown in soil with the following characteristics: total Zn, 96 mg/kg; total Se, < 0.5 mg/kg; total N, 0.21%; carbonate, 1.6%; P, 4.66 mg/100 g; K, 15.9 mg/100 g; 13.3% sand; 57.0% silt; 29.7% clay; organic matter, 2.7%; pH 7. For the Zn fertilisation, Zn (as the nitrate) was added to the soil at 1 g/kg. In the Se trials, the plants were sprayed just before flowering with a solution of detergent (0.2 mL/L Triton T-100; Sigma) and Se (20 mg/L), as an aqueous solution containing sodium selenate (0.15 mL was used per plant for the spraying: i.e. approximately 3 mg Se per plant, and 15 mg per pot). To the control treatment the corresponding amount of ammonium
nitrate was added to keep the same level of N as in Zn treated pots. Number of pots within one treatment was 2, in each of the pots there were five plants. The experiments lasted 95 days, and the ripe grain was collected from the plants, air dried, and weighted (dry weight).
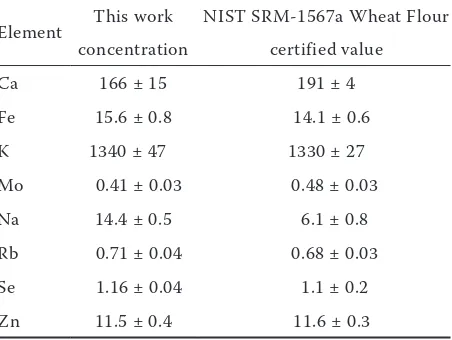
[image:2.595.306.532.545.715.2]The element concentrations in the grains were determined using multielemental k0-INAA, which enables analysis of 36 elements: Ag, As, Au, Ba, Br, Ca, Cd, Ce, Co, Cr, Cs, Cu, Eu, Fe, Ga, Hf, Hg, K, La, Mo, Na, Nd, Rb, Sb, Sc, Se, Sm, Sr, Ta, Tb, Th, U, W, Yb, Zn and Zr. About 70–170 grains of each sample (1.3 g to 5.0 g) were homogenised using an agate mortar. For k0-INAA, 240–270 mg aliquots of grains were pressed into pellets (diameter, 10 mm; height, 2 mm) using a manual hydraulic press (SPECAC, UK), and stored in polyethylene bags. Each sample was stacked together with the standard (Al-0.1%Au IRMM-530R discs), which were then fixed in a polyethylene ampoule in a sandwich form, and irradiated for 12 h in the carousel facility of the Jožef Stefan Institute TRIGA Mark II reactor with a thermal neutron flux of 1.1 × 10¹²/cm2/s. The values of f = 28.6 and α = –0.001 were used to calculate the element concentrations using the software package Kayzero for Windows (User’s Manual Kayzero for Windows 2005). For QA/QC purposes, the NIST SRM-1567a Wheat Flour was used (Table 1). The method used is described in detail elsewhere (Jaćimović et al. 2003).
Table 1. Results obtained by k0-instrumental neutron activation analysis (k0-INAA) in comparison to the certified values (mg/kg) of the reference material
Element This work NIST SRM-1567a Wheat Flour
concentration certified value
Ca 166 ± 15 191 ± 4
Fe 15.6 ± 0.8 14.1 ± 0.6
K 1340 ± 47 1330 ± 27
Mo 0.41 ± 0.03 0.48 ± 0.03
Na 14.4 ± 0.5 6.1 ± 0.8
Rb 0.71 ± 0.04 0.68 ± 0.03
Se 1.16 ± 0.04 1.1 ± 0.2
Zn 11.5 ± 0.4 11.6 ± 0.3
Differences in element concentrations were ex-amined using Tukey’s honestly significant differ-ence (HSD) test, using Statistica Statsoft (version 8.0), and significant differences were considered for P < 0.05.
RESULTS AND DISCUSSION
In wheat grains from our experiments, concen-trations of Zn, Na, K, Ca, Fe, Mo, Br, Rb and Ba were above the limits of detection in all treat-ments, while Se concentrations were above the limits of detection (being < 0.11 mg/kg) only in the Se trials. Other elements accessible with the k0-INAA were below the detection limits and those elements toxic to humans in high concentrations (limits of detections given in the brackets in mg/kg) were: As (< 0.05), Cd (< 0.82), Co (< 0.006), Cr (< 0.2), Cu (< 32) and Hg (< 0.31).
The Zn concentrations in the grain of the con-trol (non-biofortified) wheat plants exceeded the previously reported maximum concentrations for bread-wheat cultivars, and the Fe concentrations were just below the previously reported maximal concentrations (Table 2). This indicated that the Reska cultivar of wheat used in our study is efficient in its Zn and Fe uptake. The Na concentrations in the grain of the control plants were at the lower limit of the previously reported Na concentra-tion ranges for different wheat grains, while Ba
concentrations were at the upper limits (Table 2). The measured K, Ca and Mo concentrations in the grain of the control plants were within the ranges of the previously reported concentrations, while those of Br and Rb were a lot lower than previously reported concentrations (Table 2).
Application of Zn or Se, individually, to wheat plants did not significantly affect the grain dry weight but did significantly increase the concen-trations of both of these mineral elements (i.e., Zn and Se) in the grain (Figure 1). Increasing the Zn and Se concentrations of food crop plants would result in improved human health, which is particularly important as Zn and Se deficiencies remain a worldwide problem (Carey et al. 2012). Increased Zn concentrations in grain were also demonstrated to have the beneficial side effect of a reduction in grain phytate content, which hence lowers the phytate: Zn ratio, making Zn more bio-available during digestion (Cakmak 2008). Foliar application of Se was shown to be an effective way of improving Se concentrations in e.g. chicory (Cichorium intybus) (Germ et al. 2007). However, the larger scale of field application of Se remains one of the most feasible approaches to significantly increase Se concentrations in foods and to improve the human dietary Se intake (Hartikainen 2005, Broadley et al. 2010).
[image:3.595.63.535.536.742.2]In comparison to control plants, the grain of the Zn-fertilised plants contained higher Zn, Ca, and Mo concentrations, whereas the Na, K, and
Table 2. Essentiality of elements and their concentrations in wheat grain from the control plants of the present study, compared with those from examples of the literature
Element Essentiality Minimal-maximal concentrations (mg/kg) Reference
plants humans present study literature data
Zn yes yes 52.1–54.7 13.5–34.5 Zhao et al. (2009)
Se beneficial yes < 0.055a 0.033–2.38 Zhao et al. (2009)
Na beneficial yes 11.6–12.2 9–57 Lyons et al. (2005)
K yes yes 6 275–6 793 5 000–8 400 Alam (2001)
Ca yes yes 318–383 250–730 White and Broadley (2009)
Fe yes yes 46.1–48.7 28.8–50.8 Zhao et al. (2009)
Mo yes yes 0.9–1.01 0.08–1.31 Kabata-Pendias (2001)
Br no no 0.38–0.42 19.5–50.4 Lorenz et al. (1974)
Rb no no 0.67–0.69 1.2–1.7 Suchowilska et al. (2012)
Ba no no 3.93–5.64 0.35–5.64 Tagami and Uchida (2009)
abelow the limit of detection of the k
Fe concentrations were not significantly different (Figure 1). These changes cannot be explained by the basic mobile and immobile nature of these ele-ments. For example, the Fe and Ca concentrations showed different responses to this Zn treatment, while both are known for their poor mobility within the plant. As indicated above, foliar application of Se increased the Se concentrations, although it had no effects on the concentrations of the other elements studied here (Figure 1). In comparison to
the grain of control plants, increased Zn, Se, Ca and Mo concentrations and no significant changes in Na, K and Fe concentrations were also seen in the grain from the Zn and Se double-fortified plants. In comparison to the Se-only biofortified plants, the increase in Se concentrations in the grain of the double fortified plants was 6-fold greater. Up to 10-fold increases in grain Se concentrations (to 2.6 mg/kg) were seen in high-yielding wheat fertilised with Se in both liquid and granular forms
0 10 20 30 40 G rai n mas s ( mg ) 0 40 80 120 160 200 Zn (m g/ kg) a b a b 0.0 0.5 1.0 1.5 2.0 2.5 Se (m g/ kg) a b 0 4 8 12 16 20 N a ( m g/ kg) a
a a
a 0 2000 4000 6000 8000 10000 K (m g/ kg
) a a
a a
0 200 400 600 800 C a ( m g/ kg)
b b
a a
0 10 20 30 40 50 60
C +Zn +Se +Zn+Se
Fe
(m
g/
kg
) a
a a a
0.0 0.5 1.0 1.5 2.0 2.5 3.0
C +Zn +Se +Zn+Se
M o ( m g/ kg) b a a b
(Broadley et al. 2010). In our study, such large significant increases were seen only when the wheat plants were also fertilised with Zn, which indicates that there is a considerable interaction between Se and Zn and/or any other changes that might have resulted from the Zn fertilisation. Interactions of Zn and Se are not well studied in plants. It is however known that selenate is a chemical analogue of sulphate; they compete for the same transporters during uptake (Broadley et al. 2012). Sulphur deficient plants up-regulate the expression of sulphur transporter genes, leading to a strong increase in the capacity of selenate uptake. Similarly, exposure of plants to higher concentrations of trace elements such as Cd, Cu, Se and Zn leads to increased expression of sul-phate transporters and consequentially enhance sulphur accumulation and assimilation in plants (Na and Salt 2011). Since Se is assimilated in plants via S assimilation pathway, over-expression of sulphate transporters in Zn treated plants might be the reason for more efficient Se assimilation. In addition it was recently demonstrated that the N nutritional status of plants has a critical role in Zn and Fe biofortification of wheat grain, with increased N inducing protein synthesis in grain, and thus creating additional Zn and Fe sinks (Kutman et al. 2011). Thus, potential interactions of elements should never be neglected when the aim is to alter the mineral composition of grain. Indeed, Zn is known to interact with Cu, Fe, Mn and B (Alloway 2008), although there are mixed reports on the influence of Zn on increases in other mineral elements (Loneragan and Webb 1993, Kaya and Higgs 2002). Further studies are needed to explain the substantial increases in Se concentrations in the grain, which in the present study cannot be explained by reduced grain mass, and thus to a concentration effect.
In conclusion, we have shown that double biofor-tification of wheat plants more effectively increases the Se concentrations in the grain, in comparison to single biofortification with Se, probably due to alteration of sulphate metabolism in the presence of Zn. These data indicated double biofortification as a feasible strategy to efficiently coordinate the mineral quality of wheat grain. The biofortification strategy chosen in the present study also enhances the Ca, and Mo concentrations in the grain, while not affecting the Na, Fe and K concentrations. Thus in biofortification practices concentrations of not only biofortified but also other elements
should be monitored, due to imbalances caused by introduction of particular elements to the plants and above all in agricultural ecosystems.
Acknowledgements
The authors acknowledge Prof. A. Tajnšek for providing the grain of the wheat cv. Reska used in this study. Dr. Chris Berrie is acknowledged for English revision of the manuscript.
REFERENCES
Alam S.M. (2001): Genetic variations in nutrient contents by wheat and its substitution lines. Pakistan Journal of Biological Sciences, 4: 642–644.
Alloway B.J. (2008): Zinc in Soils and Crop Nutrition. 2nd Edition.
IZA and IFA, Brussels, Paris.
Broadley M.R., Alcock J., Alford J., Cartwright P., Foot I., Fair-weather-Tait S.J., Hart D.J., Hurst R., Knott P., McGrath S.P., Meacham M.C., Norman K., Mowat H., Scott P., Stroud J.L., Tovey M., Tucker M., White P.J., Young S.D., Zhao F.J. (2010): Selenium biofortification of high-yielding winter wheat ( Triti-cum aestivum L.) by liquid or granular Se fertilisation. Plant and Soil, 332: 5–18.
Broadley M., Brown P., Cakmak I., Rengel Z., Zhao F. (2012): Function of nutrients: micronutrients. In: Marchner P. (ed.): Marschner’s Mineral Nutrition of Higher Plants. 3rd Edition.
Academic Press, London, 191–248.
Cakmak I. (2008): Enrichment of cereal grains with zinc: Agro-nomic or genetic biofortification? Plant and Soil, 302: 1–17. Carey A.M., Lombi E., Donner E., de Jonge M.D., Punshon T.,
Jackson B.P., Guerinot M.L., Price A.H., Meharg A.A. (2012): A review of recent developments in the speciation and location of arsenic and selenium in rice grain. Analytical and Bioanalytical Chemistry, 402: 3275–3286.
Combs G.F. Jr. (2001): Selenium in global food systems. British Journal of Nutrition, 85: 517–547.
Germ M., Stibilj V., Osvald J., Kreft I. (2007): Effect of selenium foliar application on chicory (Cichorium intybus L.). Journal of Agricultural and Food Chemistry,55: 795–798.
Hartikainen H. (2005): Biogeochemistry of selenium and its im-pact on food chain quality and human health. Journal of Trace Elements in Medicine and Biology, 18: 309–318.
Jaćimović R., Smodiš B., Bučar T., Stegnar P. (2003): k0-NAA quality assessment by analysis of different certified reference materials using the KAYZERO/SOLCOI software. Journal of Radioanalytical and Nuclear Chemistry, 257: 659–663. Kabata-Pendias A. (2001): Trace Elements in Soils and Plants.
Kaya C., Higgs D. (2002): Response of tomato (Lycopersicon es-culentum L.) cultivars to foliar application of zinc when grown in sand culture at low zinc. Scientia Horticulturae, 93:53–64. Kennedy G., Nantel G., ShettyP. (2003): The scourge of ‘hidden
hunger’: Global dimensions of micronutrient deficiencies. Food,
Nutrition and Agriculture,32: 8–16.
Kutman U.B., Yildiz B., Cakmak I. (2011): Improved nitrogen status enhances zinc and iron concentrations both in the whole grain and the endosperm fraction of wheat. Journal of Cereal Science, 53: 118–125.
Loneragan J.F., Webb M.J. (1993): Interactions between zinc and other nutrients affecting the growth of plants. In: Robson A.D. (eds.): Zinc in Soils and Plants. Kluwer Academic Publishers, Dordrecht.
Lorenz K., Reuter F.W., Sizer C. (1974): The mineral composition of Triticales and Triticale milling fractions by X-ray fluores-cence and atomic absorption. Cereal Chemistry, 51: 534–542. Lyons G.H., Ortiz-Monasterio I., Stangoulis J.C.R., Graham R.D. (2005): Selenium concentration in wheat grain: Is there suf-ficient genotypic variation to use in breeding. Plant and Soil,
269:369–380.
Na G.N., Salt D.E. (2011): The role of sulfur assimilation and sulfur-containing compounds in trace element homeostasis in plants. Environmental and Experimental Botany, 72: 18–25.
Suchowilska E., Wiwart M., Kandler W., Krska R. (2012): A com-parison of macro- and microelement concentrations in the whole grain of four Triticum species. Plant, Soil and Environ-ment, 58: 141–147.
Tagami K., Uchida S. (2009): Radium-226 transfer factor from soils to crops and its simple estimation method using uranium and barium concentrations. Chemosphere, 77: 105–114.
User’s Manual Kayzero for Windows, Version 2 (2005): For reactor neutron activation analysis (NAA) using the k0 standardization method, Software developed by DSM Research, Geleen (NL), developed at the INW-RUG, Gent (B) and the AEKI, Budapest (H) and now supported and distributed by k0-ware, Heerlen. White P.J., Broadley M.R. (2009): Biofortification of crops with
seven mineral elements often lacking in human diets – iron, zinc, copper, calcium, magnesium, selenium and iodine. New Phytologist, 182: 49–84.
Zhao F.J., Su Y.H., Dunham S.J., Rakszegi M., Bedo Z., McGrath S.P., Shewry P.R. (2009): Variation in mineral micronutrient concentrations in grain of wheat lines of diverse origin. Journal of Cereal Science,49: 290–295.
Received on January 3, 2013 Accepted on May 8, 2013
Corresponding author: