The heterogeneity of soil properties, especially soil nutrients such as mineral nitrogen, is con-sidered to be a problem for the determination of soil sampling strategies and the optimization of soil management (Haberle et al. 2004, Piotrowska and Długosz 2010, Piotrowska 2011). Within one field, differences in status of properties may be induced by different soil types or variations in profile development. Additionally, external fac-tors, e.g. soil fertilization and tillage, significantly influence the soil properties in agricultural soils.
The efficiency of nitrogen use in agricultural fields varies only slightly between 40–50%, which may be attributed to improper nitrogen use man-agement, imbalanced fertilization and losses through leaching, volatilization and
immobiliza-tion (Parama and Munawery 2012). An agricultural system with site-specific management should be more economically and environmentally suitable than a uniform-rate application. Such site-specific nutrient management is based on the prediction of the spatial variability of crop management pa-rameters, soil nutrients and other soil properties (Inamura et al. 2004), which ensures the appropriate application of fertilizers according to the varia-tions in the field that actually exist. As a result it may reduce nutrient losses from production fields, which is of special economic and environmental importance (Cambouris et al. 2008).
There has been a growing interest in the study of the spatial variation of soil properties using geostatistics, as this technique has been used
suc-Spatial variability of soil nitrogen forms and the activity
of N-cycle enzymes
J. Długosz
1, A. Piotrowska-Długosz
21
Department of Soil Science and Soil Protection, UTP University of Science
and Technology, Bydgoszcz, Poland
2
Division of Biochemistry, UTP University of Science and Technology, Bydgoszcz, Poland
ABSTRACT
Knowledge about the spatio-temporal variability of soil chemical and biological properties is crucial in evaluating their structure-function relationship and their impact on ecosystem functions. A study was conducted in order to evaluate the spatial variability of nitrogen (N) forms and N-cycle enzymes of a Phaeozem located in the Northwest-ern Poland. Fifty soil samples were collected every 10 m from the area of 90 × 40 m that was selected from an 80 ha agricultural field after the harvest of winter wheat. The samples were analysed for total nitrogen (Ntot); mineral nitrogen (NO3–-N, NH4+-N) and the activities of the N cycle enzymes – urease (UR), nitrate reductase (NR) and ar-ginine deaminase (ADA). The coefficients of variation were low for Ntot content and UR activity, while a moderate variability was noted for mineral N and ADA activity and a high one was noted for NR activity. Most of the proper-ties revealed a contribution of random variance (nugget effect) in total variability (sill), while only Ntot and ADA activity were determined by the structural variance. The effective ranges were from 11.9 m for NO3–-N to more than 50.3 m for NH4+-N. Kriged maps showed that every property revealed a different distribution on the study area.
The significant variability of the studied properties should be taken into account in soil management practices. Ad-ditionally, this knowledge would contribute to a better understanding of the nitrogen transformation in soil and functioning of the ecosystem.
Keywords: total and mineral N; N-related enzymes; spatial structure; geostatistics
cessfully in characterizing spatial variations of heavy metals (e.g. Lim et al. 2001), micronutrients (e.g. Liu et al. 2004), biological soil features, such as soil enzymatic activity (Stark et al. 2004, Aşkin and Kizilkaya 2006) and other soil properties (Liu et al. 2008, Staugaitis and Šumkis 2011). Geostatistics provides the basis for quantitatively describing any spatial variation in soil, for estimating soil proper-ties and mapping them and finally for planning a rational sampling scheme (Inamura et al. 2004).
The objectives of this study were (1) to determine the spatial dependency of the total and mineral nitrogen and the activities of the enzymes involved in N transformation in the surface horizon of a Phaeozem and (2) to map the spatial distribution of the studied properties.
MATERIAL AND METHODS
Description of the study field and soil
sam-pling. The research was conducted in a
grid-pat-tern 90 m × 40 m plot of an agricultural field of 80 ha situated in the Cuiavia-Pomerania region, north-western Poland. The studied Phaeozem was a sandy loam soil with total organic carbon (Corg) ranging from 15.2–26.5 g/kg. Soil reaction varied from slightly acid to neutral (pHKCl from 6.3–7.0). Prior to the study, the field was cropped with winter rapeseed (Brassica napus L.) followed by winter wheat (Triticum aestivum L.). Fifty soil samples were collected at regular intervals (10 m × 10 m) from the surface horizon (0–20 cm) after the harvest of the winter wheat (August 2007). The soil samples were passed through a 2 mm sieve and divided into three samples. One set of sub-samples was air-dried for the chemical analyses (pH, Corg), another set was stored at 4°C in order to measure soil enzymatic activity and the last sub-sample was analysed for the mineral nitrogen.
Soil analysis. Soil organic C and total N content
were assayed using a Vario Max CN dry combus-tion analyzer (Elementar Analysensysteme GmbH, Langenselbold, Germany). Soil pH (1 mol/L KCl) was measured using the potentiometric method in 1:2.5 soil:solution suspensions. NO3–-N and NH4+-N were extracted from the field-moist soil with K2SO4 and KCl respectively, and nitrate N was determined using phenoldisulphonic acid (Taras 1950), while ammonium N was measured using the indophenol blue method (Stevenson
1982). The activity of soil enzymes (urease, nitrate reductase and arginine deaminase) was assayed as described by Kandeler (1995).
Statistical and geostatistical analysis. Basic
descriptive statistics were determined for each set of data. The data of all properties, with the exception of NR activity, were normally distrib-uted (Shapiro-Wilk test). Non-normal, skewed NR activities were log-transformed and further analyses were performed with the corrected data. A classification scheme was used to identify the extent of variability of the soil properties based on their CV (%) values for which values of 0–15, 16–35 and > 36% indicate a small, moderate and high variability (Wilding 1985). The classical statis-tics were evaluated using Statistica v. 9.0 software (StatSoft Inc., Tulsa, USA).
In order to analyse the spatial structure of the data and to calculate semivariograms, the Isatis geostatistical software was used (Geovariance Co., Avon-Fountainebleau, France). Semivariograms were prepared using the following formula (Isaaks and Srivastava 1989):
γ(h) = 1/2N(h) Σ[z(xi + h) – z(xi)]2
Where: γ(h) – experimental semivariogram value at dis-tance interval h; N(h) – number of sample pairs within the distance interval h; z(xi) and z(xi + h) – sample value at two points separated by the distance interval h.
The mixed spherical/linear or linear models were fitted to the empirical semivariograms. The criterion to select the best fitting models was the mean squared deviation ratio (MSDR) calculated from the squared errors and kriging variances (Webster and Oliver 2001). The spatial variabil-ity of the properties was categorized into classes based on the percentage of total variance present as random variance (Cambardella et al. 1994):
[Co/(Co + C)] × 100.
Maps displaying the spatial variance of the prop-erties determined were drawn on the basis of the semivariograms.
RESULTS AND DISCUSSION
Descriptive statistics of the soil properties.
than the mean, which is an important condition for a normal frequency distribution (Table 1). In the case of NR activity, SD values were much higher than the mean or median, thus confirming a non-normal distribution of the data.
With the exception of the NO3–-N content and UR activity data, all of the properties studied were positively skewed showing a right-sided asymmetry. The distribution of Ntot and NH4+-N concentrations and ADA activity data were moderately skewed. An approximately symmetric distribution was noted for NO3–-N content and UR activity, while highly skewed data (4.69) were noted only for NR activity. Similarly, in the study of Parkin (1987), the enzymatic activity involved in denitrification was highly skewed and was close to a log-normal distribution. Right-tailed skewness resulted from the presence of a few exceptionally large values in the background of the majority of low values. Additionally, a right-tailed skewness resulted in the mean being larger than median. Kurtosis is a measure of whether the data are peaked or flat rela-tive to the normal distribution (Liang et al. 2008).
With the exception of the NR activity data, most of the properties being studied had kurtosis close to zero, thus suggesting a platykurtic distribution, which was flatter than the normal distribution. Only NR activity data exhibited a high leptokurtic distribution (25.9).
According to Wilding (1985) classification the Ntot content and UR activity data showed a low variability, while both mineral forms of N and ADA activity data were in the moderate variability class. In general, CV values for total N were usually in low to moderate variability classes ranging 14.2–30.0%, while mineral N forms and the enzymes involved in the N cycle were usually in the moderate to high variability in a broad range of 17.0–63.7% (e.g. Cambardella et al. 1994, Bergstorm et al. 1998, Shahandeh et al. 2005, Aishah et al. 2010). However, our results did not confirm the thesis that chemical properties are less variable than biological ones. In this study, only NR activity had a very high variability (CV = 114%), while two other enzymatic activities were less variable.
Spatial variability of the properties studied. In
order to characterize the spatial variability of proper-Table 1. Statistics of soil properties (n = 50)
Property Min Max Mean Median SD Skewness Kurtosis CV (%)
Ntot 1.52 2.68 1.99 1.95 0.241 0.696 0.409 12.1
NO3––N 11.2 22.7 17.1 17.1 2.77 –0.028 –0.608 16.2
NH4+–N 6.56 18.0 11.1 9.92 2.65 0.588 –0.335 23.9
UR 10.4 21.5 16.1 16.5 2.37 –0.134 –0.329 14.7
NR 0.053 3.44 0.36 0.22 0.520 4.69 25.9 114.0
ADA 3.15 5.91 4.13 4.04 0.654 0.725 –0.185 15.8
Ntot–total nitrogen (g/kg); NO3–-N – nitrate N (mg/kg); NH4+-N – ammonium N (mg/kg); UR – urease (mg NH4+-N/kg/h); NR – nitrate reductase (mg NO2–N/kg/h); ADA – arginine deaminase (mg NH
4+-N/kg/h); SD – standard deviation;
[image:3.595.64.531.113.215.2]CV – coefficient of variation
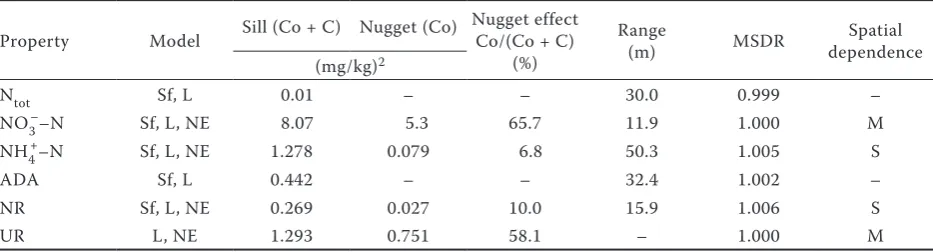
Table 2. Parameters of variogram models
Property Model Sill (Co + C) Nugget (Co) Nugget effect Co/(Co + C) (%)
Range
(m) MSDR dependenceSpatial (mg/kg)2
Ntot Sf, L 0.01 – – 30.0 0.999 –
NO3––N Sf, L, NE 8.07 5.3 65.7 11.9 1.000 M
NH4+–N Sf, L, NE 1.278 0.079 6.8 50.3 1.005 S
ADA Sf, L 0.442 – – 32.4 1.002 –
NR Sf, L, NE 0.269 0.027 10.0 15.9 1.006 S
UR L, NE 1.293 0.751 58.1 – 1.000 M
[image:3.595.64.531.601.727.2]ties studied, linear (UR) or spherical/linear (NO3–-N, NH4+-N, N
tot, ADA, NR) models were fitted to the semivariograms calculated (Table 2). Both mineral-N forms and NR and UR activities showed a random variance (nugget variance – Co) in the total variance (sill). Nugget variance represents the experimen-tal error and field variation within the minimum sampling spacing (Aishah et al. 2010). A variable is considered to have a strong spatial dependency if the ratio is less than 25%, moderate if the nugget/ sill ratio in between 25–75% and weak if the ratio is greater than 75% (Cambardella et al. 1994). The nugget/sill ratios calculated for nitrate-N content and UR activity were 65.7% and 58.1%, respectively, thus indicating a moderate spatial dependency. This finding suggests that extrinsic factors such as fertili-zation, tillage and other soil management practices weakened their spatial correlation after long-term cultivation (Aishah et al. 2010). A lower (31.3%) or similar (57.2%) contribution of the nugget effect to total variability in UR activity was noted by Aşkin and Kizilkaya (2006). NR activity and ammonium-N
content data showed a nugget/sill ratio of 6.8% and 10.0%, thus indicating a strong spatial variability, which can be attributed to intrinsic factors such as soil texture and mineralogy (Cambardella et al. 1994). The spatial range of influence calculated for the properties studied ranged between 11.9–50.3 m (Table 2). Since the range is the maximum distance over which the results are correlated (Bergstorm et al. 1998), those results indicate a rational sampling distance for the properties studied within their effec-tive spatial correlation ranges. Therefore, correctly planning and analysing an adequate number of soil samples is extremely important. If the sampling distance is bigger than the range, the data are no longer spatially correlated and they cannot be ana-lysed geostatistically (Goovaerts 1998). On the other hand, if the sampling scheme is too dense, there is no need to analyse an indispensable amount of samples, which is both time-consuming and increases the cost of the research (Jung et al. 2006).
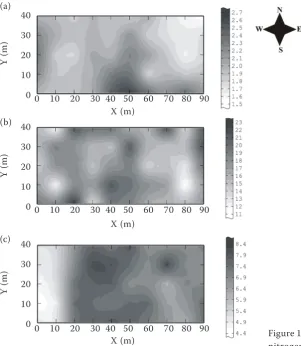
[image:4.595.64.366.404.751.2]The main application of geostatistics to soil sci-ence has been the estimation and mapping of soil
Figure 1. Nitrogen forms concentration: (a) total nitrogen (N); (b) nitrate N; (c) ammonium N (a)
(b)
(c)
Y
(m
)
Y
(m
)
Y
(m
)
0 10 20 30 40 50 60 70 80 90 X (m)
0 10 20 30 40 50 60 70 80 90 X (m)
0 10 20 30 40 50 60 70 80 90 X (m)
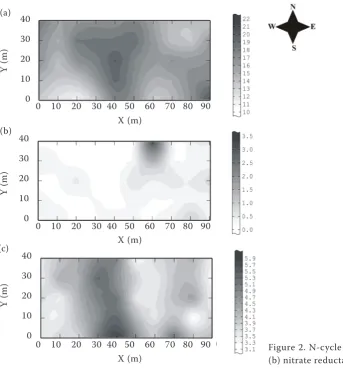
property values in unsampled areas. In each fig-ure, light shading represents the lowest values, while darker shading is associated with the highest values (Figures 1–2). All of the variables studied differed markedly in spatial distribution. Only the area with the highest nitrate-N in the south of the field (at 40–55 m of length and 0–30 m of width) was associated with the highest content of total N (Figure 1a–b). The concentration of NO3–-N revealed an irregular distribution, where nests of higher results were irregularly found among lower data sets (Figure 1b). The highest values of UR activity were noted in the triangle situated in the central and eastern parts of the area (Figure 2a). Almost all of the study area showed NR activity values lower than 0.8 mg NH4+-N/kg/h (Figure 2b). A band of relatively higher ADA activity data ran vertically from the north to the south of the field at a length of 30–45 m (Figure 2c). Generally the distribution of each of the properties did not share any similari-ties with the others, which confirmed the lack of
a relationship among them as was revealed by the correlation analysis (data not presented).
In conclusions, results can help in evaluating the contribution of intrinsic factors in the total variability of soil properties, which can mask the influence of soil management practices, such as crop rotation, fertilization and tillage. For some properties (e.g. NH4+-N, N
[image:5.595.64.408.390.760.2]tot concentrations, ADA activity) the sampling intervals should be increased in future studies and that the number of soil samples can be reduced. This is important since the sampling and analysis of soil is time and labour-consuming. Ammonium-N content showed a higher range values, thus indicating a stronger spatial correlation than NO3–-N and seems to be a better property for maps produced for site-specific N fertilization. However, since mineral N forms are highly temporally variable, more determina-tions of these properties should be done within the season, prior to the formulation of any valid conclusions concerning site-specific management.
Figure 2. N-cycle enzymes activity: (a) urease; (b) nitrate reductase; (c) arginine deaminase 0 10 20 30 40 50 60 70 80 90
0 10 20 30 40 50 60 70 80 90
0 10 20 30 40 50 60 70 80 90 X (m)
X (m)
X (m) 40
30 20 10 0
40 30 20 10 0
40 30 20 10 0
Y
(m
)
Y
(m
)
Y
(m
)
(a)
(b)
Acknowledgement
Much gratitude is due to Michele Simmons for proof reading the article.
REFERENCES
Aishah A.W., Zauyah S., Anuar A.R., Fauziah C.I. (2010): Spatial variability of selected chemical characteristics of paddy soils Sawah Sempadan, Selangor, Malaysia. Malaysian Journal of Soil Science, 14: 27–39.
Aşkin T., Kizilkaya R. (2006): Assessing spatial variability of soil enzyme activities in pasture topsoils using geostatistics. European Journal of Soil Biology, 42: 230–237.
Bergstrom D.W., Monreal C.M., Millette J.A., King D.J. (1998): Spatial dependence of soil enzyme activities along a slope. Soil Science Society of American Journal, 6: 1302–1308.
Cambardella C.A., Moorman T.B., Novak J.M., Parkin T.B., Karlen D.L., Turco R.F., Konopka A.E. (1994): Field-scale variability of soil properties in Central Iowa soils. Soil Science Society of American Journal, 58: 1501–1511.
Cambouris A.N., Zebarth B.J., Nolin M.C., Laverdière M.R. (2008.): Apparent fertilizer nitrogen recovery and residual soil nitrate under continuous potato cropping: Effect of N fertilization rate and timing. Canadian Journal of Soil Science, 88: 813–825. Goovaerts P. (1998): Geostatistical tools for characterizing the
spatial variability of microbiological and physico-chemical soil properties. Biology and Fertility of Soils, 27: 315–334. Haberle J., Kroulík M., Svoboda P., Lipavský J., Krejčová J., Cerhanová
D. (2004): The spatial variability of mineral nitrogen content in topsoil and subsoil. Plant, Soil and Environment, 50: 425–433. Inamura T., Goto K., Iida M., Nonami K., Inoue H., Umeda M.
(2004): Goestatistical analysis of yield, oil properties and crop management practices in paddy rice fields. Plant Production Science, 7: 230–239.
Isaaks E.H., Srivastava R.M. (1989): Applied Geostatistics. New York, Oxford, Oxfrod University Press.
Jung W.K., Kitchen N.R., Sudduth K.A., Anderson S.H. (2006): Spatial characteristics of claypan soil properties in an agricultural field. Soil Science Society of American Journal, 70: 1387–1397. Kandeler E. (1995): Enzymes involved in nitrogen metabolism.
In: Scinner F., Öhlinger R., Kandeler E., Margesin R. (eds.): Methods in Soil Biology. Berlin, Heidelberg, Springer-Verlag, 163–184.
Liang Z.Q., Wei J.M., Zhao J.N., Liu H.T., Li B.Q., Shen J., Zheng C.L. (2008): The statistical meaning of kurtosis and its new
ap-plication to identification of persons based on seismic signals. Sensors, 8: 5106–5119.
Lim Y.-P., Chang T.-K., Teng T.-P. (2001): Characterization of soil lead by comparing sequential Gaussian simulation, simulated annealing simulation and kriging methods. Environmental Geology, 41: 189–199.
Liu X.M., Xu J.M., Zhang M.K., Huang J.H., Shi J.C., Yu X.F. (2004): Application of geostatistics and GIS technique to characterize spatial variabilities of available micronutrients in paddy soils. Environmental Geology, 46: 189–194.
Liu X.M., Zhao K.L., Xu J.M., Zhang M.H., Si B., Wang F. (2008): Spatial variability of soil organic matter an nutrients in paddy fields at various scales in southeast China. Environmental Geology, 53: 1139–1147.
Parama V.R.R., Munawery A. (2012): Sustainable soil nutrient management. Journal of Indian Institute of Science, 91: 1–16. Parkin T.B. (1987): Soil microsites as a source of
denitrifica-tion variability. Soil Science Society of America Journal, 51: 1194–1199.
Piotrowska A. (2011): Spatial variability of total and mineral nitrogen content and activities of the N-cycle enzymes in a Luvisol topsoil. Polish Journal of Environmental Studies, 20: 1565–1573.
Piotrowska A., Długosz J. (2010): Spatial variability of mineral forms in some soils of Pomerania and Cuiavia region. Ecological Chemistry and Engineering A, 17: 817–825.
Shahandeh H., Wright A.L., Hons F.M., Lascano R.J. (2005): Spatial and temporal variation of soil nitrogen parameters related to soil texture and corn yield. Agronomy Journal, 97: 772–782. Stark C.H.E., Condron L.M., Stewart A., Di H.J., O’Callaghan M.
(2004): Small-scale spatial variability of selected soil biological properties. Soil Biology and Biochemistry, 36: 601–608. Staugaitis G., Šumskis D. (2011): Spatial variability of soil pH as
influenced by different soil sampling methods and geostatistical techniques. Žemdirbystė = Agriculture, 98: 323–332. Stevenson F.J. (1982): Nitrogen – Inorganic forms. In: Page A.L.,
Miller R.H., Keeney D.R. (eds.): Methods of Soil Analysis. Part 2. Chemical and Microbiological Properties. Madison, 625–641. Taras J.M. (1950): Phenoldisulphonic acid method of determin-ing nitrate in water. Photometric Study. Analytical Chemistry, 22: 1020–1022.
Webster R., Oliver M. (2001): Geostatistics for Environmental Scientists. Chichester, Wiley and Sons, LTD, Baffins Lane. Wilding L.P. (1985): Spatial variability: Its documentation,
accom-modation, and implication to soil surveys. In: Nielsen D.R., Bouma J. (eds.): Soil Spatial Variability. Pudoc, Wageningen, 166–194.
Received on April 4, 2016 Accepted on November 7, 2016
Corresponding author: