Nitrous oxide (N2O) emission from agricultural soils is well addressed in the international scientific literature, including assessment of the influence of various agricultural engineering factors (Bouwman et al. 1993, Kaiser and Ruser 2000, Ruíz-Valdiviezo et al. 2013), and the development of emission models of various complexity (Farquharson and Baldock 2008, Metivier et al. 2009). The soil mois-ture, temperamois-ture, content of both, NO3–-N and organic carbon, and fertilization are described as the most important factors determining N2O flux from the soil (Tiedje et al. 1982, Mogge et al. 1999, Dobbie and Smith 2003). In Poland, Włodarczyk et al. (2004) studied the effect of denitrification on N2O emission from the soil. It is estimated,
however, that only approximately 10% of arable soils in Poland have properties favoring intensive denitrification (Goliński et al. 2000). Bateman and Baggs (2005) demonstrated that nitrification could be a dominant source of N2O in the soils with soil water-filled pore space below 60%. N2O flux from the soil and its determinants have not been comprehensively evaluated in the climate, soil and fertilization conditions of Poland.
Long-term fertilization experiments are well es-tablished in evaluation of the impact of mineral and organic fertilization on the nitrogen compounds changes in the soil (Dendooven et al. 1996). This study quantifies soil N2O emission from a long-term fertilization experiment with rye
monocul-Nitrous oxide emissions from the soil under different
fertilization systems on a long-term experiment
T. Sosulski, E. Szara, W. Stępień, M. Szymańska
Department of Soil Environment Sciences, Warsaw University of Life Sciences-SGGW,
Warsaw, Poland
ABSTRACT
The research aimed at the assessment of N2O emission from agricultural soils subject to different fertilization conditions. It was carried out on a long-term experiment field in Skierniewice in Central Poland maintained with no alterations since 1923 under rye monoculture. The treatments included mineral (CaNPK), mineral-organic (CaNPK + M) and organic (Ca + M) fertilization. Measurements were conducted during the growing periods of 2012 and 2013. N2O emissions from the soil were measured in situ by the means of infrared spectroscopy using a portable FTIR spectrometer Alpha. N2O fluxes over the measurement periods showed high variability with range 0.13–11.20 g N2O-N/ha/day (median 2.87, mean 3.16) from mineral treated soil, 0.23–11.06 g N2O-N/ha/day (me-dian 3.64, mean 3.33) from mineral-organic treated soil and 0.25–12.28 g N2O-N/ha/day (median 3.14, mean 3.55) from organic treated soil. N2O fluxes from manure-treated soils were slightly higher than those from soils treated exclusively with mineral fertilizers. N2O fluxes were positively correlated with soil temperature, air temperature, and content of both, NO3– and NH4+, in the soil (0–25 cm) and, to a lesser degree, negatively correlated with soil moisture. Based on the measured N2O flux and its relationship with environmental factors it can be concluded that both, nitrification and denitrification the are important sources of N2O in mineral soils of Central Poland, where the average soil water-filled pore space during the growing period range from 22–35%. Under the climate, soil and fertilization conditions in Central Poland, the N2O emission from cultivated soils during the growing period is ap-proximately estimated as 0.64–0.73 kg N/ha.
Keywords: N2O emission; rye monoculture; static experiment; organic-mineral fertilization
ture in the climate and soil conditions of Central Poland and analyzes the relationship between the N2O emission and environmental factors.
MATERIAL AND METHODS
The research was carried out on a long-term experiment field in Central Poland (Skierniewice) belonging to the Warsaw University of Life Sciences-SGGW, maintained with no alterations since 1923 under rye monoculture. The soil is Luvisols (FAO 2006) soil of the type of loamy sand with the follow-ing fractions in the 0–25 cm layer: sand (> 0.05 mm) – 87%, silt (0.002–0.05 mm) – 5%, clay (< 0.02 mm) – 7%. The average annual temperature and pre-cipitation are 8°C and 520 mm, respectively.
The mineral (CaNPK), mineral-organic (CaNPK + M) and organic (Ca + M) fertilization systems were studied. Each treatment had 5 replications with an experimental plot area of 36 m2.
Mineral fertilizers were applied at the following rates: 90 kg N (ammonium nitrate), 26 kg P (triple superphosphate) and 91 kg K/ha (potassium chloride 50%) in both, mineral and mineral-organic ferti--lization systems. Manure was applied at the dose of 30 t/ha at 4-year intervals and at 20 t/ha yearly in the treatment subject to mineral-organic and organic fertilizing, respectively. Consequently, the annual doses of nitrogen applied in the mineral-organic and mineral-organic fertilization systems can be respectively approximated as 127.5 kg N/ha and 100 kg N/ha. Liming at 1.43 t Ca/ha was applied to all investigated treatments every fourth year. N2O emission from the soil was measured in situ by means of the infrared spectroscopy using a portable FTIR spectrometer model Alpha (Brucker Optic GmbH, Ettlingen, Germany). The N2O flux from the soil was calculated as an increase in the N2O concentration in the chamber (ø = 29.5 cm, h = 20 cm) after a 10 min exposure to the soil surface. The results were ex-trapolated to 24 h and 1 ha. Measurements were conducted in 2012 (30 measurements, 22 March to 22 October) and 2013 (28 measurements, 19 April to 23 October) in all replications. N2O emission was expressed in mg N/ha/day.
Ploughing layer soil sampling was conducted on all measurement dates in all replications. The NH4+-N/NO
3–-N content was measured using the Skalar San Plus analyzer (Breda, Netherlands), after fresh soil extraction in 0.01 mol/L CaCl2 with soil/extractant ratio of 1:10. The soil
mois-ture was assessed for each object as a decrease in the sample weigh after oven-drying in 105°C. Atmospheric and soil temperatures were measured by the Experimental field’s meteorological station.
Statistical analyses were performed with the IBM SPSS Statistics 21.0. The Mann-Whitney test and Bonferroni correction for multiple comparisons were used (P < 0.05). The Pearson correlation coefficients were calculated at P < 0.05.
RESULTS
The highest content of organic carbon and total nitrogen was found in the soil treated annually with manure (10.6 g C/kg and 0.96 g N/kg), fol-lowed by the soil under mineral-organic (8.8 g C/kg and 0.88 g N/kg) and mineral fertilization systems (5.68 g C/kg and 0.56 g N/kg). Soil pH in 1 mol/L KCl of these objects ranges from 5.8 to 6.2, with the highest values in the treatments under organic fertilization system.
The average content of mineral nitrogen in the soil under mineral and mineral-organic fertilization systems was higher in 2012 than in 2013, whereas the mineral nitrogen content in the manure-treated soil was found similar in both years (Table 1).
The average soil mineral N content was higher under mineral-organic fertilization system than under the mineral or organic ones but the differ-ences were not statistically significant. In 2012, the average NO3–-N soil content was higher (un-der mineral and organic fertilization systems) or similar (under mineral-organic fertilization) to the NH4+-N soil content. In 2013, the content of NH
to the application of ammonium nitrate (enhanced by manure mineralization in the CaNPK + M treat-ment) a decrease in the soil content of both mineral N forms was observed (until the third decade of June 2012 and mid-May 2013). Further changes
in NO3–-N and NH
[image:3.595.63.532.115.270.2]4+-N soil content were of lower amplitude. After a period of intensive N uptake by rye resulting in a notable decrease in NO3–-N/ NH4+-N content in the soil, a gradual increase in the soil content of both mineral N forms was
Table 1. Content of mineral N (NO3–-N/NH
4+-N) in soil (mg N/kg) and N2O-N emission from soil (g N/ha/day)
in different fertilization systems
Fertilization NO 2012 2013
3–-N NH4+-N Nmin N2O-N NO3–-N NH4+-N Nmin N2O-N
CaNPK
mean 5.04 3.85 8.89 3.00 3.42 3.76 7.18 3.32
median 3.60 2.55 6.40 2.85 3.19 3.12 6.54 3.02
min–max 0.07–15.66 0.03–18.84 0.39–30.11 0.13–11.20 0.75–10.67 0.89–12.64 2.00–21.89 0.14–10.65
CaNPK + M
mean 7.23 7.47 14.70 3.44 4.81 5.17 9.98 3.84
median 5.07 3.41 8.90 3.13 4.13 4.21 8.37 3.53
min–max 0.25–32.50 0.05–30.73 0.58–56.57 0.40–9.93 1.20–14.80 1.17–18.44 2.54–32.12 0.23–11.06
Ca + M
mean 5.78 2.88 8.66 3.69 3.86 4.62 8.48 3.40
median 6.13 2.94 9.25 3.06 3.73 4.44 8.27 3.15
min–max 0.39–13.4 0.12–8.42 1.33–18.33 0.33–12.28 1.30–8.01 0.89–10.07 4.00–14.39 0.25–9.04 CaNPK – mineral, CaNPK + M – mineral-organic, Ca + M – organic fertilization systems
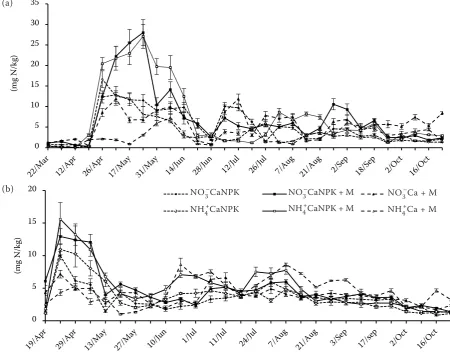
Figure 1. Soil content of NO3–-N and NH
4+-N under different fertilization systems in 2012 (a) and 2013 (b).
CaNPK – mineral, CaNPK + M – mineral-organic, Ca + M – organic fertilization systems 0
5 10 15 20 25 30 35
(mg N
/k
g)
0 5 10 15 20
(mg N
/k
g)
NO3- CaNPK NO3- CaNPK+M NO3- Ca+M
NH4+ CaNPK NH4+ CaNPK+M NH4+ Ca+M
(a)
0 5 10 15 20 25 30 35
(mg N
/k
g)
0 5 10 15 20
(mg N
/k
g)
NO3- CaNPK NO3- CaNPK+M NO3- Ca+M
NH4+ CaNPK NH4+ CaNPK+M NH4+ Ca+M
(b) NO
3–CaNPK
NH4+CaNPK
NO3–CaNPK + M NH4+CaNPK + M
NO3–Ca + M
[image:3.595.62.513.374.728.2]observed, most markedly in the manure-treated soil (CaNPK + M, Ca + M). In 2013, the increase in NH4+-N soil content was distinctly higher than that of NO3–-N. The dominance of NH4+ over NO3– was probably caused by a permanent reduction in the nitrifying bacterial flora as a result of the summer flood.
A decrease in the soil content of both forms of mineral N was noted from the beginning of September, probably as a result of decreased inten-sity of N compounds transformation and N uptake by germinated rye. An increase in the mineral N content observed in the end of the vegetation period in the soil treated exclusively with manure is explained by treatment application at that time.
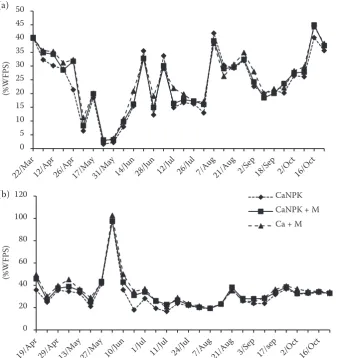
The soil moisture observed across various fertil-ization systems was similar and varied over time as depicted in Figure 2. The average soil moisture in 2013 exceeded that in 2012 by approximately 36%. The air and soil temperatures are presented in Figure 3. In most instances, the average daily soil temperature values slightly exceeded the re-spective air temperature values.
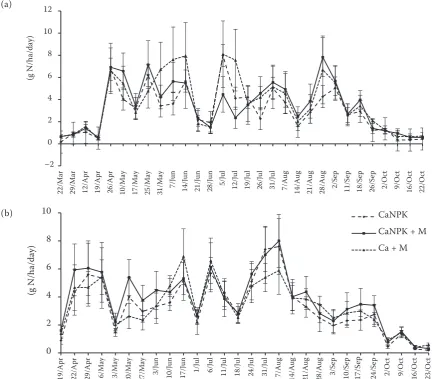
N2O flux over the measurement periods showed high variability with range 0.13–11.20 g N2O-N/ ha/day (median 2.87, mean 3.16) from mineral treated soil, 0.23–11.06 g N2O-N/ha/day (median 3.64, mean 3.33) from mineral-organic treated soil and 0.25–12.28 g N2O-N/ha/day (median 3.14, mean 3.55) from organic treated soil. In both 2012 and 2013, the differences in N2O emission from the soil under diverse fertilization systems were of no statistical significance (Table 1). Daily N2O emission from the soil is depicted in Figure 4. Spring application of ammonia nitrate resulted in high N2O emission from the soil. Simultaneously, increased N2O emission was observed from the soil fertilized exclusively with manure regardless of lower mineral N content in the manure treated soil. During the flooding at the beginning of June 2013 no rapid increase in soil N2O emission was noted. This phenomenon can be explained by the low mineral N content in the soil and low tem-perature (Figures 1 and 3). From the end of May to the end of the second decade of June 2012, N2O emission from the soil treated exclusively with ma-0
5 10 15 20 25 30 35 40 45 50
(%
W
FP
S)
0 20 40 60 80 100 120
(%
W
FP
S)
[image:4.595.66.404.84.443.2]CaNPK CaNPK + M Ca + M
Figure 2. Moisture of soil (0–25 cm) under different fertilization systems in 2012 (a) and 2013 (b). CaNPK – mineral, CaNPK + M – min-eral-organic, Ca + M – organic fertilization systems; WFPS – soil moisture
(a)
nure exceeded that from the soil subject to mineral fertilization only, as revealed in the majority of measurements. Similar situation was observed at the end of August/beginning of September 2012. In 2013, the dynamics of N2O emission from the soil was found similar across different fertiliza-tions systems. On some occasions in the second half of the vegetation period, N2O emission from the soil under mineral and mineral-organic fer-tilization systems reached or even exceeded the N2O emission from the soil during the spring nitrogen peak in the soil (Figure 4). This finding can be explained by high correlation between N2O emission and the air and soil temperatures, the latter being higher in the second half of the growing period than in spring.
The N2O fluxes from the soil were positively cor-related with the soil and atmospheric temperatures (r = 0.77, P < 0.01 and r = 0.73, P < 0.01, respectively), the soil NO3– content and soil NH4+ content (r = 0.61,
P < 0.01 and r = 0.47, P < 0.01, respectively) (Table 2). The relationship between N2O emission from the soil and the soil moisture was described by a
negative correlation coefficient, low in terms of the absolute value and significance.
DISCUSSION
[image:5.595.63.368.81.441.2]Emission of N2O from manure-treated soils (Ca + M, CaNPK + M) slightly exceeded the emission from the soil subject to pure mineral fertiliza-tion (CaNPK). The difference was determined by a unique interplay between the weather and soil factors. Kaiser and Ruser (2000) obtained similar results on a sandy loam soil. According to Cannavo et al. (2004), additional oxygen consumption in organic treated-soil promotes denitrification. In a study by Mogge et al. (1999), N2O emission from cattle slurry-treated soil was 40% higher than that from the soil under mineral fertilization. As reported by Sánchez-Martín et al. (2008), N2O emission is related to organic carbon content in the soil. The authors hypothesize that denitrifica-tion is an important source of N2O in C-poor soil. This can be explained by the results of Tiedje et
Figure 3. Atmospheric (Ta) and soil (Ts) temperatures in 2012 (a) and 2013 (b)
0 5 10 15 20 25 30
(
°
C)
0 5 10 15 20 25 30
(
°
C)
Ta Ts (a)
(b) T
a
Ts
al. (1982), who demonstrated that organic carbon is more important than oxygen in determining the denitrifying enzyme content in habitats. The availability of organic carbon does not only support the activity of denitrifiers per se, but also has an indirect effect of causing microsite anaerobiosis, due to increased respiratory demand for oxygen. Therefore increased availability of labile carbon would favor complete denitrification to N2. The use of an organic fertilizer instead of an inorganic one could contribute to a reduction in N2O emission. Organic fertilizers mitigated N2O emission from Scottish grassland (Ball et al. 2004) as compared to mineral fertilizers. The use of organic fertilizer instead of an inorganic one could contribute to a reduction in N2O emission. In our study, N2O flux from the organic treatment was insignificantly higher than that from the mineral one, regardless of similar nitrogen doses applied under different fertilization systems. Organic
carbon content in manure-treated soil (Ca + M) was nearly two-fold higher than in the soil under mineral fertilization system (CaNPK). Based on the research by Tiedje et al. (1982) it is suggested that the high content of organic carbon and total nitrogen in the soil treated exclusively with manure promotes the growth of bacteria whose metabolism results in N2O production it the soil.
[image:6.595.63.500.85.464.2]Several attempts were made to model N2O emis-sion and/or its causative processes in various agroecosystems (Zheng et al. 2008). According to Dobbie and Smith (2003) the key factors affecting N2O emission from the agricultural soil included the soil moisture, temperature and NO3–-N con-tent. In our study, N2O emission from the soil was positively correlated with soil and air temperatures, N2O flux being considerably higher in July than in March or October (Table 3). On the contrary, upon the climate conditions of Germany, high –2 0 2 4 6 8 10 12 22 /M ar 29 /M ar 12 /A pr 19 /A pr 26 /A pr 10 /M ay 17 /M ay 25 /M ay 31 /M ay 7/ Ju n 14 /Ju n 21 /Ju n 28 /Ju n 5/ Ju l 12 /Ju l 19 /Ju l 26 /Ju l 31 /Ju l 7/ A ug 14 /A ug 21 /A ug 28 /A ug 2/ Se p 11 /S ep 18 /S ep 26 /S ep 2/ O ct 9/ O ct 16 /O ct 22 /O ct (g N /h a/ da y) 0 2 4 6 8 10 19 /A pr 22 /A pr 29 /A pr 6/ M ay 13 /M ay 20 /M ay 27 /M ay 3/ Ju n 10 /Ju n 17 /Ju n 1/ Ju l 6/ Ju l 11 /Ju l 18 /Ju l 24 /Ju l 31 /Ju l 7/ A ug 14 /A ug 21 /A ug 28 /A ug 3/ Se p 10 /S ep 17 /s ep 24 /S ep 2/ O ct 9/ O ct 16 /O ct 23 /O ct (g N /h a/ da y) CaNPK CaNPK + M Ca + M
Figure 4. N2O-N emission from soil under different fertilization systems in 2012 (a) and 2013 (b). CaNPK – mineral, CaNPK + M – mineral-organic, Ca + M – organic fertilization systems
(a)
(b)
17/S
N2O emission from the soil was observed even in February and October (Kaiser et al. 1998), and up to 50% of emission took place in the winter (Kaiser and Ruser 2000). This phenomenon is attributed to the lack of freezing/thawing cycles (Mogge et al. 1999).
In our study, N2O emission from the soil was posi-tively correlated with the soil NO3–-N and NH4+-N content. N2O emission from the soil was better correlated with the soil content of NO3–-N (prod-uct of nitrification and precursor of denitrifica-tion) than with the soil content of NH4+-N. The relatively high correlation between N2O emission from the soil and NH4+-N soil content suggests that the nitrification can be an important source of the soil N2O in Poland. The N2O flux from the soil could be more significantly correlated with the soil NH4+-N content than with the soil NO3–-N content, as shown by Fu et al. (2012). According to Liu et al. (2007), NH4+-N enhances the N2O emission from the soil only at lower soil moisture. The high emission of N2O from both the soil with high mineral N content following spring fertilization and that with low mineral N content in the second half of the vegetation period (higher air/soil tem-peratures) suggests that N2O flux depends on the amount of mineral N as well as on the intensity of its transformation in the soil.
In our study, the relationship between N2O emission from the soil and the soil moisture was described by a low negative correlation coefficient (r = –0.253, P = 0.01). In contrast to our results, Smith et al. (1998) demonstrated that the N2O flux from the soil increased with soil moisture increas-ing over 60–90% water-filled pore space. In our study, comparably high soil moisture was evidenced only at the beginning of June 2013 and it was not accompanied by a rapid increase in N2O emission from the soil. This finding is explained by very low soil NO3–-N content at that time, subsequent to an intensive nitrogen uptake by plants in the preceding period. Bateman and Baggs (2005) evidenced that all N2O emitted at 70% WFPS was produced during denitrification, whereas nitrification was the main process producing N2O at 35–60% WFPS. Given that the majority of measurements in our study revealed soil moisture below 50% WFPS, it can be concluded that nitrification was a key source of N2O emission and that both, denitrification and nitrification are important sources of N2O from light sandy soils of Central Poland.
[image:7.595.63.532.114.196.2]The N2O emission from cultivated light sandy soils of Central Poland during the growing period was estimated as 0.64 kg N2O-N/ha in the mineral fertilization system and 0.72 kg N2O-N/ha in the organic and mineral-organic fertilization systems.
Table 2. Correlation coefficients between N2O-N emission form soil and mineral N content in soil, soil moisture (%WFPS), atmospheric temperature (Ta) and soil temperature (Ts)
Fertilization NO3–-N NH4+-N %WFPS Ta Ts
CaNPK 0.66** 0.48** –0.28* 0.73** 0.78**
CaNPK + M 0.59** 0.56** –0.24* 0.69** 0.72**
Ca + M 0.76** 0.46** –0.33* 0.80** 0.82**
Mean 0.61** 0.47** –0.25** 0.73** 0.77**
*P < 0.05; **P < 0.01; CaNPK – mineral, CaNPK + M – mineral-organic, Ca + M – organic fertilization systems
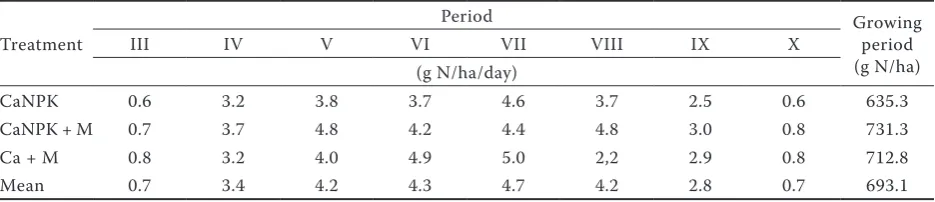
Table 3. Average daily N2O-N emission from soil (March–October) and total N2O-N emission from soil during growing period in 2012 and 2013 in different fertilization systems
Treatment
Period Growing
period (g N/ha)
III IV V VI VII VIII IX X
(g N/ha/day)
CaNPK 0.6 3.2 3.8 3.7 4.6 3.7 2.5 0.6 635.3
CaNPK + M 0.7 3.7 4.8 4.2 4.4 4.8 3.0 0.8 731.3
Ca + M 0.8 3.2 4.0 4.9 5.0 2,2 2.9 0.8 712.8
Mean 0.7 3.4 4.2 4.3 4.7 4.2 2.8 0.7 693.1
[image:7.595.64.532.641.742.2]REFERENCES
Ball B.C., McTaggart I.P., Scott A. (2004): Mitigation of green-house gas emissions from soil under silage production by use of organic or slow-release fertilizer. Soil Use and Management, 20: 287–295.
Bateman E.J., Baggs E.M. (2005): Contributions of nitrification and denitrification to N2O emissions from soils at different water-filled pore space. Biology and Fertility of Soils, 41: 379–388. Bouwman A.F., Fung I., Matthews E., John J. (1993): Global
analy-sis of the potential for N2O production in natural soils. Global Biogeochemical Cycles, 7: 557–597.
Cannavo P., Richaume A., Lafolie F. (2004): Fate of nitrogen and carbon in the vadose zone: In situ and laboratory measurements of seasonal variations in aerobic respiratory and denitrifying activities. Soil Biology and Biochemistry, 36: 463–478. Dendooven L., Poulton P.R., Powlson D.S., Weigel A., Ritzkowski
E.M., Körschens M., Kubát J., Klir J., Mercik S. (1996): Dynam-ics of carbon and nitrogen in long-term field experiments with organic and inorganic fertilizer applications in soil with differ-ent texture under differdiffer-ent climatic regimes. Transactions of the 9th Nitrogen Workshop. Braunschweig, 205–209.
Dobbie K.E., Smith K.A. (2003): Nitrous oxide emission fac-tors for agricultural soils in Great Britain: The impact of soil water-filled pore space and other controlling variables. Global Change Biology, 9: 204–218.
FAO (2006): World Reference Base for Soil Resources. A Frame-work for International Classification, Correlation and Com-munication. World Soil Resources Report, 103. Food and Agriculture Organization of the United Nations, Rome, 116. Farquharson R., Baldock J. (2008): Concepts in modelling N2O
emissions from land use. Plant and Soil, 309: 147–167. Fu X.Q., Li Y., Su W.J., Shen J.L., Xiao R.L., Tong C.L. Wu J. (2012):
Annual dynamics of N2O emissions from a tea field in southern subtropical China. Plant, Soil and Environment, 58: 373–378. Goliński J., Stępniewska Z., Stępniewski W., Ostrowski J., Szmaga-ra A. (2000): A contribution to the assessment of potential denitrification in arable mineral soils of Poland. Journal Water and Land Development, 4: 175–183.
Kaiser E.A., Kohrs K., Kücke M., Schnug E., Heinemeyer O., Munch J.C. (1998): Nitrous oxide release from arable soil: Importance of N-fertilization, crops and temporal variation. Soil Biology and Biochemistry, 12: 1553–1563.
Kaiser E.A., Ruser R. (2000): Nitrous oxide emissions from ar-able soils in Germany – An evaluation of six long-term field experiments. Journal of Plant Nutrition and Soil Science, 163: 249–260.
Liu X.J., Mosier A.R., Halvorson A.D., Reule C.A., Zhang F.S. (2007): Dinitrogen and N2O emissions in arable soils: Effect of tillage, N source and soil moisture. Soil Biology and Bio-chemistry, 39: 2362–2370.
Mogge B., Kaiser E.A., Munch J.C. (1999): Nitrous oxide emis-sions and denitrification N-losses from agricultural soils in the Bornhöved Lake region: Influence of organic fertilizers and land-use. Soil Biology and Biochemistry, 31: 1245–1252. Metivier K.A., Pattey E., Grant R.F. (2009): Using the ecosys
mathematical model to simulate temporal variability of nitrous oxide emissions from a fertilized agricultural soil. Soil Biology and Biochemistry, 41: 2370–2386.
Ruíz-Valdiviezo V.M., Mendoza-Urbina L.D., Luna-Guido M., Gutiérrez-Miceli F.A., Cárdenas-Aquino M.R., Montes-Molina J.A., Dendooven L. (2013): Emission of CO2, CH4 and N2O and dynamics of mineral N in soils amended with castor bean (Ricinus communis L.) and piñón (Jatropha curcas L.) seed cake. Plant, Soil and Environment, 59: 51–56.
Sánchez-Martín L., Vallejo A., Dick J., Skiba U.M. (2008): The in-fluence of soluble carbon and fertilizer nitrogen on nitric oxide and nitrous oxide emissions from two contrasting agricultural soils. Soil Biology and Biochemistry, 40: 142–151.
Smith K.A., Thomson P.E., Clayton H., Mctaggart I.P., Conen F. (1998): Effects of temperature, water content and nitrogen fertilisation on emissions of nitrous oxide by soils. Atmospheric Environment, 32: 3301–3309.
Tiedje J.M., Sexstone A.J., Myrold D.D., Robinson J.A. (1982): Denitrification: Ecological niches, competition and survival. Antonie Van Leeuwenhoek, 48: 569–583.
Włodarczyk T., Stępniewski W., Brzezińska M., Stępniewska Z. (2004): Nitrate stability in loess soils under anaerobic condi-tions-laboratory studies. Journal of Plant Nutrition and Soil Science, 167: 693–700.
Zheng X., Mei B., Wang Y., Xie B., Wang Y., Dong H., Xu H., Chen G., Cai Z., Yue J., Gu J., Su F., Zou J., Zhu J. (2008): Quantification of N2O fluxes from soil-plant systems may be biased by the applied gas chromatograph methodology. Plant and Soil, 311: 211–234.
Received on December 30, 2013 Accepted on October 7, 2014
Corresponding author:
Tomasz Sosulski, Ph.D., Warsaw University of Life Sciences-SGGW, Department of Soil Environment Sciences, Nowoursynowska 159, 02 776 Warsaw, Poland