Original Article
Impact of preoperative and postoperative body mass
index on disease-free survival after resection for
gastric cancer
Chenxi Li1,2, Yan Shi1, Xiaochuan Guo1,3, Mengjiao Fan1, Liu Yang1, Guanghai Dai1
1Department of Oncology, Chinese People’s Liberation Army General Hospital, Beijing, China; 2Department of Oncology, The First Affiliated Hospital of People’s Liberation Army General Hospital, Beijing, China; 3Department of Lymphoma, Beijing Shijitan Hospital, Beijing, China
Received October 24, 2016; Accepted February 12, 2017; Epub April 15, 2017; Published April 30, 2017
Abstract: Objective: To investigate the associations between preoperative and postoperative body mass index (BMI) and disease-free survival (DFS) in patients with gastric cancer. Methods: A total of 434 patients who underwent a curative (R0) resection for gastric cancer between 2011 and 2013 were retrospectively studied. We recorded preop-erative BMI, BMI at 1 month after surgery and BMI at 6 months after surgery. All patients were divided into 3 groups according to their BMI: low BMI group (< 18.5 kg/m2), normal BMI group (18.5-25 kg/m2), and high BMI group (≥ 25 kg/m2). Clinical-pathological characteristics, oncologic outcomes, and DFS were collected and compared between the 3 groups. To analyze the effects of changes in BMI from before surgery to 6 months after surgery on DFS, pa-tients were stratified into a stable BMI, increased BMI, and decreased BMI group. DFS was compared between the 3 groups. Results: Regarding preoperative BMI, the 2-year DFS rate was 70.3% in low BMI group, 71.5% in normal BMI group, and 68.8% in high BMI group (P=0.904). No significant differences were observed in DFS according to postoperative BMI. Using changes in BMI to predict DFS, the 2-year DFS rate was 72.2% in the stable BMI group, 91.7% in the increased BMI group, and 64.8% in the decreased BMI group (P=0.149). In a Cox proportional hazards model, a high BMI before surgery, compared to normal BMI, was associated with a lower DFS (hazard ratio 2.64; 95% confidence interval, 1.02-6.84, P=0.045). However, postoperative BMI and BMI change status were also not associated with DFS. Conclusion: Before surgery, normal BMI significantly predicted the higher DFS of patients with gastric cancer compared with the high BMI. However, postoperative BMI and changes in BMI were not independent prognostic factors of DFS.
Keywords: Gastric cancer, body mass index, BMI change status, disease-free survival (DFS)
Introduction
In recent years, despite significant decreases in the incidence and mortality rates of gastric cancer (GC), GC continues to be an important public health problem worldwide [1]. Nearly two-thirds of stomach cancers occur in devel-oping countries, especially in South America and China [1]. In China, GC is the third most fre-quent cancer diagnosis and cause of cancer-related death [2]. Although the prognosis after gastric resection largely depends on the stage of disease at presentation, other patient-level factors may affect outcomes [3]; body mass index (BMI) may be one of these factors. BMI
(calculated as weight [kg]/height [m2]) is often
classified as underweight (< 18.50 kg/m2),
nor-mal (18.5-24.99 kg/m2), overweight (≥ 25.00
kg/m2), and obese (≥ 30.00 kg/m2) [4]. Several
investi-gate the relationships of preoperative and postoperative BMI and BMI change status with DFS in patients with gastric cancer.
Materials and methods
In this study, patients who underwent gastrec-tomy for gastric cancer in our hospital between January 1, 2011 and December 31, 2013 were included. The study was approved by the ethics committee of the Chinese PLA General Hospital, and each subject provided informed written
[image:2.612.92.521.83.560.2]consent. The histological confirmation of neo -plasia was preoperatively determined by endo-scopic biopsy. Subtotal or total gastrectomy was performed according to tumor location and the possibility of obtaining negative resection margins and a potentially curative (R0) resec-tion. All patients were followed by telephone and clinical data, and the time and metastasis location of tumor recurrence, family history of cancer and time of death were recorded. All patients’ follow-up lasted from surgery to May 1, 2016. The endpoint was defined as gastric Table 1. Patient details (before surgery) and clinicopathological features
Total (%) Group (%)Low BMI Normal BMI Group (%) Group (%)High BMI P value
Patient (n) 434 64 (14.7%) 200 (46.1%) 170 (39.2%)
Preoperative BMI 23.8±4.2 17.6±0.7 22.3±1.5 28.0±2.6 < 0.001 Age (y) 55.2±10.5 55.0±12.7 54.9±10.4 55.8±9.7 0.7080
Sex (male, female) 334:100 42:22 147:53 145:25 0.0018
Tumor site 0.3975
Upper third 124 (28.6%) 18 (14.5%) 56 (45.2%) 50 (40.3%) Middle third 121 (27.9%) 17 (14.0%) 57 (47.1%) 47 (38.8%) Lower third 155 (35.7%) 20 (12.9%) 70 (45.2%) 65 (41.9%)
Diffuse 34 (7.8%) 9 (26.5%) 17 (50%) 8 (23.5%)
pT 0.0511
1 28 (6.5%) 3 (10.7%) 13 (46.4%) 12 (42.9%)
2 48 (11.1%) 10 (20.8%) 21 (43.8%) 17 (35.4%)
3 73 (16.8%) 16 (21.9%) 22 (30.1%) 35 (47.9%)
4 285 (65.7%) 35 (12.3%) 144 (50.5) 106 (37.2%)
pN 0.5983
0 96 (22.1%) 12 (12.5%) 44 (45.8%) 40 (41.7%)
1 87 (20.0%) 12 (13.8%) 34 (39.1%) 41 (47.1%)
2 103 (23.7) 14 (13.6%) 54 (52.4%) 35 (34.0%)
3a 92 (21.2%) 15 (16.3%) 41 (44.6%) 36 (39.1%)
3b 56 (12.9%) 11 (19.6%) 27 (48.2%) 18 (32.1%)
Histological type 0.1475
Adenocarcinoma 256 (59.0%) 37 (14.5%) 118 (46.1%) 101 (39.5%) Signet Ring Cell Carcinoma 21 (4.8%) 7 (33.3%) 9 (42.9%) 5 (23.8%) Mixed 157 (36.2%) 20 (12.7%) 73 (46.5%) 64 (40.8%)
Tumor grading 0.6519
Well 14 (3.2%) 2 (14.3%) 7 (50%) 5 (35.7%)
Moderate 50 (11.5%) 11 (22%) 21 (42%) 18 (36%)
Poor 370 (85.3%) 51 (13.8%) 172 (46.5) 147 (39.7%)
Family history of cancer 0.3157
Yes 104 (24.0%) 20 (19.2%) 44 (42.3%) 40 (38.5%)
No 330 (76.0%) 44 (13.3%) 156 (47.3%) 130 (39.4%)
Adjuvant chemotherapy 0.9425
Yes 300 (69.1%) 45 (15%) 139 (46.3%) 116 (38.7%)
cancer recurrence or metastasis, and disease-free survival was based on the period from sur-gery to the end of follow-up or endpoint. The retrospective data included the following: patient age and sex; diagnoses; preoperative body weight and height; body weight and height 1 month and 6 months after surgery; operative site; detailed postoperative pathologic findings; tumor node metastasis (TNM) classification of malignant tumors and cancer stage (the pTNM classification was updated to the 7th edition [11]); and postoperative adjuvant chemothera-py regimen. Patients with metastatic stage IV disease, a non-R0 resection and incomplete
A total of 434 patients who underwent radical operation for gastric cancer in our hospital between January 1, 2011 and December 31, 2013 were included. According to the preopera-tive BMI categories, there were 64 (14.7%) pati- ents in low BMI group, 200 (46.1%) patients in normal BMI group, and 170 (39.2%) patients in high BMI group. Patient characteristics are summarized in Table 1. The mean age was 55.2 y, and the mean BMI was 23.8 kg/m2. The
[image:3.612.93.374.74.211.2]majority of patients were male, and the male and female ratio was 334:100. The tumor loca-tions were as follows: upper third in 124 cases (28.6%), middle third in 121 cases (27.9%), Figure 1. Preoperative and postoperative BMI distribution. Before surgery,
most of the patients were in the normal BMI group or the high BMI group, and
only a small number of patients in the low BMI group. However, after surgery, the number of patients in the high BMI group decreased significantly, and
the number of patients in the normal group and low BMI group increased, especially at 6 months after operation.
information were excluded from the analysis. All patients were divided into three groups according to BMI level: low BMI group (BMI < 18.5 kg/ m2), normal BMI group (BMI
18.5-25 kg/m2), and high BMI
group (BMI ≥ 25 kg/m2). The
change in BMI from before surgery to 6 months after sur-gery was recorded, and the change was categorized into 3 groups: stable, increased, and decreased BMI groups. All analyses were performed with SPSS version 19.0 soft-ware. Continuous variables are presented as the mean ± standard deviation (x±s). Va- riance analysis was used to compare the continuous vari-ables that were not normally distributed. Count data were presented as the percentage (%) and were compared using Pearson’s correlation analysis of two variables; additionally, a survival analysis was per-formed using Kaplan Meier’s method, and prognostic fac-tors were investigated in a multivariable analysis using a Cox proportional hazards regression model. A P value < 0.05 (two-tailed) was consid-ered statistically significant.
Results Figure 2. Number of patients in groups by change in BMI status. The changes
[image:3.612.94.377.309.457.2]lower third in 155 cases (35.7%), and diffuse in 34 cases (7.8%). Most tumors were locally advanced and penetrated the serosal layer (T4 tumors: n=285, 65.7%). Lymph node metasta-sis was common (n=338, 77.9%). On pathology, most histological types were adenocarcinoma
[image:4.612.92.373.76.281.2]in BMI from surgery to 6 months after surgery. Weight loss occurred in most patients after sur-gery, leading to only 12 patients in the increased status group; the other patients were in the stable status group (n=277) and the decreased status group (n=145).
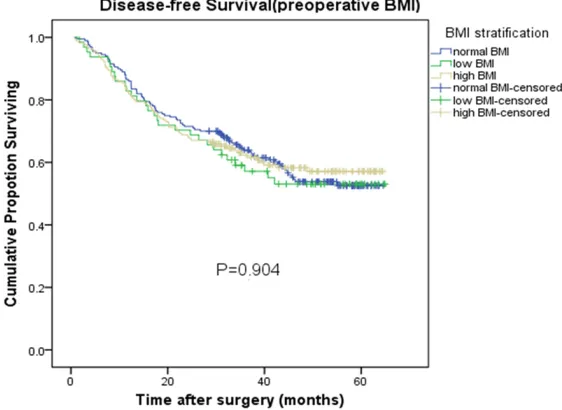
Figure 3. Disease-free Survival in preoperative BMI. Disease-free Survival of patients grouped by BMI before surgery, no significant differences were observed in the low BMI group, normal BMI group and high BMI group (P=0.904).
[image:4.612.92.372.357.573.2](n=256, 59.0%) or mixed (n=157, 36.2%), whereas the remaining tumors were signet ring cell carcinoma (n=21, 4.8%). Most pathological gr- ades were poorly differentiat-ed (n=370, 85.3%); only 14 cases (3.2%) were well differ-entiated, and the others were moderately differentiated (n= 45, 11.6%). Additionally, 104 (24.0%) of the GC cases had a positive family history of malignant neoplasm, whether in first- or second-degree rela -tives. Of note, there was a higher proportion of males in the normal BMI and high BMI groups, and no significant relationships were found bet- ween BMI and tumor site, local depth of invasion, lymph node metastasis, histological type, pathological grading, family history of cancer or adjuvant chemotherapy. Fig- ure 1 shows the BMI grouping of the patients before and after surgery. Before surgery, 64, 200 and 170 patients were in low BMI group, normal BMI group and high BMI group, respectively. However, 1 month after surgery, the number of patients in the low BMI group and normal BMI group increased to 82 and 270, respectively. In contrast, the number of patients with a high BMI decreased to 82. Finally, 6 months after sur-gery, the number of patients in the high BMI group was sig-nificantly reduced, with only 72 patients in this group, and the number of patients with a low BMI increased to 110. Figure 2 shows the changes Figure 4. Disease-free Survival in postoperative BMI. Disease-free Survival of
In this study, the mean duration of follow-up was 36.1±18.9 months (range 0.7-64.9 mon- ths), which did not differ between the BMI groups. The overall median DFS was not reached. The 1- and 2-year DFS rates were 83.9% and 70.3%, respectively. The DFS curves
tive BMI, both 1 month after surgery and 6 months after surgery, and BMI change status were not associated with DFS after adjusting for patient age, sex, tumor site, tumor stage, histological type, pathological grading, family history of cancer, and adjuvant chemotherapy. are shown in Figure 3 by pre-operative BMI group; the 2-year DFS rate was 70.3% in low BMI group versus 71.5% in normal BMI group versus 68.8% in high BMI group (P=0.904). No significant dif -ferences were observed in this stratified analysis. Figu- res 4 and 5 show the postop-erative DFS curves for the three BMI groups. In the Ka- plan-Meier curve for BMI 1 month after surgery, although the 2-year DFS rate was great-er in the high BMI group than in the low (72.0% versus 67.1%) and normal BMI gro- ups (72.0% versus 70.7%) (Fi- gure 4), there were no signifi -cant differences in the three groups (P=0.999). In the Ka- plan-Meier curve for BMI 6 months after surgery, althou- gh the three groups of curv- es were separated and the 2-year DFS rate differed after the gastric cancer operation (63.6% versus 71.8% versus 75%), on the whole, there was no statistically significant dif -ference in the three groups (P=0.144). Regarding the changes in BMI (Figure 6), the analysis showed that the increased status group had a longer 2-year DFS rate com-pared to the stable status group and the decreased sta-tus group (91.7% versus 72.2% versus 64.8%). How-ever, no statistically signifi -cant differences were obser- ved in this stratified analysis (P=0.149).
In a Cox proportional hazards model (Table 2), postopera-Figure 5. Disease-free Survival in postoperative BMI. Disease-free Survival of
[image:5.612.94.374.78.286.2]patients grouped by BMI at 6 months after surgery, no significant differences were observed in the low BMI group, normal BMI group and high BMI group (P=0.144).
[image:5.612.93.371.361.570.2]Table 2.Multivariate analysis showing independent effects on disease-free survival
B value Hazard ratio 95% CI P value
Preoperative BMI 0.097
Low BMI -1.19 0.33 0.11-1.02 0.053
Normal BMI -- 1
High BMI 0.971 2.64 1.02-6.84 0.045
BMI at 1 month after surgery 0.54
Low BMI 0.349 1.42 0.76-2.63 0.27
Normal BMI -- 1
High BMI -0.029 0.97 0.57-1.64 0.914
BMI at 6 months after surgery 0.18
Low BMI 0.852 2.34 0.92-6.00 0.074
Normal BMI -- 1
High BMI -0.937 0.39 0.13-1.81 0.096
BMI change status 0.31
Stable BMI group -- 1
Increased BMI group 0.099 1.1 0.19-6.30 0.912 Decreased BMI group -0.754 0.47 0.16-1.36 0.164
Age (years) 0.41
< 60 -- 1
≥ 60 -0.137 0.87 0.63-1.21 0.41
Sex (male, female) 0.87
Male -- 1
Female 0.032 1.03 0.71-1.51 0.87
Tumor site 0.005
Upper third -- 1
Middle third 0.532 1.7 1.12-2.59 0.013
Lower third 0.344 1.41 0.94-2.13 0.101
Diffuse 0.958 2.61 1.50-4.54 0.001
pT 0
1 -- 1
2 -0.250 0.78 0.17-3.57 0.748
3 1.696 5.45 1.60-18.56 0.007
4 2.183 8.87 2.74-28.77 0
pN 0
0 -- 1
1 1.906 6.73 3.18-14.23 0
2 2.258 9.57 4.48-20.42 0
3a 2.604 13.52 6.36-28.72 0
3b 3.351 28.53 13.27-61.33 0
Histological type 0.116
Adenocarcinoma -- 1
Signet Ring Cell carcinoma 0.740 2.10 1.04-4.22 0.039
Mixed 0.085 1.09 0.79-1.50 0.597
Tumor grading 0.03
Well differentiated -- 1
Moderate differentiated 0.623 1.86 1.17-2.97 0.009 Poorly differentiated -0.020 0.98 0.33-2.89 0.971
Family history of cancer 0.906
Yes -- 1
No 0.022 1.02 0.71-1.47 0.906
Adjuvant chemotherapy 0
Yes -1.076 0.34 0.25-0.47 0
However, regarding the pre -operative BMI, compared with patients with a normal BMI, the disease-free sur-vival was lower in the high BMI group (adjusted haz-ards ratio =2.64; 95% confi -dence interval =1.02-6.84). In addition, increasing T- stage and lymph node stage, middle third or dif-fuse tumor, signet ring cell carcinoma, not well differ-entiated, and not complet-ed standardizcomplet-ed adjuvant chemotherapy all indicated a lower DFS rate.
Discussion
With the improvements in people’s living conditions, there is an increasing num-ber of people who are over-weight or obese. It is well known that obesity is asso-ciated with cancer inci-dence and mortality, hyper-tension, and heart disease [12]. BMI is the standard indicator for evaluating the quality of the body, which is closely related to the occur-rence and development of gastric cancer [13]. How-ever, the role of BMI in the prognosis of gastric cancer is not as well understood. Therefore, this study exam-ined the impact of preo- perative and postoperative BMI and BMI change status on disease-free survival after resection for gastric cancer.
in the univariate analysis. In the multivariate analysis, however, before surgery, although the low BMI was not found to be impact DFS, the normal BMI group had a higher DFS rate com-pared to the high BMI group after adjusting for patient age, sex, tumor site, tumor stage, histo-logical type, pathohisto-logical grading, family history of cancer, and use of adjuvant chemotherapy. According to the postoperative BMI groups (whether BMI 1 month after surgery or BMI 6 months after surgery), the low BMI group seemed to have a lower DFS rate. Similarly, according to the change in BMI groups, patients with an increase in BMI seemed to not be prone to recurrence after surgery. However, after sta -tistical analysis, postoperative BMI and BMI change status were also not associated with DFS in a Cox proportional hazards model.
Preoperative BMI and DFS
In recent years, people have investigated the relationship between obesity and the prognosis of cancer. In breast cancer, obesity, whether at cancer diagnosis or after diagnosis, is related to poor outcomes [14]. In prostate cancer, obese patients have lower rates of DFS after radical operation and higher rates of death from prostate cancer [15]. In colon cancer, obese patients showed a trend toward worse DFS and OS, whereas overweight patients had a better OS [16]. Regarding gastric cancer, sev-eral studies have focused on the effects of obe-sity on cancer survival, but the results are inconclusive [3, 17, 18]. Dhar et al. reported that patients with a high BMI were at an increased risk of inadequate nodal sampling during gastric cancer resection, which in turn could lead to a higher risk of local recurrence [19]. In contrast, some studies suggest that a high BMI is not a risk factor for either DFS or OS in patients undergoing gastric resection for adenocarcinoma [3, 17, 20]. Additionally, some studies have proposed the “obesity paradox” theory and have suggested that GC patients with a high BMI who receive gastrectomy exhib-it a paradoxically “superior” survival outcome compared with normal BMI patients [21, 22]. The mechanisms underlying the effects of BMI on the prognosis of gastric cancer remain poor-ly understood, but they may involve the inflam -matory response, immune system, adipokines and others. Therefore, we need intensive stud-ies on this topic. However, there are few inten
-sive studies on the relationship between low BMI and gastric cancer prognosis. Most studies have noted that low BMI did not impact DFS. This is consistent with our study.
Postoperative BMI, BMI change and DFS
Previous studies have analyzed the relationship between preoperative BMI and DFS. However, unlike other surgeries, gastrectomy is always accompanied by a decrease in body weight. Therefore, postoperative BMI and BMI change are worth noting. Prominent losses in body weight and abdominal fat are observed in the first 3 months after gastrectomy in patients with early gastric cancer, after which the pa- tient’s weight tends to stabilize [17]. Accordingly, we analyzed the effects of BMI 1 month and 6 months after the operation as well as of chang-es in BMI (difference between preoperative BMI and BMI 6 months after surgery) on DFS. One recent study reported that compared with preoperative BMI, BMI 1 year after surgery sig-nificantly predicted the long-term survival of patients with gastric cancer but was not inde-pendently associated with either disease-spe-cific survival or recurrence-free survival, which is consisted with our findings [17]. Most gastric cancer patients suffer from malnutrition beca- use of esophagitis or because of dumping syn-drome and cachexia from the cancer itself and the impact of the gastrectomy. Researchers believe that nutritional improvements can lead to weight gain in patients with gastric cancer undergoing gastrectomy and may lengthen sur-vival [17]. In addition, hormonal changes after gastrectomy should be noted. Patients under-going gastrectomy commonly have impaired ghrelin production, which secretes growth hor-mones, increases food intake, and causes weight gain [23, 24]. In our study, although we did not find a significant relationship between postoperative BMI, change in BMI and DFS, the trends are shown in Figures 5 and 6; specifi -cally, the high BMI group and increased BMI group showed better disease-free survival after surgery. Therefore, post-gastrectomy patients should be supported with nutritional supple- mentation.
follow-up time, the overall median DFS was not reached, and thus we cannot discuss the rela-tionship between BMI and OS.
In conclusion, BMI, both after surgery and BMI change, was not a prognostic factor for DFS in patients with gastric cancer undergoing radical operation. However, before surgery, normal BMI significantly predicted the higher DFS of patients with gastric cancer compared with the high BMI. In addition, for low BMI patients, ade-quate nutritional support should be considered after surgery.
Disclosure of conflict of interest
None.
Address correspondence to: Guanghai Dai, Depart- ment of Oncology, Chinese People’s Liberation Army General Hospital, Beijing, China. E-mail: daigh60@ sohu.com
References
[1] Yan S, Li B, Bai ZZ, Wu JQ, Xie DW, Ma YC, Ma XX, Zhao JH and Guo XJ. Clinical epidemiology of gastric cancer in Hehuang valley of China: a 10-year epidemiological study of gastric can-cer. World J Gastroenterol 2014; 20: 10486-10494.
[2] Yang L. Incidence and mortality of gastric can-cer in China. World J Gastroenterol 2006; 12: 17-20.
[3] Ejaz A, Spolverato G, Kim Y, Poultsides GA, Fields RC, Bloomston M, Cho CS, Votanopoulos K, Maithel SK and Pawlik TM. Impact of body mass index on perioperative outcomes and survival after resection for gastric cancer. J Surg Res 2015; 195: 74-82.
[4] WHO Expert Consultation. Appropriate body-mass index for Asian populations and its impli-cations for policy and intervention strategies. Lancet 2004; 363: 157-163.
[5] Amri R, Bordeianou LG, Sylla P and Berger DL. Obesity, outcomes and quality of care: body mass index increases the risk of wound-relat-ed complications in colon cancer surgery. Am J Surg 2014; 207: 17-23.
[6] Balentine CJ, Wilks J, Robinson C, Marshall C, Anaya D, Albo D and Berger DH. Obesity in -creases wound complications in rectal cancer surgery. J Surg Res 2010; 163: 35-39.
[7] Santoso JT, Barton G, Riedley-Malone S and Wan JY. Obesity and perioperative outcomes in endometrial cancer surgery. Arch Gynecol Ob-stet 2012; 285: 1139-1144.
[8] Tsai S, Choti MA, Assumpcao L, Cameron JL, Gleisner AL, Herman JM, Eckhauser F, Edil BH, Schulick RD, Wolfgang CL and Pawlik TM. Im-pact of obesity on perioperative outcomes and survival following pancreaticoduodenectomy for pancreatic cancer: a large single-institution study. J Gastrointest Surg 2010; 14: 1143-1150.
[9] Bhayani NH, Hyder O, Frederick W, Schulick RD, Wolgang CL, Hirose K, Edil B, Herman JM, Choti MA and Pawlik TM. Effect of metabolic syndrome on perioperative outcomes after liv-er surgliv-ery: a National Surgical Quality Improve-ment Program (NSQIP) analysis. Surgery 2012; 152: 218-226.
[10] Siegel AB, Lim EA, Wang S, Brubaker W, Rodri-guez RD, Goyal A, Jacobson JS, Hershman DL, Verna EC, Zaretsky J, Halazun K, Dove L, Brown RS Jr, Neugut AI, Kato T, Remotti H, Coppleson YJ and Emond JC. Diabetes, body mass index, and outcomes in hepatocellular carcinoma pa-tients undergoing liver transplantation. Trans-plantation 2012; 94: 539-543.
[11] Marrelli D, Morgagni P, de Manzoni G, Coniglio A, Marchet A, Saragoni L, Tiberio G, Roviello F; Italian Research Group for Gastric Cancer (IRG-GC). Prognostic value of the 7th AJCC/UICC TNM classification of noncardia gastric cancer: analysis of a large series from specialized Western centers. Ann Surg 2012; 255: 486-491.
[12] Adams KF, Schatzkin A, Harris TB, Kipnis V, Mouw T, Ballard-Barbash R, Hollenbeck A and Leitzmann MF. Overweight, obesity, and mor-tality in a large prospective cohort of persons 50 to 71 years old. N Engl J Med 2006; 355: 763-778.
[13] Lin XJ, Wang CP, Liu XD, Yan KK, Li S, Bao HH, Zhao LY and Liu X. Body mass index and risk of gastric cancer: a meta-analysis. Jpn J Clin On-col 2014; 44: 783-791.
[14] Kroenke CH, Chen WY, Rosner B and Holmes MD. Weight, weight gain, and survival after breast cancer diagnosis. J Clin Oncol 2005; 23: 1370-1378.
[15] Freedland SJ and Platz EA. Obesity and pros-tate cancer: making sense out of apparently conflicting data. Epidemiol Rev 2007; 29: 88-97.
[16] Sinicrope FA, Foster NR, Sargent DJ, O’Connell MJ and Rankin C. Obesity is an independent prognostic variable in colon cancer survivors. Clin Cancer Res 2010; 16: 1884-1893. [17] Lee HH, Park JM, Song KY, Choi MG and Park
[18] Meyerhardt JA, Catalano PJ, Haller DG, Mayer RJ, Benson AB 3rd, Macdonald JS and Fuchs CS. Influence of body mass index on outcomes and treatment-related toxicity in patients with colon carcinoma. Cancer 2003; 98: 484-495. [19] Dhar DK, Kubota H, Tachibana M, Kotoh T,
Tabara H, Masunaga R, Kohno H and Nagasue N. Body mass index determines the success of lymph node dissection and predicts the out-come of gastric carcinoma patients. Oncology 2000; 59: 18-23.
[20] Bickenbach KA, Denton B, Gonen M, Brennan MF, Coit DG and Strong VE. Impact of obesity on perioperative complications and long-term survival of patients with gastric cancer. Ann Surg Oncol 2013; 20: 780-787.
[21] Chen HN, Chen XZ, Zhang WH, Yang K, Chen XL, Zhang B, Chen ZX, Chen JP, Zhou ZG and Hu JK. The impact of body mass index on the surgical outcomes of patients with gastric can-cer: a 10-year, Single-Institution Cohort Study. Medicine (Baltimore) 2015; 94: e1769.
[22] Mullen JT, Moorman DW and Davenport DL. The obesity paradox: body mass index and out-comes in patients undergoing nonbariatric general surgery. Ann Surg 2009; 250: 166-172.
[23] Takaya K, Ariyasu H, Kanamoto N, Iwakura H, Yoshimoto A, Harada M, Mori K, Komatsu Y, Usui T, Shimatsu A, Ogawa Y, Hosoda K, Aka -mizu T, Kojima M, Kangawa K and Nakao K. Ghrelin strongly stimulates growth hormone release in humans. J Clin Endocrinol Metab 2000; 85: 4908-4911.