Abstract
Traditionally and in order to predict market movement, investors used to analyze the stock prices and stock indicators in addition to the news related to these stocks. Hence, the importance of news on the stock price movement. Most of the previous work in this industry focused on either classifying the released market news as (positive, negative, neutral) and demonstrating their effect on the stock price or focused on the historical price movement and predicted their future movement. In this work, we propose an automated trading system that integrates mathematical functions, machine learning, and other external factors such as news’ sentiments for the purpose of achieving better stock prediction accuracy and issuing profitable trades. Particularly, we aim to determine the price or the trend of a certain stock for the coming end-of-day considering the first several trading hours of the day. To achieve this goal, we trained traditional machine learning algorithms and created/trained multiple deep learning models taking into consideration the importance of the relevant news. Various experiments were conducted, the highest accuracy (82.91%) of which was achieved using SVM for Apple Inc. (AAPL) stock
1
Introduction
The financial market is a dynamic and composite system where people can buy and sell currencies, stocks, equities and derivatives over virtual platforms supported by brokers. The stock market allows investors to own shares of public companies through trading either by exchange or over-the-counter markets. This market has given investors the chance of gaining money and having a prosperous life through investing small initial amounts of money, low risk compared to the risk
of opening new business or the need of high salary career (Investopedia, July 2008). Stock markets are affected by many factors causing the uncertainty and high volatility in the market.
Although humans can take orders and submit them to the market, automated trading systems (ATS) that are operated by the implementation of computer programs can perform better and with higher momentum in submitting orders than any human. However, to evaluate and control the performance of ATSs, the implementation of risk strategies and safety measures applied based on human judgements are required. Many factors are incorporated and considered when developing an ATS, for instance, trading strategy to be adopted, complex mathematical functions that reflect the state of a specific stock, machine learning algorithms that enable the prediction of the future stock value, and specific news related to the stock being analyzed.
Several studies have been done on the topic of predicting stock price trends mainly for a daily timeframe, where models have been built integrating different sources of data such as news articles, twitter data, google and Wikipedia data. All these external factors when integrated with stock prices and stock technical indicators have shown the effect on stock price movements.
The stock market is considered a volatile market due to the external factors affecting its movements, dynamicity of the market and complexity of dimensionality which makes the prediction task of the trend/price of the stock a difficult and challenging task even with deep learning models (Singh, Aishwarya 2019). These external factors can be grouped into fundamental factors, technical factors and market sentiments as follows:
Supply and demand. For example, if traders tend to buy this stock more than selling it, this will affect the price probably by rising since the demand will be more than the supply.
Automated Stock Price Prediction Using Machine Learning
Mariam Moukalled Wassim El-Hajj Mohamad Jaber
Computer Science Department
American University of Beirut
Stock prices can have unexpected moves because of a single news which keeps a stock artificially high or low. Hence, investors cannot predict what will happen with a stock on a day-to-day basis. This is called market sentiment factors and they include company news, economy, and world events.
Global economy. The flow of money and transactions is based on the economy of the traders which is affected by the economy of the country.
Stock historical prices. Each stock has a range which tick data moves within, when looking into chart patterns and behavior of investors. Public sentiments and social media. A tweet
from a president or an article release affects the price of the related stock(s). For example, an unofficial resignation of a CEO on twitter. Natural disasters. For example, the “haiti earthquake” that killed around 316,000 people affected the S&P index by going down 6.6% after 18 trading days.
Earnings per share (EPS) is a fundamental factor that affects stock price. Investors tend to purchase stocks with high EPS since they know that they will gain substantial profits. The demand on this stock, the company management, the market sector dominance and the cyclical industry performance result in the movement of the stock price.
Inflation and deflation are technical factors. Inflation means higher buy price and thus higher interest rates. This will result in a decrease of stock price. On the contrary, deflation means lower buy prices and thus lower profits and interest rate.
All these diverse factors and others affect price movements, leading to a difficulty in stock prediction. Researchers assume that market prediction does not exhibit random behavior (Schumaker, R. et al. 2009). Many publications have been done on the topic attempting to increase the accuracy of future price predictions. Mark L. et al. (1994) studied the influence of public information reported by Dow Jones and concluded that a direct relation does exists between released news articles and stock market activities.
News released related to an activity of a company results in assumptions for traders that will affect price movement. For instance, when positive news is released, traders tend to buy resulting in stock price increase. On the contrary, when negative news is released, traders tend to sell
and thus pushing stock price to decrease. Although there is no doubt that news affect traders’ actions, only few studies use the news factor in predicting price movement.
Different machine learning algorithms can be applied on stock market data to predict future stock price movements, in this study we applied different AI techniques using market and news data. This paper is arranged as follows. Section 2 provides literature review on stock market prediction. Section 3 details the data collection process, data +cleaning, and the ML models’ design. Section 4 provides the experimental results, and section 5 concludes the paper and presents future work.
2
Related work and background
In the early research related to stock market prediction, Fama, E. F. (1970) proposed the Efficient Market Hypothesis (EMH) and Horne, J. C., & Parker, G. G. (1967) proposed the Random Walk theory. These theories proposed that market prices are affected by information other than historical prices and thus market price cannot be predicted.
The EMH theory suggests that the price of a stock depends completely on market information and thus any new information will lead to a price change as a reaction of the newly released information. This theory also claimed that stocks are always traded on their fair value, where traders cannot buy nor sell stocks in a special price undervalued or inflated and therefore the only way a trader can increase her profits is by increasing her risk. EMH discusses three different variations that affect market price: Weak Form, where only historical data is considered, semi- Strong Form, which incorporates current public data in addition to historical data, and Strong Form, which goes farther to incorporate private data. EMH states that any price movement is either a result of new released information or a random move that would prevent prediction models from success.
The Random Walk Hypothesis by Horne, J. C., & Parker, G. G. (1967) states that the stock prices are randomly changed and argue that past price movements are independent of current movements. This is slightly different from EMH as it focuses on short-term pattern of stock market.
accuracy of predicting such movement cannot exceeds 50%.
As opposed to these theories, many recent studies have shown that stock market price movement can be predicted to some degree. These studies depend on two different types of financial analysis to predict stock market prices:
Fundamental Analysis: it is based on the health of the company and this includes qualitative and quantitative factors such as interest rate, return on assets, revenues, expenses and price to earnings among others. The aim of this analysis is to check the long-term sustainability and strength of the company for the purpose of long-term investment.
Technical analysis: It is based on time series data. Traders analyze historical price movements and chart patterns and consider time as a crucial parameter in the prediction. Technical analysis can rely on three main keys: stock prices movement although many times the movement seems to be random, historical trends which are assumed to repeat as time passes, and all relevant information about a stock.
In most recent studies, different machine learning techniques have been used to predict stock prices. Machine learning was proven to be a good tool used in price predictions tasks due to the techniques it uses in analyzing data to drawing generalized pattern. Different machine learning models and risk strategies have been applied to stock market prediction task trying to predict mainly the direction of the price for different time frames and using different features that would affect market prices.
Arévalo, A. et al. (2016) used four main features as input to a Depp Neural Network (DNN) model. These features can be considered as technical analysis features for the stock market as they are based on mathematical calculations as described below:
Log return: a finance term that represents the logarithmic difference between the close price at time t and close price at time t-1 Pseudo-log-return: the logarithmic difference
between average prices of consecutive minutes
Trend Indicator: a linear model applied on 1-minute tick data to generate a linear equation with a certain slope. A negative slope implies a decrease in the price while a positive slope
implies an increase and a slope close to zero implies that the price is almost stable.
Arévalo, A. et al. 2016 formalize the input data as follows: the time feature which is included in the inputs as minutes and hours parameters, and a variable window size (n) which is used for the other inputs. Thus, the input file will include last n pseudo-log-return, last n standard deviations and last n trend indicators. The output of the model was “next one-minute pseudo-log-ret. Then after having the input data file ready, it was given to a DNN with one input layer, five hidden layers and one output layer. The data was fragmented into training and testing data. The model was trained during 50 epochs with different window sizes and the results show that window size 3 can show the best performance of the model with accuracy 66% and 0.07 MSE.
prediction accuracy with around 85% using SVM model.
Schumaker, R. P. et al. (2009) tried to predict direction of the price movement based on financial news. The study was done in 2009 as market prediction was and still facing difficulties due to the ill-defined parameters. In order to use the financial news articles in the prediction model, news should be represented as numerical value. Several techniques have been known to analyze articles related to certain stock to label these articles with sentiments or use them as vectors for the input features. These techniques could be bag of words, noun phrases, named entities and proper nouns. Proper noun technique is a combination of noun phrases and named entities. The proposed technique outperformed other techniques based on a comparison study.
AZFin Text is another system built by (Schumaker, R. P. et al 2009) that predicts price changes after 20 minutes of news release. The main component of this system is the financial news articles collected from yahoo finance and represented as noun phrases; all the collected noun phrases are represented as vector of binary values indicating the presence or absence of a phrase in the article. The second main component of this system is the stock price data collected in one-minute time frame. Then, the final major task after collecting the data and formalizing the inputs was building and training the AI model. To finalize the input of the model, stock price quotation at the same minute news was released, have been added to the input matrix, in addition to that +20 minutes price which will be the output of the system. The data was then fed to different models. Support Vector Regression (SVR) model was built to predict the price after 20 minutes of news release. Only the data during market time was included leaving 1 hour for opening of the market to show the effect of news released during the closure of the market. Moreover, a new constraint was added to the model where only one article could be used for 20 minutes. If two articles were released during the same 20-minute period, both will be discarded. The results show that the average directional accuracy established was 71.18%.
It is evident that released news and published articles affect the market. Most of the existing studies analyzing news rely on shallow features such as bag-of-words, named entities and noun phrases. A newer representation was introduced by
(Ding, X. et al. 2014) which represents news as structured events to predict the daily stock price movement. Unlike the previous approaches, this representation can show the relation between events since representing phrases as vectors or bag of words cannot show the actor, action, and the actor which the action was applied on, thus trivial representations cannot show the relation between event and stock. To evaluate the performance of this new representation, news articles data were collected from Reuters and Bloomberg, in addition to the daily close prices of S&P index.
Two different models were built to test the representation: a linear SVM model which have news document as input and +1 or -1 as output indicating increase or decrease in the price for different time frames (1 day, 1 week and 1 month). A non-linear Deep neural network model is also implemented to learn hidden relations between events.
Input features for both linear and nonlinear models were the same: bag-of-words features which use the trivial TFIDF representation after removing stop words and event features represented by different combination of the tuple (𝑜1, P, 𝑜2, 𝑜1+ P, P +𝑜2, 𝑜1+ P + 𝑜2 ) where 𝑜1 is the first object to the left of extracted sentence above and 𝑜2 is the nearest object to the right, and P represents the verb. This feature representation is used to reduce the sparseness of the representation in addition to verb classes.
To evaluate the models, different scenarios were applied. When comparing the results of the models with the bag-of-words articles representation, structured events showed a better performance. From another perspective, when comparing the models, DNN performed better than SVM due to its ability to learn hidden relationships. Moreover, it was distinguished from different timeframes used (1 day, 1 week, 1 month); the shorter the frame the better the results. Thus, the best model was DNN with structured event features for daily prediction with accuracy around 60%.
3
Proposed Method
The proposed approach is divided into multiple steps, each detailed in this section as follows: Section 3.1 describes the information sources that we have used to build our system. Section 3.2 presents the processing of the data sources. Section 3.3 presents the way news and prices were aligned. Section 3.4 presents the input features. Section 3.5 shows the way data was normalized, and section 3.6 discusses the proposed models.
3.1 Data Sources
Two sources of information are needed for our study: (1) news sentiments and (2) historical prices. Ten years tick data and news data were collected from Reuters platform from January-01-2008 to December 31-2017 for five different stocks AAPL for shared of apple company, GOOGL for google shares, AMZN for amazon shares, FB for Facebook shares. Hence, a tick is a measure of the minimum upward or downward movement in the price. In many cases, a one second timeframe includes many ticks reaching 20 to 30 ticks.
Tick data was collected to include the following details: open bid, close bid, high bid, and low bid, in addition to the time stamp. This high frequency data is collected to do intra-day short-term prediction. Our model requires at least one tick to be released every 1 hour, since we group our data hourly. This huge data requires some preprocessing that takes into consideration the big volume of data (7 trading hours * 3600 = 25200 tick price per day) and the difference in interval between tick data. Tick data might have multiple prices released at the same second and miss some ticks at other seconds. In addition to tick data, we have collected news sentiments. News data includes the stock symbol, date and time issued, source, news headline, sentiment (0 for neutral news, 1 for positive news and -1 for negative news), polarity of negative sentiment, polarity of positive sentiment and polarity of neutral sentiment. The polarity of news is based on the count of positive/negative words in the news article.
3.2 Data Preprocessing
Due to the huge amount of Tick data and to ease the manipulation of data, we have imported our data to MySQL database where sorting data is done when querying.
The initial step was to replace missing ticks. Tick data have different time intervals in the data collected between ticks. This is due to data not being recorded over some time. For example, a second might have four prices recorded and other seconds might not have even one price recorded. To fill missing ticks, we look for the nearest tick data to fill our missing seconds. After importing data to our database and fill missing ticks, we group our data into one-minute time interval where we get the last tick received for each minute recorded in our data. Then, we store clean one-minute data in a new table (no weekends, no ticks outside market open time).
3.3 Aligning news with tick data
Unlike other approaches that filter news outside trading hours and news released during the same interval, we built different scenarios to handle these cases. When generating our data, we give the user an option to choose between one of the following three news scenarios:
1. Last sentiment received on that day based on time to be used: for example, if we want to get the sentiment for 01-03-2010 at 14:00 we, get the last sentiment received on 01-03-2010 before 14:00 and adopt it. If no sentiments exist, we consider the sentiment as neutral. 2. Last sentiment during selected interval of
time: if we are grouping our data into hourly time frame, we check the last sentiment released during this hour and consider it as dominant sentiment and if no news released, we consider the sentiment is neutral.
3. Overall average for the day during selected interval: if more than one sentiment is released during the time frame, we calculate the average for positive (𝑎𝑝), negative (𝑎𝑛) and neutral (𝑎𝑛𝑢) news (i.e:
𝑎𝑝= 𝑠𝑢𝑚(𝑝𝑜𝑠𝑖𝑡𝑖𝑣𝑒 𝑛𝑒𝑤𝑠)
𝑐𝑜𝑢𝑛𝑡(𝑎𝑙𝑙 𝑛𝑒𝑤𝑠) ⁄
on hour interval. As such, the input to the machine learning algorithm will be hour data features with one sentiment feature based on one of the above scenarios and the output of the trained model will be the close price of the day.
3.4 Features Generation
Different window sizes have been tested in our models, i.e. how many hours you want to go back when you want to train the models. This will generate our input data in the following format (window size * features).
The features used in our models are as follows: Maximum: Maximum price received during
the selected hour
Minimum: Minimum price received during the selected hour
Average: Average price received during the selected hour
Standard Deviation: Standard deviation of prices received during the selected hour
√1
𝑁∑(𝑥𝑖− ∑ 𝑝𝑖 𝑐𝑜𝑢𝑛𝑡(𝑝𝑖)
)2 𝑁
𝑖=1
Pseudo Log Return: logarithmic difference between average prices of two consecutive hours.
ln ( 𝑝𝑡
𝑝𝑡−1)
where 𝑝𝑡 𝑖𝑠 𝑡ℎ𝑒 𝑎𝑣𝑒𝑟𝑎𝑔𝑒 𝑝𝑟𝑖𝑐𝑒 𝑎𝑡 𝑡𝑖𝑚𝑒 𝑡
Trend indicator: slope of linear model applied on tick data of the respective hour, which gives an idea about the trend during the last hour.
Price: Last tick received at selected hour Sentiment: News sentiment analysis
calculated based on chosen scenario illustrated in section 3.3.
Hence, our input data have 8 features, the formula of number of features is the following:
Features=8n where n is window size The output of our model is end of day price.
3.5 Data Normalization
Since the features extracted from the input data are of different units and scale, normalization is needed to scale the data between 0 and 1, which will also help in faster convergence. To normalize our data, we use the minmaxscaler function provided by scikit-learn framework. This function gets the max and the min values of each column and performs the following formula:
𝑥𝑖− min(𝑥) max(𝑥) − min(𝑥)
Next, we experiment with various models, namely: Recurrent neural network, Deep neural Network, Support vector Machine and Support vector Regression.
3.6 Models
In this section, we trained different models and compared the effectiveness of recurrent neural network (RNN), feed forward neural network (FFNN), support vector machines (SVM) and support vector regression (SVR) in predicting the direction of today close price with respect to yesterday close price based on the features presented in section 3.4. We tested with the following stocks: AAPL, GOOGL, AMZN and FB for the data collected over 10 years.
For each model, we tried different combinations of window sizes and sentiment scenarios. Window size is a variable, which decides the different number of trading hours during the day; to train our model, we generate data for day d based on first {4,5,6} trading hours of the day. The data was normalized and split into two sets: training data of 90% and testing data of 10% for RNN, SVM and SVR models. However, for FFNN we applied the same structure presented in (Arévalo, A. et al. 2016) without data normalization and two data sets: training of 85% and testing of 15%.
necessary to search parameters for gradient descent manually and is robust to large gradients and noise. RNN is used for sequence data and differs from DNN by its ability to keep data from previous steps. The memory of RNN could be represented by different cell types: Vanilla RNN (for short term memory), LSTM and GRU (enhance short-term memory of Vanilla RNN using gates mechanism).
In our RNN model, we have tried different network structures with different number of neurons at each layer. We tried different network structure through varying the number of layers between 3 and 7 while varying the number of neurons at each layer between 250 and 5 neurons. We tested the implemented networks to get the best results for -layers and 4-layers networks.
We have trained and tested this model on training and testing datasets generated after normalization. The output is the actual price at end of day. Moreover, we have tried different RNN cells provided by TensorFlow. We trained our model on Basic RNN cell, LSTM cell and GRU cell. We trained the model for 100 epochs and applied ADAMOptimizer as our optimization algorithm to get the best learning rate for our model.
SVM, a supervised machine learning algorithm, can be used for both regression and classification problems. This algorithm uses a kernel trick technique that transforms the data and then finds the optimal boundary between outputs. Moreover, SVM shows that it can perform well on non-linear dataset problems, based on the kernel we choose in training SVM model. SVM have been widely used for stock market prediction. In our SVM model, we have tried different kernel algorithms tuning parameters for each model: Linear, Polynomial and RBF. We have trained and tested this model on our training and testing datasets generated. The output is the binary value, 0 when yesterday close price goes down with respect to today close price and 1 when the price goes up. We used scikit-learn library to build this model and we have trained the model and applied GridSearchCV to choose the best parameters to fit our model.
SVR is the same as SVM, however it is used for regression instead of classification. It uses same terms and functionalities as SVM to predict continuous value. In this model, we follow the same process of SVM except for the output, which is not a class, rather end-of-day price.
4
Results and Discussion
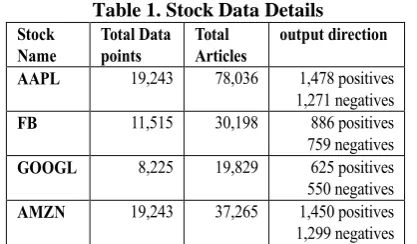
In this section, we show the results obtained for the models defined in section 3.6 on the various stocks. The evaluation metrics are (1) directional accuracy, which analyzes the direction of the predicted value with respect to yesterday close price, (2) Precision, which measures the relevancy of the result, (3) Recall, which measures how many true relevant results returned, and (4) F-measure, which measures the weighted average of precision and recall. Based on the directional accuracy metric (table 2), SVM outperforms RNN, SVR and DNN for different tested stocks. In table 1. We describe the input data.
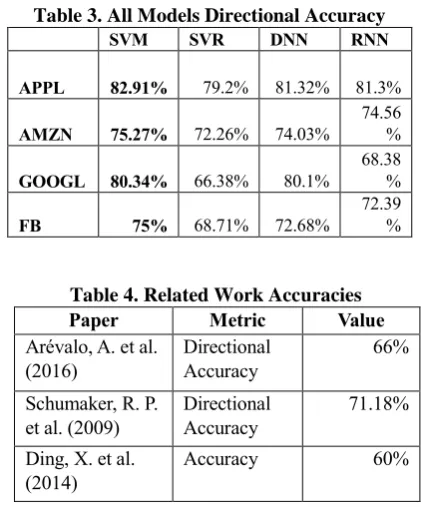
[image:7.595.312.521.279.401.2]According to Table 2, it is very clear that our SVM model is able to achieve accuracies way above the 50%. When looking at Table 3, it also clear that SVM outperforms SVR, DNN, and RNN. All achieved accuracies are above 75% and in the case
Table 1. Stock Data Details
Stock Name
Total Data points
Total Articles
output direction
AAPL 19,243 78,036 1,478 positives 1,271 negatives
FB 11,515 30,198 886 positives
759 negatives
GOOGL 8,225 19,829 625 positives
550 negatives
AMZN 19,243 37,265 1,450 positives 1,299 negatives
Table 2. SVM Directional Accuracy Results
Sentim ent-Windo w
Directional Accuracy
AAPL GOOG
L
AMZN FB
S1-4 78.18% 70.94% 75.27
%
68.9%
S1-5 83.36% 80.34% 74.91
%
73.17%
S1-6 81.73% 79.62% 65.82
%
74.66%
S2-4 79.27% 70.94% 74.18
%
73.17%
S2-5 82.64% 77.78% 74.18
%
74.01%
S2-6 81.09% 79.76% 68.36
%
73.27%
S3-4 79.27% 70.09% 75.64
%
75%
S3-5 82.91% 76.92% 70.18
%
73.78%
S3-6 81.64% 76.62% 68.73
%
[image:7.595.315.519.426.675.2]of APPL, the achieved accuracy is around 83%. All our models achieved better results than those reported in literature as indicated in Table 4.
Based on the reported results, we summarize our contributions as follows:
We highlighted the effect of news sentiments on the stock price movement
We identified best time interval for stock price prediction.
We identified best news scenario and that each stock is affected differently by news. Our model analysis indicates that close price
or trend with respect to yesterday close price can be predicted using various AI models. Our proposed model can be used in different
ways. Firstly, our model can be used by traders without programing information. These traders can use our model either to only predict the variation in price and help traders in their analysis. Also they can use our automated trading system without any monitoring, where the system opens and closes trades based on the predictions. Finally, our code can be easily deployed to do short-term trading.
5
Conclusion and Future Work
In this paper, we developed a stock price trend prediction system. To build these models we have gathered data from two sources (i) Historical stock market data from Reuters and (ii) news sentiment
released on a certain stock; this data was collected for 4 different stocks over 10 years. Technical features have been calculated and used as input data for our model in addition to 3 scenarios considered when adding sentiments to the calculated features. Our AI framework mainly incorporate DNN, RNN, SVR and SVM for prediction. We tested our proposed prediction model on APPL, AMZN, GOOGL and FB stock shares, for the data collected from (January 1, 2008 to December 31,2017), resulting in a 82.91% accuracy. According to our knowledge, this is the best accuracy achieved in literature so far.
After developing our model, and to show its performance we would implement a risk strategy to check the profits we would gain based on our predictions and a few enhancements can be done and studied for our prediction model. One direction is to add extra technical indicators used in stock market. Another direction would be trying different time-frames for grouping our data. Finally, we could try to enhance the prediction of the exact price.
References
Weng, B., Ahmed, M. A., & Megahed, F. M. (2017). Stock market one-day ahead movement prediction using disparate data sources. Expert Systems with
Applications,79, 153-163.
doi:10.1016/j.eswa.2017.02.041
Li, X., Huang, X., Deng, X., & Zhu, S. (2014). Enhancing quantitative intra-day stock return prediction by integrating both market news and stock prices information. Neurocomputing, 142, 228-238. doi:10.1016/j.neucom.2014.04.043 Arévalo, A., Niño, J., Hernández, G., & Sandoval, J.
(2016). High-Frequency Trading Strategy Based on Deep Neural Networks. Intelligent Computing Methodologies Lecture Notes in Computer Science, 424436. doi:10.1007/978-3-319-42297-8_40 Horne, J. C., & Parker, G. G. (1967). The
Random-Walk Theory: An Empirical Test. Financial Analysts Journal, 23(6), 87-92. doi:10.2469/faj.v23.n6.87 Fama, E. F. (1970). Efficient Capital Markets: A
Review of Theory and Empirical Work. The Journal of Finance, 25(2), 383. doi:10.2307/2325486 Schumaker, R. P., & Chen, H. (2009). A quantitative
stock prediction system based on financial news. Information Processing & Management, 45(5), 571-583. doi:10.1016/j.ipm.2009.05.001
[image:8.595.71.282.419.673.2]Ding, X., Zhang, Y., Liu, T., & Duan, J. (2014). Using Structured Events to Predict Stock Price Movement: An Empirical Investigation. Proceedings of the
Table 3. All Models Directional Accuracy
SVM SVR DNN RNN
APPL 82.91% 79.2% 81.32% 81.3%
AMZN 75.27% 72.26% 74.03%
74.56 %
GOOGL 80.34% 66.38% 80.1%
68.38 %
FB 75% 68.71% 72.68%
72.39 %
Table 4. Related Work Accuracies
Paper Metric Value
Arévalo, A. et al. (2016)
Directional Accuracy
66%
Schumaker, R. P. et al. (2009)
Directional Accuracy
71.18%
Ding, X. et al. (2014)
2014 Conference on Empirical Methods in Natural
Language Processing (EMNLP).
doi:10.3115/v1/d14-1148
Schumaker, R. P., & Chen, H. (2009). A quantitative stock prediction system based on financial news. Information Processing & Management, 45(5), 571-583. doi:10.1016/j.ipm.2009.05.001
Bollen, J., & Mao, H. (2011). Twitter Mood as a Stock Market Predictor. Computer,44(10), 91-94. doi:10.1109/mc.2011.323
Arora, A., et al.: Deep Learning with H2O (2015) learning process 20. Zeiler, M.D.: ADADELTA: An
Adaptive Learning Rate Method, 6 (2012)
learning process 20. Zeiler, M.D.: ADADELTA: An Adaptive Learning Rate Method, 6 (2012)
Investopedia. “World's Greatest Investors.” Investopedia, Investopedia, 9 July 2008,
www.investopedia.com/slide-show/worlds-greatest-investors/.
Singh, Aishwarya. “Predicting the Stock Market Using Machine Learning and Deep Learning.” Analytics
Vidhya, 26 July 2019,
www.analyticsvidhya.com/blog/2018/10/predicting -stock-price-machine-learningnd-deep-learning-techniques-python/.