ParFDA for Instance Selection for Statistical Machine Translation
Ergun Bic¸ici
[email protected] bicici.github.com
Abstract
We build parallel feature decay algorithms (ParFDA) Moses statistical machine trans-lation (SMT) systems for all language pairs in the translation task at the first conference on statistical machine trans-lation (Bojar et al., 2016a) (WMT16). ParFDA obtains results close to the top constrained phrase-based SMT with an average of 2.52 BLEU points difference using significantly less computation for building SMT systems than the computa-tion that would be spent using all avail-able corpora. We obtain BLEU bounds based on target coverage and show that ParFDA results can be improved by12.6 BLEU points on average. Similar bounds show that top constrained SMT results at WMT16 can be improved by 8 BLEU points on average while German to En-glish and Romanian to EnEn-glish trans-lations results are already close to the bounds.
1 ParFDA
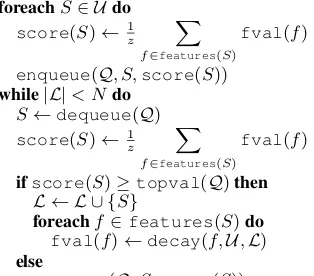
ParFDA (Bic¸ici et al., 2015) is a parallel imple-mentation of feature decay algorithms (FDA), a class of instance selection algorithms that use fea-ture decay, developed for fast deployment of accu-rate SMT systems. We use ParFDA for selecting parallel training data and language model (LM) data for building SMT systems. ParFDA runs sep-arate FDA5 (Bic¸ici and Yuret, 2015) models on randomized subsets of the available data and com-bines the selections afterwards. ParFDA allows rapid prototyping of SMT systems for a given tar-get domain or task. FDA pseudocode is in Fig-ure 1. This year, we have kept record of which 1-gram or 2-1-grams of the test set have already been
foreachS∈ Udo
score(S)←1
z
X
f∈features(S)
fval(f)
enqueue(Q, S,score(S))
while|L|< Ndo
S←dequeue(Q) score(S)←1
z
X
f∈features(S)
fval(f)
ifscore(S)≥topval(Q)then
L ← L ∪ {S}
foreachf∈features(S)do
fval(f)←decay(f,U,L)
else
[image:1.595.319.476.226.364.2]enqueue(Q, S,score(S))
Figure 1: The Feature Decay Algorithm: in-puts are a sentence pool U, test set features
F, and number of instances to selectN and a priority queueQ stores sentence, S, scores
scorethat sums feature valuesfval.
included to include an instance if otherwise found and we also use numeric expression identification using regular expressions to replace them with a label (Bic¸ici, 2016) before instance selection.
We run ParFDA SMT experiments using Moses (Koehn et al., 2007) for all language pairs in both directions in the WMT16 transla-tion task (Bojar et al., 2016a), which include English-Czech (en-cs), English-German (en-de), English-Finnish fi), English-Romanian (en-ro), English-Russian (en-ru), and English-Turkish (en-tr).
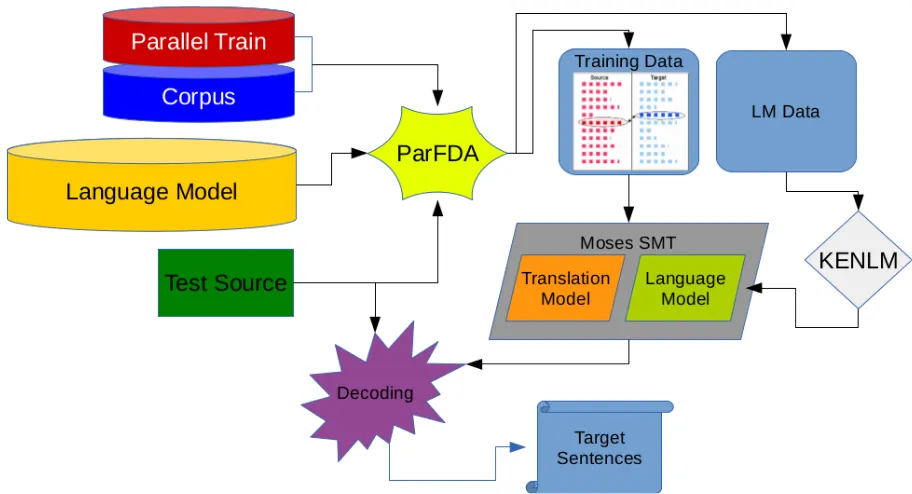
2 ParFDA Moses SMT Experiments
Figure 2: ParFDA Moses SMT workflow.
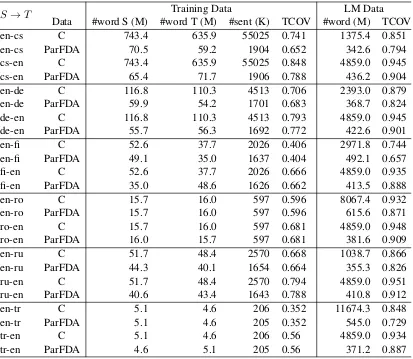
constrained (C) systems in WMT16 (Bojar et al., 2016a) as well as the statistics of the ParFDA se-lected subset training and LM data from C. TCOV lists the target coverage in terms of the2-grams of the test set. Compared with last year, this year we do not use Common Crawl parallel corpus except for en-ru. We use Common Crawl monolingual corpus fi, ro, and tr datasets and we extended the LM corpora with previous years’ corpora. We also use CzEng16pre (Bojar et al., 2016b) for en-cs.
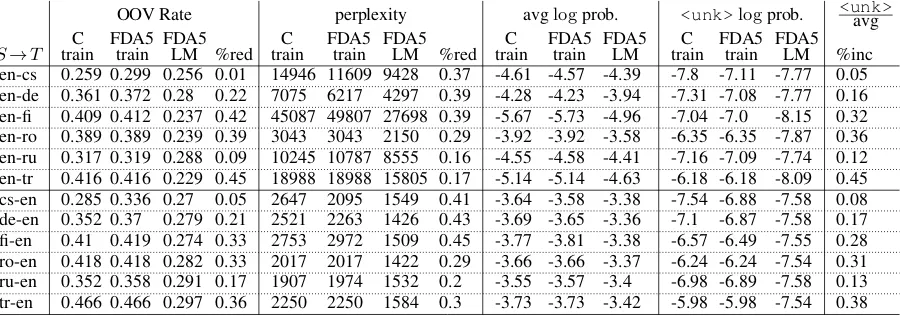
We have increased the size of the training data selected to about 1.6 million instances to help with the reduction of out-of-vocabulary items. Except for translation directions involving Romanian and Turkish, this corresponds to increased training set size compared with ParFDA experiments in 2015, where we were able to obtain the top translation error rate (TER) performance in French to En-glish translation using 1.261 million training sen-tences (Bic¸ici et al., 2015). Due to the presence of peaks in SMT performance with increasing train-ing set size (Bic¸ici and Yuret, 2015), increastrain-ing the training set size need not improve the perfor-mance. We select about15 million sentences for each LM not including the selected training set, which is added later. Table 1 shows the significant size differences between the constrained dataset (C) and the ParFDA selected data. We use3-grams for selecting training data and2-grams for LM cor-pus selection. Task specific data selection also
im-proves the LM perplexity and the performance of the selected LM can be observed in Table 4.
We truecase all of the corpora, set the maximum sentence length to126, use 150-best lists during tuning, set the LM order to6for all language pairs, and train the LM using KENLM (Heafield et al., 2013). For word alignment, we use mgiza (Gao and Vogel, 2008) where GIZA++ (Och and Ney, 2003) parameters set max-fertility to 10, the num-ber of iterations to 7,3,5,5,7 for IBM models 1,2,3,4, and the HMM model, and learn 50 word classes in three iterations with the mkcls tool dur-ing traindur-ing. The development set contains up to 3000sentences randomly sampled from previous years’ development sets (2011-2015) and remain-ing come from the development set for WMT16. ParFDA Moses SMT workflow is depicted in Fig-ure 2.
ParFDA Moses SMT results for each translation direction at WMT16 are in Table 2 using BLEU over cased text, and F1 (Bic¸ici, 2011). We com-pare ParFDA results with the top constrained sub-missions at WMT16 in Table 3.1The average dif-ference to the top constrained (TopC) submission in WMT16 is5.26BLEU points whereas the dif-ference was3.2BLEU points in WMT15 (Bic¸ici et al., 2015). Performance compared with the TopC phrase-based SMT improved over WMT15 results with2.52 BLEU points difference on
S→T Training Data LM Data
Data #word S (M) #word T (M) #sent (K) TCOV #word (M) TCOV
en-cs C 743.4 635.9 55025 0.741 1375.4 0.851
en-cs ParFDA 70.5 59.2 1904 0.652 342.6 0.794
cs-en C 743.4 635.9 55025 0.848 4859.0 0.945
cs-en ParFDA 65.4 71.7 1906 0.788 436.2 0.904
en-de C 116.8 110.3 4513 0.706 2393.0 0.879
en-de ParFDA 59.9 54.2 1701 0.683 368.7 0.824
de-en C 116.8 110.3 4513 0.793 4859.0 0.945
de-en ParFDA 55.7 56.3 1692 0.772 422.6 0.901
en-fi C 52.6 37.7 2026 0.406 2971.8 0.744
en-fi ParFDA 49.1 35.0 1637 0.404 492.1 0.657
fi-en C 52.6 37.7 2026 0.666 4859.0 0.935
fi-en ParFDA 35.0 48.6 1626 0.662 413.5 0.888
en-ro C 15.7 16.0 597 0.596 8067.4 0.932
en-ro ParFDA 15.7 16.0 597 0.596 615.6 0.871
ro-en C 15.7 16.0 597 0.681 4859.0 0.948
ro-en ParFDA 16.0 15.7 597 0.681 381.6 0.909
en-ru C 51.7 48.4 2570 0.668 1038.7 0.866
en-ru ParFDA 44.3 40.1 1654 0.664 355.3 0.826
ru-en C 51.7 48.4 2570 0.794 4859.0 0.951
ru-en ParFDA 40.6 43.4 1643 0.788 410.8 0.912
en-tr C 5.1 4.6 206 0.352 11674.3 0.848
en-tr ParFDA 5.1 4.6 205 0.352 545.0 0.729
tr-en C 5.1 4.6 206 0.56 4859.0 0.934
[image:3.595.93.506.61.420.2]tr-en ParFDA 4.6 5.1 205 0.56 371.2 0.887
Table 1: Data statistics for the available training and LM corpora in the constrained (C) setting compared with the ParFDA selected training and LM data. #words is in millions (M) and #sents in thousands (K). TCOV is target2-gram coverage.
S→en en→T
cs-en de-en fi-en ro-en ru-en tr-en en-cs en-de en-fi en-ro en-ru en-tr
BLEU 0.2641 0.3014 0.1744 0.2904 0.2525 0.1222 0.1942 0.2391 0.1248 0.2097 0.2193 0.0901
F1 0.2718 0.3067 0.2077 0.289 0.2674 0.1641 0.2169 0.2592 0.1665 0.2258 0.2363 0.1346
Table 2: ParFDA results at WMT16.
erage, which is likely due to selecting increased number of training data.
We observe that various systems in TopC used character-level split and merge operations (re-ferred as BPE or byte pair encoding) combined with neural networks (Sennrich et al., 2016). 2 We also compare ParFDA results with the TopC BPE and the average difference is 5.86 BLEU points. 3 WMT15 did not contain any submis-sion with BPE. Average difference between TopC BPE and TopC phrase hints that majority of the
in-2
For instance within en-de translation results:matrix.
statmt.org/matrix/systems_list/1840.
3Some translation directions did not contain BPE results.
creased performance difference is due to improve-ments obtained by BPE in TopC BPE results.
BLEU cs-en de-en fi-en ro-en ru-en tr-en en-cs en-de en-fi en-ro en-ru en-tr
ParFDA 0.2641 0.3014 0.1744 0.2904 0.2525 0.1222 0.1942 0.2391 0.1248 0.2097 0.2193 0.0901
TopC 0.314 0.386 0.204 0.352 0.291 0.145 0.258 0.342 0.174 0.289 0.26 0.098
- ParFDA 0.0499 0.0846 0.0296 0.0616 0.0385 0.0228 0.0638 0.1029 0.0492 0.0793 0.0407 0.0079
avg diff 0.0526
TopC BPE 0.314 0.386 0.339 0.291 0.258 0.342 0.151 0.282 0.26
- ParFDA 0.0499 0.0846 0.0486 0.0385 0.0638 0.1029 0.0262 0.0723 0.0407
avg diff 0.0586
TopC phrase 0.304 0.345 0.191 0.322 0.27 0.129 0.236 0.283 0.138 0.235 0.24 0.092
- ParFDA 0.0399 0.0436 0.0166 0.0316 0.0175 0.0068 0.0418 0.0439 0.0132 0.0253 0.0207 0.0019
avg diff 0.0252
BPE - phrase 0.01 0.041 0.017 0.021 0.022 0.059 0.013 0.047 0.02
[image:4.595.75.525.240.398.2]avg diff 0.0278
Table 3: ParFDA results compared with the top constrained results in WMT16 (TopC, frommatrix.
statmt.org) and their difference.
OOV Rate perplexity avglogprob. <unk>logprob. <unk>avg
S→T trainC FDA5train FDA5LM %red trainC FDA5train FDA5LM %red trainC FDA5train FDA5LM trainC FDA5train FDA5LM %inc
en-cs 0.259 0.299 0.256 0.01 14946 11609 9428 0.37 -4.61 -4.57 -4.39 -7.8 -7.11 -7.77 0.05
en-de 0.361 0.372 0.28 0.22 7075 6217 4297 0.39 -4.28 -4.23 -3.94 -7.31 -7.08 -7.77 0.16
en-fi 0.409 0.412 0.237 0.42 45087 49807 27698 0.39 -5.67 -5.73 -4.96 -7.04 -7.0 -8.15 0.32
en-ro 0.389 0.389 0.239 0.39 3043 3043 2150 0.29 -3.92 -3.92 -3.58 -6.35 -6.35 -7.87 0.36
en-ru 0.317 0.319 0.288 0.09 10245 10787 8555 0.16 -4.55 -4.58 -4.41 -7.16 -7.09 -7.74 0.12
en-tr 0.416 0.416 0.229 0.45 18988 18988 15805 0.17 -5.14 -5.14 -4.63 -6.18 -6.18 -8.09 0.45
cs-en 0.285 0.336 0.27 0.05 2647 2095 1549 0.41 -3.64 -3.58 -3.38 -7.54 -6.88 -7.58 0.08
de-en 0.352 0.37 0.279 0.21 2521 2263 1426 0.43 -3.69 -3.65 -3.36 -7.1 -6.87 -7.58 0.17
fi-en 0.41 0.419 0.274 0.33 2753 2972 1509 0.45 -3.77 -3.81 -3.38 -6.57 -6.49 -7.55 0.28
ro-en 0.418 0.418 0.282 0.33 2017 2017 1422 0.29 -3.66 -3.66 -3.37 -6.24 -6.24 -7.54 0.31
ru-en 0.352 0.358 0.291 0.17 1907 1974 1532 0.2 -3.55 -3.57 -3.4 -6.98 -6.89 -7.58 0.13
tr-en 0.466 0.466 0.297 0.36 2250 2250 1584 0.3 -3.73 -3.73 -3.42 -5.98 -5.98 -7.54 0.38
Table 4: Perplexity comparison of the LM built from the training corpus (train), ParFDA selected training data (FDA5 train), and the ParFDA selected LM data (FDA5 LM).%red is proportion of reduction and prob. is used for probability.
3 Translation Upper Bounds with TCOV
In this section, we obtain upper bounds on the translation performance based on the target cover-age (TCOV) ofn-grams of the test set found in the selected ParFDA training data. We obtain transla-tions based on TCOV by randomly replacing some number of tokens from a given sentence with a fixed OOV label proportional to TCOV starting from1-grams. After OOVs for1-grams are iden-tified, OOV tokens forn-grams up to5-grams are identified and BLEU is calculated with respect to the original. If the overall number of OOVs ob-tained beforei-grams are enough to obtain thei -gram TCOV, then OOV identification fori-grams is skipped. Number of OOV tokens is identified by two possible functions for a given sentenceT0:
OOVr = round((1−TCOV)∗ |T0|) (1)
OOVf = b(1−TCOV)∗ |T0|c (2)
where |T0|denotes the length of the sentence in the number of tokens.
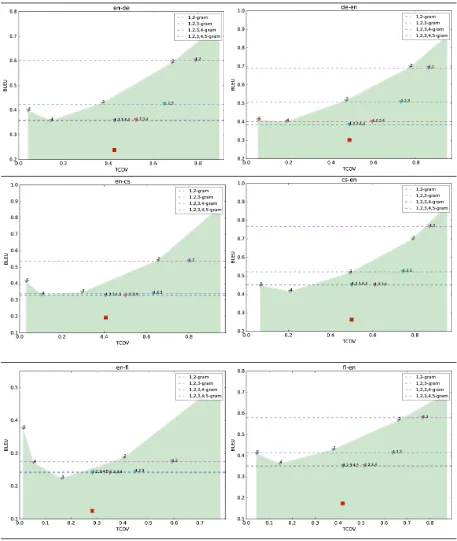
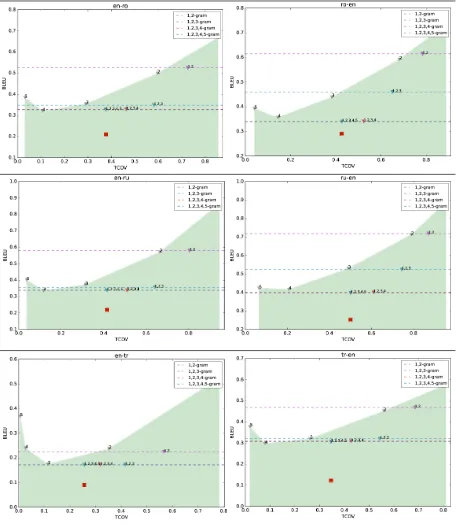
We obtain each bound using 10000 such in-stances and repeat for 10 times. This TCOV BLEU bound is optimistic since it does not con-sider reorderings in the translation or differences in sentence length. Each plot in Tables 6 and 7 locates TCOV BLEU bound obtained from each
n-gram and fromn-grams combined up to and in-cludingnandlocates the ParFDA Moses SMT performance.
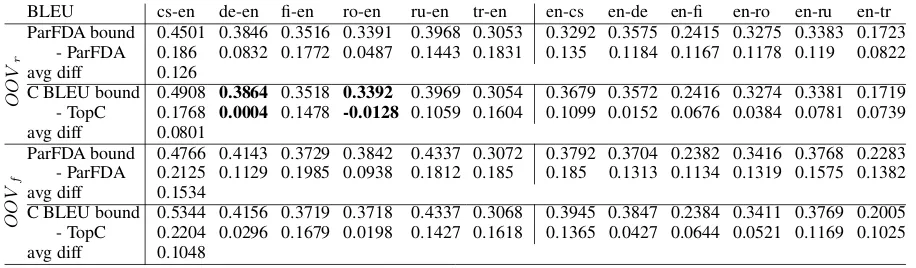
Table 5 compares TCOV BLEU bounds with ParFDA results and TopC from Table 3 and shows potential improvements in the translation perfor-mance for all translation directions at WMT16 and overall on average. Results in bold are close to
OOVrTCOV BLEU bound, which indicates that
TopC translation results for de-en and ro-en direc-tions are able to obtain results close to this bound.
4 Conclusion
over-BLEU cs-en de-en fi-en ro-en ru-en tr-en en-cs en-de en-fi en-ro en-ru en-tr
O
O
Vr
ParFDA bound 0.4501 0.3846 0.3516 0.3391 0.3968 0.3053 0.3292 0.3575 0.2415 0.3275 0.3383 0.1723
- ParFDA 0.186 0.0832 0.1772 0.0487 0.1443 0.1831 0.135 0.1184 0.1167 0.1178 0.119 0.0822
avg diff 0.126
C BLEU bound 0.4908 0.3864 0.3518 0.3392 0.3969 0.3054 0.3679 0.3572 0.2416 0.3274 0.3381 0.1719
- TopC 0.1768 0.0004 0.1478 -0.0128 0.1059 0.1604 0.1099 0.0152 0.0676 0.0384 0.0781 0.0739
avg diff 0.0801
O
O
V
f
ParFDA bound 0.4766 0.4143 0.3729 0.3842 0.4337 0.3072 0.3792 0.3704 0.2382 0.3416 0.3768 0.2283
- ParFDA 0.2125 0.1129 0.1985 0.0938 0.1812 0.185 0.185 0.1313 0.1134 0.1319 0.1575 0.1382
avg diff 0.1534
C BLEU bound 0.5344 0.4156 0.3719 0.3718 0.4337 0.3068 0.3945 0.3847 0.2384 0.3411 0.3769 0.2005
- TopC 0.2204 0.0296 0.1679 0.0198 0.1427 0.1618 0.1365 0.0427 0.0644 0.0521 0.1169 0.1025
[image:5.595.71.529.61.195.2]avg diff 0.1048
Table 5: 1,2,3,4,5-gram TCOV BLEU bounds compared with WMT16 results.boldare close to a bound.
all than the computation that would be spent us-ing all available corpora while still achieve SMT performance that is close to the top performing phrase-based SMT systems. ParFDA results at WMT16 provides new results using the current phrase-based SMT technology towards rapid SMT system development in budgeted training scenar-ios. ParFDA works towards the development of task or data adaptive SMT solutions using spe-cially moulded data rather than general purpose SMT systems built with a patchwork approach combining various sources of information and sev-eral processing steps.
We obtain BLEU bounds based on target cov-erage and show that top constrained results can be improved by 8 BLEU points on average and ob-tain results close to the bound for de-en and ro-en translation directions. Similar bounds show that ParFDA results can be improved by 12.6 BLEU points on average.
Acknowledgments
We thank the reviewers for providing constructive comments.
References
Ergun Bic¸ici and Deniz Yuret. 2015. Optimizing in-stance selection for statistical machine translation with feature decay algorithms. IEEE/ACM Transac-tions On Audio, Speech, and Language Processing (TASLP), 23:339–350.
Ergun Bic¸ici, Qun Liu, and Andy Way. 2015. ParFDA for fast deployment of accurate statistical machine translation systems, benchmarks, and statistics. In
Proc. of the EMNLP 2015 Tenth Workshop on Statis-tical Machine Translation, Lisbon, Portugal, 9. As-sociation for Computational Linguistics.
Ergun Bic¸ici. 2011. The Regression Model of Machine
Translation. Ph.D. thesis, Koc¸ University. Supervi-sor: Deniz Yuret.
Ergun Bic¸ici. 2016. RTM at SemEval-2016 task 1: Predicting semantic similarity with referen-tial translation machines and related statistics. In
SemEval-2016: Semantic Evaluation Exercises - In-ternational Workshop on Semantic Evaluation, San Diego, USA, 6.
Ondrej Bojar, Rajan Chatterjee, Christian Federmann, Barry Haddow, Chris Hokamp, Matthias Huck, Pavel Pecina, Philipp Koehn, Christof Monz, Mat-teo Negri, Matt Post, Carolina Scarton, Lucia Spe-cia, and Marco Turchi. 2015. Findings of the 2015 workshop on statistical machine translation. In
Proc. of the Tenth Workshop on Statistical Machine Translation, Lisbon, Portugal, September.
Ondrej Bojar, Christian Buck, Rajan Chatterjee, Chris-tian Federmann, Liane Guillou, Barry Haddow, Matthias Huck, Antonio Jimeno Yepes, Aurlie Nvol, Mariana Neves, Pavel Pacina, Martin Poppel, Philipp Koehn, Christof Monz, Matteo Negri, Matt Post, Lucia Specia, Karin Verspoor, Jrg Tiedemann, and Marco Turchi. 2016a. Proc. of the 2016 confer-ence on statistical machine translation. In Proc. of the First Conference on Statistical Machine Trans-lation (WMT16), Berlin, Germany, August.
Ondˇrej Bojar, Ondˇrej Duˇsek, Tom Kocmi, Jindˇrich Li-bovick´y, Michal Nov´ak, Martin Popel, Roman Su-darikov, and Duˇsan Variˇs. 2016b. CzEng 1.6: En-larged Czech-English Parallel Corpus with Process-ing Tools Dockered. InText, Speech and Dialogue: 19th International Conference, TSD 2016, Brno, Czech Republic, September 12-16, 2016, Proceed-ings. Springer Verlag, September 12-16. In press.
Qin Gao and Stephan Vogel, 2008. Software Engineer-ing, TestEngineer-ing, and Quality Assurance for Natural Lan-guage Processing, chapter Parallel Implementations of Word Alignment Tool, pages 49–57. Association for Computational Linguistics.
Table 6: ParFDA results () andOOVrTCOV BLEU upper bounds for cs, de, and fi.
the 51st Annual Meeting of the Association for Com-putational Linguistics, pages 690–696, Sofia, Bul-garia, August.
Philipp Koehn, Hieu Hoang, Alexandra Birch, Chris Callison-Burch, Marcello Federico, Nicola Bertoldi, Brooke Cowan, Wade Shen, Christine Moran, Richard Zens, Chris Dyer, Ondrej Bojar, Alexandra Constantin, and Evan Herbst. 2007. Moses: Open source toolkit for statistical machine translation. In
Proc. of the 45th Annual Meeting of the Association
for Computational Linguistics Companion Volume Proc. of the Demo and Poster Sessions, pages 177– 180. Association for Computational Linguistics.
Franz Josef Och and Hermann Ney. 2003. A sys-tematic comparison of various statistical alignment models. Computational Linguistics, 29(1):19–51.
Table 7: ParFDA results () andOOVrTCOV BLEU upper bounds for ro, ru, and tr.