Proceedings of the Sixth Workshop on Computational Linguistics and Clinical Psychology, pages 126–136 Minneapolis, Minnesota, June 6, 2019. c2019 Association for Computational Linguistics
126
Abstract
Incoherent discourse in schizophrenia has long been recognized as a dominant symptom of the mental disorder (Bleuler, 1911/1950). Recent studies have used modern sentence and word embeddings to compute coherence metrics for spontaneous speech in schizophrenia. While clinical ratings always have a subjective element, computational linguistic methodology allows quantification of speech abnormalities. Clinical and empirical knowledge from psychiatry provide the theoretical and conceptual basis for modelling. Our study is an interdisciplinary attempt at improving coherence models in schizophrenia. Speech samples were obtained from healthy controls and patients with a diagnosis of schizophrenia or schizoaffective disorder and different severity of positive formal thought disorder. Interviews were transcribed and coherence metrics derived from different embeddings. One model found higher coherence metrics for controls than patients. All other models remained non-significant. More detailed analysis of the data motivates different approaches to improving coherence models in schizophrenia, e.g. by assessing referential abnormalities.
1
Introduction
Language impairments in schizophrenia are frequent (Kuperberg, 2010), can impede communication and social integration, and are
usually a predictor for poorer outcome (Roche et al., 2015). They include difficulties with structural aspects and pragmatic use of language as well as deficits in cohesion (Abu-Akel, 1997; Bartolucci and Fine, 1987; Chaika and Lambe, 1989) and semantic coherence (Bedi et al., 2015; Ditman and Kuperberg, 2010; Elvevag et al., 2007; Iter et al., 2018). Although incoherent speech is a prominent symptom of schizophrenia (American Psychiatric Association, 2013; Andreasen, 1979a; Ditman and Kuperberg, 2010), there have been few collaborations of psychiatry and linguistics to analyze the symptom with linguistic quantitative methodology.
In psychopathological terms, incoherent speech is usually not described as a language
disorder but as one possible manifestation of formal thought disorder (FTD) – a symptom occurring in a wide range of disorders, albeit predominantly in psychosis (Andreasen and Grove, 1986; Mercado et al., 2011; Roche et al., 2015). FTD comprises diverse abnormalities of speech and thought, such as neologisms, flight of ideas, rumination and perseveration, and negative symptoms like alogia (Broome et al., 2017; Roche et al., 2015) – all of which are not necessarily related to incoherent speech. For example, neologisms might impair coherence (Lecours and Vanier-Clément, 1976), but can also facilitate expressing ideas (Bleuler, 1911/1975; Covington et al., 2005). Another example is perseveration, where constant repetitions indicate speech abnormality but do not have to impede coherence (Liddle et al., 2002). Still, especially ratings of
Coherence models in schizophrenia
Sandra Just
1, Erik Haegert
2, Nora
Kořánová
2, Anna-Lena Bröcker
1, Ivan Nenchev
1,
Jakob Funcke
1,
Christiane Montag
1and Manfred Stede
21
Department of Psychiatry and Psychotherapy, Campus Charité Mitte, (Psychiatric University
Clinic at St. Hedwig Hospital), Charité – Universitätsmedizin Berlin, corporate member of
Freie Universität Berlin, Humboldt-Universität zu Berlin, and Berlin Institute of Health
2
Applied Computational Linguistics, UFS Cognitive Science, University of Potsdam
127 positive FTD bear relevance to assessing incoherent speech. For example, in the Scale for the Assessment of Positive Symptoms (SAPS), incoherent speech is defined as loss of associations within sentences which can result in incomprehensible “schizophasia” or “word salad” (Andreasen, 1979a). It is linked to other forms of positive FTD such as tangentiality (i.e. irrelevant responses to questions), derailment (i.e. loss of associations between larger units of speech), illogical, and indirect speech (Andreasen, 1984). It should be noted that incoherent speech varies across patients depending on the phase of illness and the presence and severity of other symptoms (Allen et al., 1993; Chaika, 1974; Roche et al., 2015).
In linguistics, incoherence refers to the deeper semantic sense of speech transcending the meaning of individual sentences. It is present locally, within and between sentences, as well as globally, as the overall topic or function of speech (Stede, 2007, p. 24f.). Rhetorical Structure Theory, for example, defines coherence through establishing relations between minimal discourse units and thereby building a structure which is reflective of the internal organization of discourse (Mann and Thompson, 1987).
A linguistic, valid, reliable and objective measure of incoherent speech could serve to find a common language between psychiatry and linguistics and specify the definition of incoherence as part of FTD. This could be useful for further examining the concept and underlying mechanisms such as neurological correlates as well as for assessing prognosis and treatment responsiveness.
1.1 Automated speech and coherence analysis
Ditman and Kuperberg (2010) suggest that incoherent speech in schizophrenia appears to be connected to abnormal use of referential markers (see also Docherty et al. (1998), Rochester (2013) or Hinzen and Rosselló (2015)) and problems in “integrating meaning across clauses” (p. 7) which can lead to a lower similarity between sentences in schizophrenia. This latter observation invites for automated coherence analysis that models coherence as lexical cohesion or concept overlap. Latent Semantic Analysis (LSA) (Landauer and Dumais, 1997) is such a measure and has been tested in schizophrenia research (Bedi et al., 2015;
Elvevag et al., 2007). In a recent study, Iter et al. (2018) could not distinguish between schizophrenia patients and healthy controls replicating the LSA-based models used in Bedi et al. (2015) and Elvevag et al. (2007). They point out three major shortcomings of the models: (1) the misinterpretation of verbal fillers as incoherent speech, (2) a bias to judging longer sentences as more coherent than short ones, as well as (3) a bias to judging repetitions as more coherent. Iter et al. (2018) were able to improve coherence models by Elvevag et al. (2007) and Bedi et al. (2015) by preprocessing their dataset and using modern word and sentence embedding techniques which have been shown to outperform LSA (Fang et al., 2016; Levy et al., 2015). Moreover, they credit the mentioned observations of referential problems in schizophrenia and propose a referential coherence model based on classifying ambiguous pronoun use to further improve the predictive value of their results.
Our study aims to (1) assess whether the models used by Iter et al. (2018) can be transferred to the German language, and (2) to apply them to a larger sample of patients of varying stability. Specifically, we aim to examine (1) whether schizophrenia patients and controls can be differentiated based on automated coherence analysis, and (2) whether schizophrenia patients of varying stability can be differentiated not only based on clinical rating scales but also based on automated coherence analysis. (3) We aim to extend attempts by Iter et al. (2018) to further improve coherence models by quantifying idiosyncrasies of speech in schizophrenia.
2
Method
2.1 Participants
N = 30 participants took part in this study (see
Table 1 for characteristics of the sample). n = 10
were patients from the Psychiatric University Clinic at St. Hedwig Hospital Berlin and n = 10 patients were recruited from the pool of participants in the MPP-S study (clinical trials ID: NCT02576613). Participants were: (1) inpatients (n = 5) or outpatients (n = 15) with a diagnosis of
schizophrenia (n = 15) or schizoaffective disorder
128 clinicians; (2) showed native proficiency in German language; (3) had no organic mental disorder or relevant severe somatic disease; (4) no
active substance dependence. The control group (n
= 10) was recruited from the local community. Healthy controls were screened by experienced
clinicians with the Mini-International
Neuropsychiatric Interview (M.I.N.I.) (Sheehan et
al., 1998).
The study was approved by the local ethics’ committee.
2.2 Procedure
Speech samples for automated analysis were obtained by trained clinicians with a short semi-structured interview, the Narrative of Emotions
Task (NET) (Buck et al., 2014). It includes three questions about four emotions: sadness, fear, anger and happiness: (1) What does this emotion mean to you? (2) Describe a situation where you felt this emotion. (3) Why do you think you felt this emotion in this situation? The interview is designed to prompt participants to define this range of simple emotions with the intention to “assess the richness and coherence with which
one explains emotional and social events“ (Buck
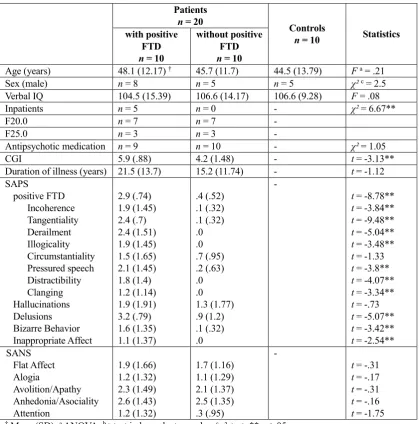
et al., 2014, p. 235). Semi-structured interviews have already been used in studies on automated speech analysis in schizophrenia (Elvevag et al., 2007; Minor et al., 2019). The structured format of the NET interview allows direct comparison between subjects and open questions generate Patients
n = 20
Controls
n = 10 Statistics with positive
FTD n = 10
without positive FTD n = 10
Age (years) 48.1 (12.17) † 45.7 (11.7) 44.5 (13.79) F a = .21
Sex (male) n = 8 n = 5 n = 5 χ²c = 2.5
Verbal IQ 104.5 (15.39) 106.6 (14.17) 106.6 (9.28) F = .08
Inpatients n = 5 n = 0 - χ² = 6.67**
F20.0 n = 7 n = 7 -
F25.0 n = 3 n = 3 -
Antipsychotic medication n = 9 n = 10 - χ² = 1.05
CGI 5.9 (.88) 4.2 (1.48) - t = -3.13**
Duration of illness (years) 21.5 (13.7) 15.2 (11.74) - t = -1.12
SAPS -
positive FTD 2.9 (.74) .4 (.52) t = -8.78**
Incoherence 1.9 (1.45) .1 (.32) t = -3.84**
Tangentiality 2.4 (.7) .1 (.32) t = -9.48**
Derailment 2.4 (1.51) .0 t = -5.04**
Illogicality 1.9 (1.45) .0 t = -3.48**
Circumstantiality 1.5 (1.65) .7 (.95) t = -1.33 Pressured speech 2.1 (1.45) .2 (.63) t = -3.8**
Distractibility 1.8 (1.4) .0 t = -4.07**
Clanging 1.2 (1.14) .0 t = -3.34**
Hallucinations 1.9 (1.91) 1.3 (1.77) t = -.73
Delusions 3.2 (.79) .9 (1.2) t = -5.07**
Bizarre Behavior 1.6 (1.35) .1 (.32) t = -3.42** Inappropriate Affect 1.1 (1.37) .0 t = -2.54**
SANS -
Flat Affect 1.9 (1.66) 1.7 (1.16) t = -.31
Alogia 1.2 (1.32) 1.1 (1.29) t = -.17
Avolition/Apathy 2.3 (1.49) 2.1 (1.37) t = -.31 Anhedonia/Asociality 2.6 (1.43) 2.5 (1.35) t = -.16
Attention 1.2 (1.32) .3 (.95) t = -1.75
[image:3.595.89.509.72.497.2]† Mean (SD); a ANOVA; b t-test independent samples; c χ²-test; **p < .05
129 larger samples of free speech. All NET interviews were recorded. They were transcribed by the first and third author.
The assessment also included a test of verbal intelligence, the exploration of demographic data and the M.I.N.I. (Sheehan et al., 1998) for controls. After the session, interviewers rated patients for psychopathology.
2.3 Measures
Psychopathology: Psychopathology was rated by trained clinicians with common psychiatric rating scales: the Scale for the Assessment of Negative Symptoms (SANS) (Andreasen, 1989) and the Scale for the Assessment of Positive Symptoms (SAPS) (Andreasen, 1984). Both scales have good psychometric properties and have frequently been used in schizophrenia research (Norman et al., 1996; van Erp et al., 2014). The patient sample was divided in two groups based on SAPS ratings of global positive FTD, including ratings of incoherence or tangentiality. The group with positive FTD was defined by SAPS ratings of at least mild (≥ 2) global positive FTD and at least mild incoherence or tangentiality (≥ 2).
Severity of illness: The Clinical Global Impression – Severity Scale (CGI) (Guy, 2000) allows trained clinicians to assess the severity of a patient’s illness on a scale from 1 (not at all ill) to 7 (extremely severely ill).
Verbal intelligence: “Crystallized” verbal intelligence was assessed with a German vocabulary test, the Wortschatztest (WST) (Schmidt and Metzler, 1992).
3
Data Analysis
3.1 Preparation of data
The dataset consists of 241 min 51 sec of 30 recorded NET interviews. Interview length
ranged between 3 to 22 min, with an average length of 8 min. The interviewer’s speech has been left out of more complex analysis because
the interviewer’s speech can be reduced to the
questions mentioned above.
However, questions have been used to categorize participants’ speech as definitions of emotions (question 1), descriptions of situations (questions 2) and reasoning why a situation evoked an emotion (question 3) (Buck et al., 2014). When interviewers deviated from the NET interview, those remarks were removed to ensure comparability. After cleaning transcripts of
interviewer’s speech, the dataset for baseline
analysis consists of 21,668 words, ranging from 137 to 2,641 words, with an average of 722.3 words per participant.
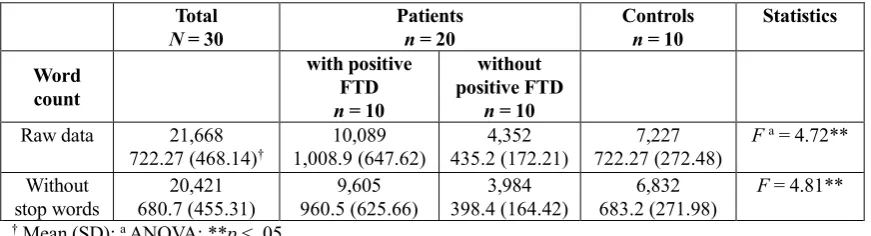
For the other coherence models, verbal fillers and sentences only containing stop words have also been excluded from analysis, because they have been shown to bias coherence measures (Iter et al., 2018). This reduced the dataset to 20,421 words, ranging from 121 to 2,551 words, with an average of 680.7 words per participant (see Table 2).
3.2 Speech analysis of transcripts
All speech analysis uses models inspired by those of Iter et al. (2018) which they base on research by Elvevag et al. (2007) and Bedi et al. (2015). Iter et al. (2018) name these approaches the Tangentiality and the Incoherence model, following the above definitions in the SAPS (Andreasen, 1984). In the Incoherence Model (Bedi et al., 2015), the cosine similarity between pairs of adjacent sentences embeddings serves as a measure of coherence. The Tangentiality model (Elvevag et al., 2007) models coherence as the slope of a linear regression line for the cosine similarities between a question and a moving Total
N = 30 Patients n = 20 Controls n = 10 Statistics Word
count
with positive FTD n = 10
without positive FTD
n = 10 Raw data 21,668
722.27 (468.14)† 1,008.9 (647.62)10,089 435.2 (172.21)4,352 722.27 (272.48)7,227 F
a = 4.72**
Without stop words
20,421 680.7 (455.31)
9,605 960.5 (625.66)
3,984 398.4 (164.42)
6,832 683.2 (271.98)
F = 4.81**
[image:4.595.81.517.73.191.2]† Mean (SD); a ANOVA; **p < .05
130 fixed-sized window of the response. A steeper negative slope means that the response is becoming less similar to the question over time. A steeper positive slope indicates that the response is getting more similar to the question over time, i.e. what psychiatry calls a circumstantial response (Andreasen, 1984). In either case, incoherent responses are characterized by steeper slopes. The differentiation of positive and negative slopes and the following necessity to calculate with absolute values has not been emphasized by Elvevag et al. (2007) or Iter et al. (2018).
Both the Incoherence and the Tangentiality model define coherence “as the concept overlap between two texts” (Iter et al., 2018) – either between utterances of the same speaker or between a question and the following response. These definitions reflect the intuition that, in order to be deemed coherent, a contribution to a verbal interaction is expected to adhere to the topic mutually established by the participants at any given stage of the conversation. The word distributions that form the basis for this kind of analysis are thus to be conceived of as a kind of epiphenomenon of more general principles of communication.
Baseline coherence model: The first step of speech analysis aims to test the Incoherence and Tangentiality model on the raw dataset. No filtering of stop words or fillers was performed except for the unavoidable loss of words not covered by vocabulary of the respective models. Baseline models use mean vector sentence embeddings, i.e. the mean of all word vectors per sentence or window of tokens (Iter et al., 2018). The vectors are given by a word2vec model (Mikolov et al., 2013) and a GloVe model (Pennington et al., 2014) trained on German data. The Tangentiality model at baseline uses a fixed-size window of four tokens.
In contrast to Iter et al. (2018), we refrained from using LSA in our analysis due to the lack of availability of such a model that has not already performed a TF-IDF-weighting (Lintean et al., 2010) at the stage of training. Additionally, the weighting scheme used at the training of the model at hand differs from that adopted by Iter et al. (2018). Consequently, in order to preserve a certain level of comparability, we decided not to use the available LSA model. However, the use of word2vec for our baseline is justifiable by the fact
that the main improvement from baseline to any of the other embeddings is not so much the choice of model but rather the filtering of stop words and fillers as well as the different weighting schemes.
New coherence models: Following Iter et al. (2018), we test mean of word vectors and three types of sentence embeddings on our preprocessed dataset: TF-IDF (Lintean et al., 2010), Smooth Inverse Frequency (SIF) (Arora et al., 2016) and Sent2Vec (Pagliardini et al., 2018).
For TF-IDF, we use the parameterization of Lintean et al. (2010), also used by Iter et al. (2018): multiplying each word embedding by the raw (non-logged) term frequency (#of times that word occurs in the sentence) and dividing by the (non-logged) document frequency (#of documents in which the term is used in a corpus). As a reference corpus for document frequencies we used a lemmatized dump of German Wikipedia (2011). Words not appearing in any document of the reference corpus were discarded, as closer investigation revealed them to be artifacts of the preprocessing steps rather than very uncommon and highly predictive words. Sent2Vec can be seen as an extension of Word2Vec in that its objective has been modified to encompass whole sentences rendering their embeddings predictive of the sentences surrounding them. Finally, SIF starts out by representing sentences by a weighted average of their word embeddings. In a further step, the projections of the average vectors on their first singular vector are removed, the effect of which is intended to be the removal of biases along directions reflecting idiosyncrasies of the underlying data. The principal goal of such weighting schemes lies in reducing the influence of very common words that contribute little to nothing semantically to the overall meaning of the sentence.
4
Results
4.1 Sample characteristics
131 clinical ratings for a number of symptoms than patients without positive FTD, including SAPS
global positive FTD, incoherence, and
tangentiality. See Table 1 for an overview of ratings of psychopathology and significant differences.
4.2 NET interviews
Interview length and word count differed significantly between groups: Patients with positive FTD had longer interviews and used more words than controls. Patients without positive FTD had shorter interviews and used less words than controls. This difference persisted after cleaning transcripts of stop words. The amount of verbal fillers and sentences only containing stop words did not differ significantly between groups. The dataset is presented in Table 2.
4.3 Coherence models
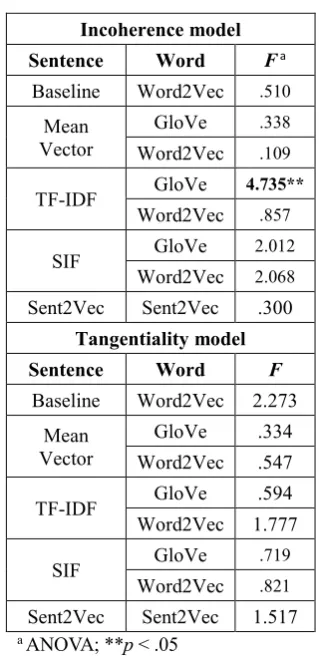
Incoherence model: Mean values for cosine similarities were calculated per interview. Group means were compared by ANOVA after testing for normal distribution (results for all models are presented in Table 3, extended results can be found in Appendix A). Group differences were only significant for TF-IDF term weighting using GloVe word embeddings: healthy controls showed higher coherence scores than patients without ratings of positive FTD who in turn exhibited higher coherence scores than patients with ratings of
positive FTD. Coherence metrics were
significantly negatively correlated with SAPS ratings of various positive symptoms: clothing and appearance (r = -.62; p < .05), social and sexual behavior (r = -.5; p < .05), global severity of bizarre behavior (r = -.48; p < .05), and symptoms of positive FTD: derailment (r = -.5; p < .05),
tangentiality, (r = -.4; p < .1), incoherence
(r = -.45; p < .05), illogicality (r = -.48; p < .05), clanging (r = -.41; p < .1), and inappropriate affect (r = -.5; p < .05). SANS ratings of negative symptoms were not significantly correlated with
coherence metrics. As Iter et al. (2018), we did not
detect any significant group differences at baseline for the Incoherence model. Removing verbal fillers and sentences composed entirely of stop words did not change this result for mean vector sentence embeddings, which were also used at baseline. Sent2Vec and SIF embeddings, and TF-IDF weighting using word2vec word embeddings also did not yield significantly different coherence metrics between groups.
Tangentiality model: First, absolute values of the computed slopes in the Tangentiality model were determined. This is necessary as high (negative or positive) values for slopes indicate incoherence. Thus, calculating means without absolute values could lead to false interpretations. Second, mean slopes were calculated per individual response, i.e. per question and emotion, yielding 12 values per interview. Those were further combined to mean values per each of the three questions and per each of the four emotions as well as to one overall mean slope per interview. Group means were compared by ANOVA after testing for normal distribution. Since results did not differ for comparisons of overall means versus means per question/emotion, we only report results for overall means. Overall mean slopes did not differ significantly between groups for any of the embeddings.
4.4 Improving coherence models in schizophrenia
Following observations of abnormalities in referential meaning made by Hinzen and Rosselló (2015), Iter et al. (2018) incorporate the presence
Incoherence model
Sentence Word F a
Baseline Word2Vec .510
Mean Vector
GloVe .338
Word2Vec .109
TF-IDF GloVe 4.735** Word2Vec .857
SIF GloVe 2.012
Word2Vec 2.068
Sent2Vec Sent2Vec .300
Tangentiality model
Sentence Word F
Baseline Word2Vec 2.273 Mean
Vector
GloVe .334 Word2Vec .547
TF-IDF GloVe .594
Word2Vec 1.777
SIF GloVe .719
Word2Vec .821
[image:6.595.336.496.71.402.2]Sent2Vec Sent2Vec 1.517 a ANOVA; **p < .05
132 of ambiguous pronouns in the data into their means of classification. They define ambiguous pronouns as either referring cataphorically or not having a referent at all. In contrast to Iter et al. (2018), we refrained from using automated coreference resolution which appeared to be relatively error-prone. We believe the evaluation on the basis of manual annotation to be more informative. We therefore manually marked ambiguous pronouns throughout the interview transcripts which allowed for determining a total number of ambiguous pronouns per interview. The average number of ambiguous pronouns was significantly higher for patients with ratings of positive FTD than for the other two groups (F = 4.79; p < .05). There was no significant difference between controls and patients without ratings of positive FTD. However, since pressured speech and word count differed significantly between groups, we repeated the comparison controlling for word count by only analyzing a window of the first 120 words per transcript. With this adjustment, the significant difference disappeared.
More detailed analysis of results revealed significant group differences in the amount of unknown words that were discarded before coherence metrics were computed because they were not contained in the respective model: patients with ratings of positive FTD used significantly more unknown words than patients without ratings of positive FTD or controls (F = 5.85; p < 0.05). When controlling for word count, this significant difference disappeared. However, it is worth differentiating unknown words: They can either be uncommon or quite specific actual words (e.g. exacerbation) or neologisms that are more or less intelligible (e.g. Rotwut: “red-rage”; e.g. vergehlich: approx. “fleeting”, no exact translation possible). While no control subject and only one patient without positive FTD used neologisms, five patients with ratings of positive FTD used neologisms (χ² = 8.75; p < .05). This difference remained significant after controlling for word count (χ² = 6.67; p < .05).
Closer investigation of transcripts revealed that participants with high scores for the Incoherence model (TF-IDF, GloVe) often repeated target words such as “sad” or “fear”. Low scores coincided with less repetitions – in some but not all cases. This is a mere qualitative observation.
5
Discussion
This study tested different computational linguistic
approaches to modeling coherence in
schizophrenia. The Incoherence model, using TF-IDF sentence embeddings and GloVe word embeddings, was able to distinguish between healthy controls and patients with or without ratings of positive FTD. Results from other approaches were not significant which demands for cautious interpretation. Although the significant group difference matches clinical impression, we argue to treat the result with caution. When judging the performance of a coherence model in schizophrenia, it might be misleading to merely base it on significant group
differences. This approach by Iter et al. (2018) is
based on the assumption that the speech of patients with schizophrenia contains less contextual overlap than the speech of healthy controls and that a model that detects this difference is correct and “outperforming” models that lack significant results. However, this basic assumption also requires critical evaluation. Perseveration poses one potential problem: This symptom of positive FTD involves constant repetitions and thus, influences models that are based on similarity between sets of key words, without actually accounting for whether the speech is intelligible (Iter et al., 2018). Since perseveration indicates speech abnormality but does not have to impede
coherence (Liddle et al., 2002), it can bias
automated coherence models. Future studies should clinically assess perseveration when recruiting patients to ensure that it is equally distributed. In comparison with controls though, the problem would remain. Based on our results, it remains unclear whether coherence modelled as context overlap differs significantly between patients with schizophrenia and healthy controls.
We would also like to emphasize that, while interpretation of the Incoherence model is intuitive, results in the Tangentiality model are substantially more complex. To our knowledge, the differentiation between negative and positive slopes has not been made in previous studies (Elvevag et al., 2007; Iter et al., 2018), albeit its relevance for interpretation. It remains open whether this measure accurately models incoherent features of speech in schizophrenia.
133 the trained models. In contrast to other studies testing automated coherence analysis in schizophrenia (Bedi et al., 2015; Elvevag et al., 2007; Iter et al., 2018), our models were trained on the German version of Wikipedia and may be inferior to models trained in English. Under the reasonable assumption that the English models were trained on the respective Wikipedia dump, the training data nearly triples that available for a
German model.1 The resulting differences in
representational quality are likely to be substantial. Additionally, German morphology may have to be taken into account as an aggravating factor as training was performed without any preprocessing beyond conversion to lower case letters. Being considerably richer than its English counterpart, it makes the demand for greater amounts of training data even more pressing, since the model has to generalize over a wider morphological spread. This problem is illustrated in Table 4 containing a sample of the cosine similarities computed with
our GloVe model. Here the word pair anger/
happiness achieves a higher score than the noun anger and its derivate angry, and similarities are even lower between the inflections of the adjective angry. Furthermore, the grammar of German famously features a productive rule of noun composition that in some cases leads to the
exacerbation of the problem of
out-of-vocabulary-words. For example, in one instance, 14 out of 31 the words not covered by our model were instances of such compound nouns.
More detailed analysis of our results inspires to improve coherence models by taking into account other ways of modelling coherence than context overlap and by controlling for possible confounding variables in the speech of patients
with schizophrenia. We agree with Iter et al. (2018)
that quantifying ambiguous pronoun use can be a valid approach to operationalizing a characteristic of incoherent speech in schizophrenia that has been
frequently described (Ditman and Kuperberg,
2010; Docherty et al., 1998; Hinzen and Rosselló, 2015; Rochester, 2013). Moreover, unknown words that are automatically removed from analysis because they are not contained in the vocabulary of the coherence model might confound results. In our sample, patients with high
1 The English Wikipedia constitutes 11.7% of the articles of all language editions combined whereas the German version represents only 4.6%.
(see en.wikipedia.org/wiki/Wikipedia:Size_of_Wikipedia)
ratings of positive FTD did use more uncommon,
specific or neologized words. While
incomprehensible neologisms can be associated
with “schizophasia” (Lecours and
Vanier-Clément, 1976), they are not necessarily a marker for incoherence. They can even enrich (therapeutic) discourse, e.g. as descriptions of novel, otherwise inexpressible ideas (Bleuler, 1911/1975; Covington et al., 2005). Thus, discarding them without further analysis might over- or underestimate the coherence of speech of thought disordered patients. Plus, we point out the importance of controlling for word count when
examining prevalence of speech abnormalities. Iter
et al. (2018) missed the opportunity of this adjustment despite large differences in word count between patients and controls, thereby possibly overseeing a confounding variable. Pressured speech is a common symptom of positive FTD in schizophrenia and can be correlated with
incoherence (Andreasen, 1979b, 1984) – still, mere
higher production of speech is no sign of incoherence. This limited our analysis on the first 120 words of responses – future research could test whether markers of incoherence vary depending on which part of the response is examined.
In conclusion, while automated coherence models can further improve understanding of incoherent speech in schizophrenia, our results emphasize the importance of carefully analyzing the data at hand while considering potential relationships between incoherence and other relevant variables. Moreover, they underline the necessity for the establishment of some standard with regards to the vector models underlying analysis. Nevertheless, this interdisciplinary approach can enable mutual stimulation between linguistics and psychiatry.
[image:8.595.330.505.74.138.2]Word Pair Cosine Similarity Wut, Freude 0.5278492 Wut, wütend 0.48702702 wütende, wütend 0.29909012 wütenden, wütend 0.28667736
134
References
Abu-Akel, A. (1997). A study of cohesive patterns and dynamic choices utilized by two schizophrenic patients in dialog, pre- and post-medication. Lang
Speech, 40 ( Pt 4), 331-351.
doi:10.1177/002383099704000402
Allen, H. A., Liddle, P. F., and Frith, C. D. (1993). Negative features, retrieval processes and verbal fluency in schizophrenia. The British Journal of Psychiatry, 163(6), 769-775.
American Psychiatric Association. (2013). Diagnostic and statistical manual of mental disorders: DSM-5 (5. ed.). Washington, DC u.a.: American Psychiatric Publ.
Andreasen, N. C. (1979a). Thought, language, and communication disorders. I. Clinical assessment, definition of terms, and evaluation of their reliability. Arch Gen Psychiatry, 36(12), 1315-1321.
Andreasen, N. C. (1979b). Thought, language, and communication disorders: II. Diagnostic significance. Archives of general Psychiatry, 36(12), 1325-1330.
Andreasen, N. C. (1984). Scale for the assessment of positive symptoms (SAPS): University of Iowa Iowa City.
Andreasen, N. C. (1989). The Scale for the Assessment of Negative Symptoms (SANS): Conceptual and Theoretical Foundations. British Journal of
Psychiatry, 155(S7), 49-52.
doi:10.1192/S0007125000291496
Andreasen, N. C., and Grove, W. M. (1986). Thought, language, and communication in schizophrenia: diagnosis and prognosis. Schizophrenia bulletin, 12(3), 348-359.
Arora, S., Liang, Y., and Ma, T. (2016). A simple but tough-to-beat baseline for sentence embeddings. Bartolucci, G., and Fine, J. (1987). The frequency of
cohesion weakness in psychiatric syndromes. Applied Psycholinguistics, 8(1), 67-74. doi:10.1017/S0142716400000072
Bedi, G., Carrillo, F., Cecchi, G. A., Slezak, D. F., Sigman, M., Mota, N. B., . . . Corcoran, C. M. (2015). Automated analysis of free speech predicts psychosis onset in high-risk youths. NPJ Schizophr, 1, 15030. doi:10.1038/npjschz.2015.30
Bleuler, E. (1911/1950). Dementia praecox or the group of schizophrenias.
Bleuler, E. (1911/1975). » Lehrbuch der Psychiatrie «, 13., von Manfred Bleuler neubearb. Aufl., Berlin/Heidelberg/New York.
Broome, M. R., Bottlender, R., Rösler, M., and Stieglitz, R. (2017). The AMDP System: Manual for Assesment and Documentation of Psychopathology in Psychiatry: Hogrefe Publishing.
Buck, B., Ludwig, K., Meyer, P. S., and Penn, D. L. (2014). The use of narrative sampling in the assessment of social cognition: the Narrative of Emotions Task (NET). Psychiatry Res, 217(3), 233-239. doi:10.1016/j.psychres.2014.03.014
Chaika, E. (1974). A linguist looks at schizophrenic language. Brain and Language, 1(3), 257-276. doi:10.1016/0093-934X(74)90040-6
Chaika, E., and Lambe, R. A. (1989). Cohesion in schizophrenic narratives, revisited. J Commun Disord, 22(6), 407-421.
Covington, M. A., He, C., Brown, C., Naçi, L., McClain, J. T., Fjordbak, B. S., . . . Brown, J. (2005). Schizophrenia and the structure of language: the linguist's view. Schizophrenia research, 77(1), 85-98.
Ditman, T., and Kuperberg, G. R. (2010). Building coherence: A framework for exploring the breakdown of links across clause boundaries in schizophrenia. J Neurolinguistics, 23(3), 254-269. doi:10.1016/j.jneuroling.2009.03.003
Docherty, N. M., Rhinewine, J. P., Labhart, R. P., and Gordinier, S. W. (1998). Communication disturbances and family psychiatric history in parents of schizophrenic patients. The Journal of nervous and mental disease, 186(12), 761-768. Elvevag, B., Foltz, P. W., Weinberger, D. R., and
Goldberg, T. E. (2007). Quantifying incoherence in speech: an automated methodology and novel application to schizophrenia. Schizophr Res, 93(1-3), 304-316. doi:10.1016/j.schres.2007.03.001 Fang, A., Macdonald, C., Ounis, I., and Habel, P.
(2016). Using Word Embedding to Evaluate the Coherence of Topics from Twitter Data. Paper presented at the Proceedings of the 39th International ACM SIGIR conference on Research and Development in Information Retrieval, Pisa, Italy.
Guy, W. (2000). Clinical global impressions (CGI) scale. Handbook of Psychiatric Measures.
Washington, DC: American Psychiatric
Association, 100-102.
135 Kuperberg, G. R. (2010). Language in schizophrenia
Part 1: an Introduction. Lang Linguist Compass,
4(8), 576-589.
doi:10.1111/j.1749-818X.2010.00216.x
Landauer, T. K., and Dumais, S. T. (1997). A solution to Plato's problem: The latent semantic analysis theory of acquisition, induction, and representation of knowledge. Psychological Review, 104(2), 211-240. doi:10.1037/0033-295X.104.2.211
Lecours, A., and Vanier-Clément, M. (1976). Schizophasia and jargonaphasia: A comparative description with comments on Chaika's and Fromkin's respective looks at “schizophrenic” language. Brain and language, 3(4), 516-565. Levy, O., Goldberg, Y., and Dagan, I. (2015).
Improving Distributional Similarity with Lessons Learned from Word Embeddings. Transactions of the Association for Computational Linguistics, 3, 211-225.
Liddle, P. F., Ngan, E. T., Caissie, S. L., Anderson, C. M., Bates, A. T., Quested, D. J., . . . Weg, R. (2002). Thought and Language Index: an instrument for assessing thought and language in schizophrenia. Br J Psychiatry, 181, 326-330.
Lintean, M., Moldovan, C., Rus, V., and McNamara, D. (2010). The role of local and global weighting in assessing the semantic similarity of texts using latent semantic analysis. Paper presented at the Twenty-Third International FLAIRS Conference. Mann, W. C., and Thompson, S. A. (1987). Rhetorical
Structure Theory: Description and Construction of Text Structures. In G. Kempen (Ed.), Natural Language Generation: New Results in Artificial Intelligence, Psychology and Linguistics (pp. 85-95). Dordrecht: Springer Netherlands.
Mercado, C. L., Johannesen, J. K., and Bell, M. D. (2011). Thought disorder severity in compromised, deteriorated, and preserved intellectual course of schizophrenia. J Nerv Ment Dis, 199(2), 111-116. doi:10.1097/NMD.0b013e3182083bae
Mikolov, T., Chen, K., Corrado, G., and Dean, J. (2013). Efficient estimation of word representations in vector space. arXiv preprint arXiv:1301.3781. Minor, K. S., Willits, J. A., Marggraf, M. P., Jones, M.
N., and Lysaker, P. H. (2019). Measuring disorganized speech in schizophrenia: automated analysis explains variance in cognitive deficits beyond clinician-rated scales. Psychol Med, 49(3), 440-448. doi:10.1017/S0033291718001046 Norman, R. M. G., Malla, A. K., Cortese, L., and Diaz,
F. (1996). A study of the interrelationship between and comparative interrater reliability of the SAPS, SANS and PANSS. Schizophrenia Research, 19(1),
73-85. doi: https://doi.org/10.1016/0920-9964(95)00055-0
Pagliardini, M., Gupta, P., and Jaggi, M. (2018). Unsupervised learning of sentence embeddings using compositional n-gram features. Paper presented at the Proceedings of the 2018 Conference of the North American Chapter of the Association for Computational Linguistics: Human Language Technologies, Volume 1 (Long Papers).
Pennington, J., Socher, R., and Manning, C. (2014). Glove: Global vectors for word representation. Paper presented at the Proceedings of the 2014 conference on empirical methods in natural language processing (EMNLP).
Roche, E., Creed, L., MacMahon, D., Brennan, D., and Clarke, M. (2015). The Epidemiology and Associated Phenomenology of Formal Thought Disorder: A Systematic Review. Schizophr Bull, 41(4), 951-962. doi:10.1093/schbul/sbu129 Rochester, S. (2013). Crazy talk: A study of the
discourse of schizophrenic speakers: Springer Science & Business Media.
Schmidt, K., and Metzler, P. (1992). Wortschatztest (WST). Beltz. In: Weinheim.
Sheehan, D. V., Lecrubier, Y., Sheehan, K. H., Amorim, P., Janavs, J., Weiller, E., . . . Dunbar, G. C. (1998). The Mini-International Neuropsychiatric Interview (MINI): the development and validation of a structured diagnostic psychiatric interview for DSM-IV and ICD-10. The Journal of clinical psychiatry.
Stede, M. (2007). Korpusgestützte Textanalyse: Grundzüge der Ebenen-orientierten Textlinguistik. Tübingen: Narr.
136
A
Appendices
Incoherence model
Sentence Word Patients with positive FTD Patients without positive FTD Controls Fa p
Baseline Word2Vec .740 (.071) † .721 (.057) .748 (.057) .510 .606 Mean
Vector
Glove .827 (.05) .806 (.075) .814 (.045) .338 .716
Word2Vec .778 (.048) .769 (.045) .775 (.046) .109 .897
TF-IDF Glove .228 (.054) .249 (.046) .291 (.037) 4.735** .017 Word2Vec .587 (.07) .558 (.082) .597 (.052) .857 .435
SIF Glove .103 (.05) .061 (.059) .064 (.045) 2.012 .153
Word2Vec .097 (.053) .046 (.062) .073 (.054) 2.068 .146
Sent2Vec Sent2Vec .164 (.021) .157 (.025) .163 (.018) .300 .743
Tangentiality model
Sentence Word Patients with positive FTD Patients without positive FTD Controls F p
Baseline Word2Vec .263 (.217) .444 (.338) .221 (.156) 2.273 .122 Mean
Vector
Glove 2.022 (1.481) 2.534 (1.755) 2.326 (.822) .334 .719 Word2Vec 1.577 (.852) 2.058 (1.285) 1.857 (.909) .547 .585
TF-IDF Glove 5.512 (1.874) 5.823 (2.784) 6.812 (3.465) .594 .559 Word2Vec 3.89 (.933) 4.965 (1.704) 5.479 (2.707) 1.777 .188
SIF Glove 4.709 (1.293) 5.143 (1.196) 4.76 (1.75) .275 .762 Word2Vec 4.1 (1.044) 5.008 (2.195) 4.256 (1.642) .821 .451
Sent2Vec Sent2Vec 2.889 (.776) 2.381 (.873) 2.979 (.834) 1.517 .237 † Mean (SD); a ANOVA; **p < .05