52
Classification of Semantic Paraphasias:
Optimization of a Word Embedding Model
Katy McKinney-Bock and Steven Bedrick Center for Spoken Language Understanding
Oregon Health & Science University Portland, Oregon, USA
{mckinnka,bedricks}@ohsu.edu
Abstract
In clinical assessment of people with aphasia, impairment in the ability to recall and pro-duce words for objects (anomia) is assessed using a confrontation naming task, where a tar-get stimulus is viewed and a corresponding la-bel is spoken by the participant. Vector space word embedding models have had inital re-sults in assessing semantic similarity of target-production pairs in order to automate scoring of this task; however, the resulting models are also highly dependent upon training parame-ters. To select an optimal family of models, we fit a beta regression model to the distribu-tion of performance metrics on a set of 2,880 grid search models and evaluate the resultant first- and second-order effects to explore how parameterization affects model performance. Comparing to SimLex-999, we show that clin-ical data can be used in an evaluation task with comparable optimal parameter settings as standard NLP evaluation datasets.
1 Introduction
In clinical assessment of people with aphasia, impairment in the ability to recall and produce words for objects (anomia) is assessed using a confrontation naming task, where a target stim-ulus is viewed and a corresponding label is spo-ken by the participant. Semantic impairment is measured by a clinician’s rating of semantic simi-larity between the target-production pairs, and in-volves a defined similarity criteria involving syn-onymy, association, and hypernymy. Research into word embedding models has shown that dif-ferent window parameterization settings capture different semantic relations of association/related-ness vs synonymy, functional properties vs top-icality, and word embedding models have been adapted to synonymy, association, and hypernymy (Hill et al., 2015; Levy et al., 2015; Levy and Goldberg, 2015; Lison and Kutuzov, 2017). A
central question in NLP research is how to use ex-trinsic evaluation to measure what semantic rela-tions are encoded by a model. In this paper, we engage in the interdiscplinary question of how se-mantic relations can be modeled in a clinical do-main, and present an application of word embed-ding models for assessing semantic impairment.
The Philadelphia Naming Test (PNT) imple-ments one such naming task that was developed for psycholinguistic and clinical research; the scoring of this test involves a large taxonomy of coding responses based on phonological and se-mantic similarity of the response to the target ob-ject (Roach et al., 1996). The taxonomy is moti-vated by Dell’s two-step model of aphasia, where anomia results from a disruption in accessing both the phonological representation as well as seman-tic properties of the object (Dell,1986).
PNT scoring is time-intensive due to the high number of items, and there have been successful attempts to both shorten the number of items on the test via computer adaptive assessment (Hula et al.,2015) as well as automate the scoring of the PNT via automated classification of paraphasias to facilitate the use of the PNT as a tool in clin-ical practice (Fergadiotis et al.,2016). Our work is part of a broader goal to develop an end-to-end automation of the PNT, from presentation of target items to an individual error profile.
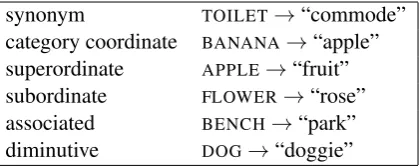
synonym TOILET→“commode” category coordinate BANANA→“apple” superordinate APPLE→“fruit” subordinate FLOWER→“rose” associated BENCH→“park” diminutive DOG→“doggie”
Table 1: PNT Semantic Error Relations
metric, a large database of PNT target-production pairs, and the distribution of similarity scores in an optimal model.
We present results of parameter optimization tasks and post-hoc analysis of the resulting vec-tor space in optimal and non-optimal models for the downstream application of classifying seman-tic paraphasias on the PNT, using a novel applica-tion of the beta regression model to evaluate grid search parameters. We then compare the evalu-ation metric of psycholinguistic aphasic data with SimLex-999, a standard NLP evaluation tasks with measured controls for synonymy and association, and explore best practices for adapting models to psycholinguistic, clinical environments.
2 Optimizing for confrontation naming
2.1 Using Clinical Data for Model Evaluation
Canonical word embedding tasks strive to model semantic relations that are similar to those used in the definition of PNT semantic errors such as synonymy and association (e.g. Hill et al.(2015); Levy et al.(2015)), and thus should be well suited for the classification of semantic errors in the PNT. Conventional scoring of the PNT defines a criteria for semantic errors that involves a real word noun production that is in one of six semantic relations with the target word; see Table 1 (Roach et al., 1996).
The PNT consists of 175 items, represented by a set of black-and-white images, and were selected based on a series of controls, involv-ing varyinvolv-ing word frequency based onFrancis and Kuˇcera (1982), word length (1 to 4 syllables), and high name performance by control partici-pants (Roach et al.,1996). Items in the PNT come from several semantic categories, and avoid land-marks or other recognizable individuals (Mirman et al.,2010). The Moss Aphasia Psycholinguistic Project Database (MAPPD) contains transcribed responses from over 300 administrations of the PNT, and is often used in aphasiological research; in this work, we use a subsample of 152
admin-istrations selected on the basis of clinical char-acteristics. The 152 administrations of the PNT are from 99 subjects from 1-195 months post on-set of aphasia. Five different sub-types of aphasia were present among the subjects (anomic, Broca, conduction, transcortical sensory, and Wernicke). Some subjects had multiple administrations of the PNT at different months post onset; the range is 1-6 administrations per subject.
The frequency and length controls for targets on the PNT, in addition to the semantic relations that define paraphasic errors on the naming test, estab-lish a paradigm for target-production word pairs that is quite similar to the structure of certain ex-ternal evaluation datasets developed for word em-bedding models. For example, SimLex-999 (Hill et al., 2015) is a benchmark dataset for assess-ing semantic similarity that is based on human ratings of word pairs on a scale of synonymy, as opposed to association/relatedness. SimLex-999 balances word association strength using the USF Free Association norms, samples from both asso-ciated and unassoasso-ciated word pairs, and controls for features such as the concreteness and part-of-speech of the word pairs. Additionally, the PNT involves human evaluation of these semantic re-lations – in this case, two trained clinicians – with instructions that train evaluators to look for specific dimensions of semantic similiarity when evaluating whether a word pair is semantically similar (the instructions are very similar to those used by SimLex-999). Comparing results from MAPPD, which depends on a clinician’s identifi-cation of a word pair as semantically similar, with results from SimLex-999 should establish whether clinical data is a reliable evaluation metric for em-bedding models.
2.2 Parameterization Affects Semantic Rela-tions in Word Embedding Models
Addition-ally, there are more domain general considerations when optimizing models to our downstream task. It has been shown that there is an ideal parame-ter setting for dimensionality of the resulting word vectors that is neither too high nor too low ( Lan-dauer and Dumais,1997;Yin and Shen,2018).
3 Methods
The current study tests whether model architec-ture, corpus preparation, and training parameters influence the semantic content of the word em-bedding model, as measured via the downstream classification task of scoring paraphasic errors on the PNT. We performed a grid search over these sets of parameters, and we evaluate the resultant models on both the PNT dataset as well as the SimLex-999 dataset (Hill et al.,2015), to evaluate and compare what patterns both evaluation meth-ods find in the data. In doing this, we ask whether the items and semantic similarity criteria of the Philadelphia Naming Test are informative in the context of evaluating parameter settings of word embedding models.
3.1 Corpus Preparation Pipelines
Following the method described by Fergadiotis et al. (2016), four versions of the English Gi-gaword corpus (LDC2011T07) were prepared,1 with stemming and stopword/punctuation removal as variables (see Table 2).2 Stemming was done using NLTK’s implementation of the Porter stemming algorithm (Porter, 1980; Bird et al., 2009). Stopword removal used the NLTK list of English-language stop words, notably including can, which is a PNT item; punctuation was
re-1
A reviewer suggests that multiple corpora could have been included in the grid search, with which we wholeheart-edly agree. Our preliminary experiments using pretrained embedding models trained on different corpora (such as a Wikipedia crawl), do not show large differences in perfor-mance in terms of optimal parameter settings. We leave a more detailed parameter search over different corpora to fu-ture research, and do have reason to expect that corpus selec-tion would be important for this task. With the embeddings described in the present study, we observed word sense issues for certain PNT items, such ashead, which when trained on newswire text obtains a dominant word sense for ruler/dic-tator/chairpersonrather than the body part; work aimed at modeling and addressing issues of word sense is in progress.
2
Note that the original paper by Fergadiotis et al. had used a version of the Gigaword corpus that had been augmented with additional conversational text; we elected to use the standard “vanilla” version of Gigaword, for reasons of repro-ducibility. An initial pilot study showed that the changes to the corpus resulted in negligible differences in performance.
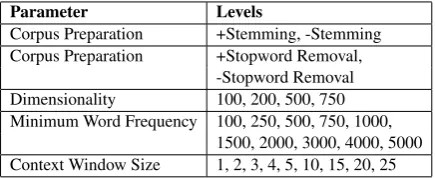
Parameter Levels
Corpus Preparation +Stemming, -Stemming
Corpus Preparation +Stopword Removal,
-Stopword Removal
Dimensionality 100, 200, 500, 750
[image:3.595.307.525.62.151.2]Minimum Word Frequency 100, 250, 500, 750, 1000, 1500, 2000, 3000, 4000, 5000 Context Window Size 1, 2, 3, 4, 5, 10, 15, 20, 25
Table 2: Grid Search Variables
moved with stopwords.3
3.2 word2vecTraining Parameters
At training time, three parameters were varied: the size of thecontext window4,dimensionalityof word embedding vectors, andminimum word fre-quencythreshold (see Table2). 1,440 CBOW and 1,440 Skipgram models were trained using Gen-sim v3.4.0, using the four Gigaword corpora, vary-ing the above-mentioned parameters. The default word2vectraining parameters were used for both CBOW and Skipgram models, including a nega-tive sampling rate of 5, a neganega-tive sampling expo-nent of 0.75,cbow mean=1 (uses the mean rather than the sum of context word vectors), 5 training epochs, alpha = 0.025, a minimum learning rate of .0001, and downsampling word frequency of 0.001.5
3.3 Evaluation Tasks
3.3.1 MAPPD Database of Philadelphia Nam-ing Tests
We evaluated the word embedding model using a semantic classification task for all trials in the MAPPD database. To do this, we took the or-thographic representation of the visual target item and the produced response to the naming task to be a target-production word pair in the embedding model, and used cosine similarity scores as input to the classifier to determine semantic similarity of
3For comparability with previous classification ex-periments, the version of Gigaword with +Stemming,
+Stopword Removal was formatted with line breaks after each one article. This may have had an effect on window trimming at training time for this particular variable manip-ulation. However, the limited second-order interaction of stemming and stopword removal shows that this likely had only a minor effect (see Section4). Samples from the cor-pora are in AppendixA.
4word2vecwindow is symmetrical on both sides of target word; e.g. windown= 1is [Word1 Target Word2].
5
target-production pairs in MAPPD. Cosine simi-larity of the vectors for the target and production were computed from each model on a transformed scale of [0,1]; target/production pairs including an OOV term were assigned a similarity score of 0.6
We then used these cosine similarity scores to determine whether, for the purposes of PNT item scoring, a subject’s production is sufficiently sim-ilar to the target word to count as a semantic para-phasia. Following the approach described by Fer-gadiotis et al. (2016), we do this via threshold-based classification: word pairs with cosine si-miliary above a pre-identified threshold are clas-sified as paraphasias with semantic relatedness, and word pairs with cosine similiarity below the threshold are classified as not semantically related. This approach has the advantage of being easily integrated into downstream classifiers in a way that is interpretable as well as tunable (by raising or lowering the threshold, we can trivially trade off precision for recall). Furthermore, there exist numerous well-understood methods for optimiz-ing the operatoptimiz-ing point of the threshold classifier. In this work, we calculated the optimal operating point for a model to be that which maximized the S1 score (the harmonic mean of sensitivity and specificity) in the cosine similiarity space.
In this work, we compared the performance of a large number of trained similarity models. To compare models, we took the set of computed similarity scores from each model and calculated the Area Under the Curve for the Receiver Oper-ating Characteristic (AUC for ROC; Hanley and McNeil(1982)). We take AUC score as a broad, threshold-independent evaluation of model perfor-mance (Huang and Ling,2005) and use this as a criteria for selection of our optimal family of mod-els.
The resulting distribution of AUC scores show clear interactions over parameter settings. We used beta regression (Ferrari and Cribari-Neto, 2004) to model the distribution of the AUC scores
6
A reviewer of this work noted that OOVs could have been treated as missing data for this task. The output of the semantic classifier under consideration in this study is used as a feature in a larger multinomial classifier, which also in-volves identifying nonwords, such that in our larger error-classification pipeline, nonwords are not assigned a similarity score. In the present study we used a zero value rather than a missing value, to avoid conflating nonwords with OOVs. Additionally, we note that investigations of the resulting dis-tribution of cosine similiarty scores shows a floor of .49, so that OOVs with a zero score are fully distinguishable from low-similarity word pairs in the MAPPD dataset.
from our grid search, and used the resulting coef-ficients to find optimal settings for each parame-ter. Beta regression is used for a response variable that is bounded within the standard unit interval, such as rates or proportions, and is appropriate to use for data that are heteroskedastic and/or asym-metric, as is the case with the distribution of AUC scores resulting from our grid search over word embedding models. It is typical to fit two beta regression models, one for each of the two hy-perparameters of the Beta distribution (mode and dispersion) (Simas et al., 2010;Cribari-Neto and Zeileis,2010).
3.3.2 SimLex-999
Cosine similarity scores for all SimLex-999 word pairs were computed for each of the 2,880 grid search models, and Spearman’s rank correlation coefficient was calculated to test the correlation of any given models’ similarity scores with the hu-man rating of similarity for synonymy. The sulting models were compared by fitting a beta re-gression model, scaling(ρ+ 1)/2as the response variable to fit the distribution ofρto the unit inter-val [0,1] which is required in beta regression (see Ferrari and Cribari-Neto(2004)).
4 Results
4.1 MAPPD Grid Search
Coefficients from a beta regression model are re-ported individually for each parameter (a table of estimates is provided in AppendexB). Coefficients represent the log-odds of an increase in AUC score per unit change in that parameter. We take the meanmodel as the main heuristic to evaluate how each parameter moves the center of AUC distribu-tion.Precisionmodel coefficients are used to eval-uate how each parameter changes the dispersion of the data (positive coefficients indicate smaller dispersion). In beta regression, the dispersion (or precision) parameterφincreases as the variance of the reponse variable decreases when the mean of the response variable is fixed (response variable in this case is the AUC score) (Ferrari and Cribari-Neto,2004).
4.1.1 Model Type
AUC scores move in the positive direction for Skipgram models compared with CBOW models (βSKIP =.067, p < .001; mean model), indicating
How-ever, the type of word embedding model interacts with corpus preparation and window size, such that the absolute highest performing model is a CBOW model with parameters (+stemmed, +stop-word removed, dimensions= 750, window size n = 1, frequency threshold= 100). However, Skipgram models show higher dispersion, espe-cially with smaller window sizes.
4.1.2 Corpus Preparation
Stopword removal moves AUC scores in a positive direction when other parameters are held constant (βSTOPRM = .108, p < .001; mean model). A
neg-ative interaction with Skipgram models indicates that stopword removal improves CBOW mod-els more than Skipgram modmod-els (βSKIP XSTOPRM = −.060, p < .001; mean model); however, for both types of models the AUC scores are still pulled in the positive direction when stopwords are re-moved. Stopword removal also decreases variance in the data, though there are second-order effects with all other parameters that subsequently show increased variance.
Optimal settings for stemming varies by the type of word embedding model. As a main effect, stemming improves model performance (βSTEM =
.034, p < .001; mean model). However, the neg-ative interaction with Skipgram models is signifi-cantly large enough that the effect is reversed, and stemming is contraindicated for Skipgram mod-els (βSKIP XSTEM = −0.078, p < .001; mean model)
when other parameters are held constant.
The mean model shows a non-significant ef-fect for the interaction of stemming and stopword removal (βSTEM XSTOPRM = .004, p > .05; mean
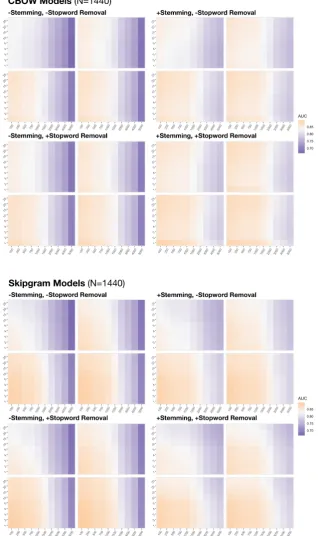
model). See AppendixC for a heat map of per-fomance broken down by corpus preparation.
4.1.3 Frequency Threshold
The frequency threshold has the largest effect on the mean model, in the negative direction (βFT = −0.191, p < .001), indicating that the small-est frequency threshold is optimal for all models. This interacts with stemming as well (βSTEM XFT = 0.079, p < .001); models trained on stemmed Gigaword show less decrease in the mean AUC score than the non-stemmed versions. As fre-quency threshold decreases, dispersion increases; this is mitigated via second-order effects with Skipgram/CBOW, Stemming, and Stopword re-moval.
4.1.4 Dimensionality
As dimensionality increases, so do corresponding AUC scores (βDIM = 0.035, p < .001). Skipgram
models show even higher performance from large dimensionality (βSKIP XDIM= 0.015, p < .001).
4.1.5 Window Size
Increasing window size shows a corresponding in-crease in AUC scores (βWIN = .027, p < .001;
mean model), but second-order effects show that this holds only for CBOW models. A negative interaction of window size with Skipgram mod-els is large enough that the effect is reversed, and a larger window size is contraindicated for Skip-gram models (βSKIP XWIN = −0.080, p < .001;
mean model).
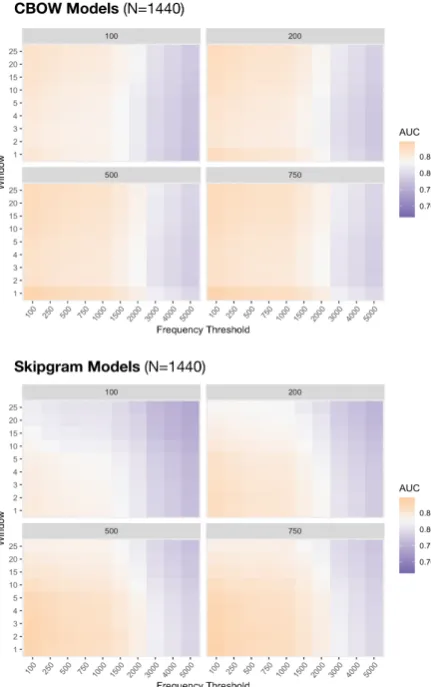
While CBOW models generally perform bet-ter with larger windows, there is one paramebet-ter setting for window size that violates the general trend. A heat map of the three parameters is given in Figure 1, which shows that the highest AUC scores occur in the smallest windows. The inverse relationship in performance for CBOW and Skip-gram models holds for a window size of [2, 25], but does not whenn=1 (see Section5.2).
4.1.6 Summary
The optimal parameter selection is frequency threshold=100 and dimensions=750 for all mod-els. Skipgram models are optimal when the cor-pus has been stopword removed and not stemmed, with window sizen= 1. CBOW models perform well when the corpus is stemmed and stopword-removed. While CBOW models generally show top performance as window sizes increase, with the exception that for window size n = 1 the CBOW models perform highest.
4.2 SimLex-999
To evaluate models on the SimLex-999 dataset, Spearman’s rank correlation coefficient (ρ) was calculated for each model comparing the relation-ship of model similarity scores and the human similarity judgments. The mean correlation across models, meanρ=.379and rangeρ= (.262, .496), is close to the state-of-the-art SimLex-999 score reported for Skipgramword2vecmodels of.37.7
There is a significant moderate correlation of AUC scores to Spearman’sρ(R=.41, p < .001). Following the same method for reporting AUC scores, we report only the differences on
Figure 1: Heat Map of AUC scores for CBOW and Skipgram models, by Dimensionality (facet), Window Size, and Frequency Threshold
eterization effects for a beta regression model, fit to scaled SimLexρscores (Pseudo-R2 =.874; a table of estimates is included in AppendixB).
Frequency threshold has much less of an ef-fect on the SimLex task than the clinical MAPPD task. The beta regression model finds less of a negative impact for frequency threshold (βF T =
−.028, p < .001) than in the MAPPD model. This is due to out-of-vocabulary (OOV) counts, as these are much lower proportionally in SimLex. OOVs impact the MAPPD dataset at a higher rate partly because there is a pool of 175 items that occur, and at differing frequency thresholds some of these items are excluded from training.
Stemming is dispreferred when looking at per-formance on SimLex CBOW models, (βSTEM = −.084, p < .001). There is an interaction be-tween stemming and Skipgram models that shows slight improvement in performance when Skip-gram models are stemmed over CBOW models (βSKIP XSTEM = 0.028, p < .001), but still
dispre-ferred. This differs from the MAPPD results,
where stemming improves CBOW models. Interestingly, window size still shows an inverse relation for CBOW and Skipgram models, as in the MAPPD task. Larger window sizes are opti-mal for CBOW models; sopti-maller window sizes are optimal for Skipgram models. The same excep-tion for n = 1with CBOW models is apparent, with the highestρin the smallest window size.
5 Discussion
5.1 Dimensionality, Frequency Threshold and Corpus Preparation
Across all model types, models with high dimen-sionality and low minimum frequency thresholds proved optimal. Furthermore, stopword removal also produced consistently optimal results, while stemming was optimal for CBOW models but not for Skipgram models.
Stemming proved to be a more complex pa-rameter, and interacted with minimum frequency threshold. Models with a higher frequency thresh-old performed better with unstemmed training data, whereas those with a lower threshold ben-efited from stemming. This is intuitive, as stem-ming a corpus will increase the token frequency for observed words while reducing the number of distinct types (e.g. cat and cats are stemmed to the same form,cat) relative to the unstemmed ver-sion of the corpus. In the unstemmedcondition, there will be more distinct token types whose fre-quency falls below any given minimum frefre-quency threshold, which will result in proportionally more words being removed from the final model’s vo-cabulary than would be the case in the stemmed condition. A greater amount of information is therefore removed prior to training, along with an increase in the out-of-vocabularly count when an-alyzing the PNT data.8
5.2 Parameter Optimization: Model Type and the Windown=1 Mystery
Window size affects how much linguistic context is available during training time and the semantic properties of resulting word vectors. We find con-cordance in the literature that Skipgram outper-forms CBOW on small window sizes for word pair similarity tasks (Levy et al.,2015) and that Skip-gram models show better SimLex performance for
smaller windows (Lison and Kutuzov,2017); our results show that Skipgram models perform bet-ter with smaller window sizes for both MAPPD and on SimLex. However, we also find overall that CBOW models show improved performance over Skipgram models as window size grows to 25, which is a much larger window size than re-ported in the literature on hyperparameter compar-ison. A notable exception is that performance for n= 1shows high performance for CBOW models across all parameter settings.
In addition to small context windows, we find Skipgram models to be optimal on the non-stemmed corpora, which decreases the token fre-quency. Levy et al. (2015) observe that the smoothing in Skipgram models may alleviate PMI’s bias towards rare occurrences, improving performance. However, it may still be the case that Skipgram models perform better with a larger variety of lower-frequency tokens overall, as in the non-stemmed corpora. This, combined with a small context window may increase the rarity of word co-occurrences overall with a given target and explain the interaction.
It remains a mystery why CBOW models show high performance with both large windows and the smallest window size n = 1. It may be the case that the symmetric bi-gram context returns the densest information context, only matched by window sizes that are quite large. While there are qualitative differences in the information captured by the CBOW window sizes for some items (not reported here due to space), it also appears that the resulting vector space geometry for large and small windows differs even for items where the list of most similar words is very similar.
For example,jewelryshares4/5of the five most similar words (pendant, earring, brooch, jewelry) for the optimal n = 1 and n = 25 CBOW model, but the range of cosine similarity scores for the two lists of most similar words differs: n= 1,(.60, .70)vs.n= 25,(.46, .54). However, the optimal operating threshold for these models is approximately the same: n = 1, S1 = .562; n = 25, S1 = .578. Investigation of neigh-borhood density with respect to the target words across models trained with different window sizes may result in a very different geometry of the re-sulting embedding space. Word frequency can bias the resulting vector space of word embedding models (Gong et al.,2018), making direct
compar-ison of word vectors of high and low frequencies problematic. Simple optimization based on oper-ating threshold on the ROC may be insufficient for overall optimization, and transformations of em-bedding space based on neighborhood density and word frequency an interesting vein of future work.
5.3 MAPPD and SimLex: Using Clinical Datasets for Evaluation
Optimization over the SimLex dataset shows sim-ilar parameter settings as MAPPD for dimension-ality and window size. Skipgram models are optimal, and a similar pattern of performance across window sizes is observed for Skipgram and CBOW models. Key differences in fre-quency threshold are related to differences in out-of-vocabulary items. Stemming is dispreferred across the SimLex dataset, which differs from the MAPPD CBOW models. As MAPPD utilizes only a limited vocabulary of nouns, the stemmed corpus might have a smaller effect than on the more morphologically varied SimLex word pairs.
6 Conclusion
Using beta regression to explore how parame-terization affects model performance, we show that performance on MAPPD and SimLex-999 datasets depends on similar optimal parameters. The implications, particularly for window size, are that the semantic relations encoded in these word pair datasets are comparable. However, results also reveal the importance of further in-vestigation into the geometry of resulting vector spaces. Patterns of performance demonstrate that the MAPPD dataset, based on a carefully con-structed clinical assessment, is useful as an eval-uation task for word embedding models and sheds additional insight onto the sensitivity of training parameter selection.
Acknowledgments
References
Steven Bird, Edward Loper, and Ewan Klein. 2009. Natural Language Processing with Python. OReilly Media Inc, Sebastapol, CA.
Francisco Cribari-Neto and Achim Zeileis. 2010. Beta regression in r.Journal of Statistical Software, Arti-cles, 34(2):1–24.
G. S. Dell. 1986. A spreading-activation theory of re-trieval in sentence production. Psychological Re-view, 93:283–321.
Gerasimos Fergadiotis, Kyle Gorman, and Steven Bedrick. 2016. Algorithmic classification of five characteristic types of paraphasias. American Jour-nal of Speech-Language Pathology, 25:S776–S787.
S.L.P. Ferrari and F. Cribari-Neto. 2004. Beta regres-sion for modelling rates and proportions. Journal of Applied Statistics, 31(7):799–815.
W. Francis and H. Kuˇcera. 1982. Frequency analysis of English usage: Lexicon and grammar. Boston: Houghton Mifflin.
Yoav Goldberg. 2015. A primer on neural network models for natural language processing. CoRR, abs/1510.00726.
Chengyue Gong, Di He, Xu Tan, Tao Qin, Liwei Wang, and Tie-Yan Liu. 2018. Frage: Frequency-agnostic word representation. In S. Bengio, H. Wallach, H. Larochelle, K. Grauman, N. Cesa-Bianchi, and R. Garnett, editors,Advances in Neural Information Processing Systems 31, pages 1334–1345. Curran Associates, Inc.
J. A. Hanley and B. J. McNeil. 1982. The meaning and use of the area under a receiver operating character-istic (roc) curve. Radiology, 143:29–36.
Felix Hill, Roi Reichart, and Anna Korhonen. 2015. Simlex-999: Evaluating semantic models with (gen-uine) similarity estimation. Computational Linguis-tics, 41(4):665–695.
Jin Huang and Charles X Ling. 2005. Using auc and accuracy in evaluating learning algorithms. IEEE Transactions on knowledge and Data Engineering, 17(3):299–310.
William Hula, Stacey Kellough, and Gerasimos Ferga-diotis. 2015. Development and simulation testing of a computerized adaptive version of the philadelphia naming test. Journal of speech, language, and hear-ing research : JSLHR, 58.
T. K. Landauer and S. T. Dumais. 1997. A solution to plato’s problem: The latent semantic analysis theory of acquisition, induction, and representation of knowledge. Psychological Review, 104(2):211– 240.
Omer Levy and Yoav Goldberg. 2015. Dependency-based word embeddings. InProceedings of the 52nd Annual Meeting of the Association for Computa-tional Linguistics (Short Papers), pages 302–308.
Omer Levy, Yoav Goldberg, and Ido Dagan. 2015. Im-proving distributional similarity with lessons learned from word embeddings.Transactions of the Associ-ation for ComputAssoci-ational Linguistics, 3:211–225.
Pierre Lison and Andrey Kutuzov. 2017. Redefining context windows for word embedding models: An experimental study.CoRR, abs/1704.05781.
D. Mirman, A. Brecher, G.M. Walker, P. Sobel, G.S. Dell, and M.F. Schwartz. 2010. A large, search-able, web-based database of aphasic performance on picture naming and other tests of cognitive function. Cognitive Neuropsychology, 27(6):495–504.
M.F. Porter. 1980. An algorithm for suffix stripping. Program, 14(3):130–137.
A. Roach, M.F. Schwartz, N. Martin, R.S. Grewal, and A. Brecher. 1996. The philadelphia naming test: Scoring and rationale. Clinical Aphasiology, 24:121–133.
A.B. Simas, W. Barreto-Souza, and A.V. Rocha. 2010. Improved estimators for a general class of beta re-gression models. Computational Statistics and Data Analysis, 54(2):348–366.
Zi Yin and Yuanyuan Shen. 2018. On the dimension-ality of word embedding. In S. Bengio, H. Wallach, H. Larochelle, K. Grauman, N. Cesa-Bianchi, and R. Garnett, editors,Advances in Neural Information Processing Systems 31, pages 887–898.
A Samples from Gigaword Corpora
+Stemming,+Stopword Removal
TRIBUT POUR AROUND WORLD LATE LABOUR PARTI LEADER JOHN SMITH DIE EARLIER MASSIV HEART ATTACK AGE WASHINGTON US STATE DEPART ISSU STATEMENT REGRET UNTIM DEATH SCOTTISH BARRIST PARLIAMENTARIAN SMITH THROUGHOUT DISTINGUISH CA-REER GOVERN OPPOSIT LEFT PROFOUND IMPRESS HISTORI PARTI COUNTRI STATE DEPART SPOKESMAN MICHAEL MC-CURRI SAID SECRETARI STATE WARREN CHRISTOPH EXTEND DEEPEST CONDOL SMITH SMITH CHILDREN
+Stemming,−Stopword Removal
AGE # .
IN WASHINGTON , THE US STATE DE-PART ISSU A STATEMENT REGRET “ THE UNTIM DEATH ” OF THE RAPIER-TONGU SCOTTISH BARRIST AND PARLIAMENTAR-IAN .
“ MR. SMITH , THROUGHOUT HIS DIS-TINGUISH CAREER IN GOVERN AND IN OPPOSIT , LEFT A PROFOUND IMPRESS ON THE HISTORI OF HIS PARTI AND HIS COUNTRI , ” STATE DEPART SPOKESMAN MICHAEL MCCURRI SAID .
“ SECRETARI ( OF STATE WARREN ) CHRISTOPH EXTEND HIS DEEPEST CON-DOL TO MRS. SMITH AND TO THE SMITH CHILDREN . ”
−Stemming,+Stopword Removal
tributes poured around world late labour party leader john smith died earlier massive heart attack aged
washington us state department issued state-ment regretting untimely death scottish barrister parliamentarian
smith throughout distinguished career gov-ernment opposition left profound impression history party country state department spokesman michael mccurry said
secretary state warren christopher extends deepest condolences smith smith children
−Stemming,−Stopword Removal
tributes poured in from around the world *day* to the late labour party leader john smith , who died earlier from a massive heart attack aged # .
in washington , the us state department is-sued a statement regretting “ the untimely death ” of the rapier-tongued scottish barrister and parliamentarian .
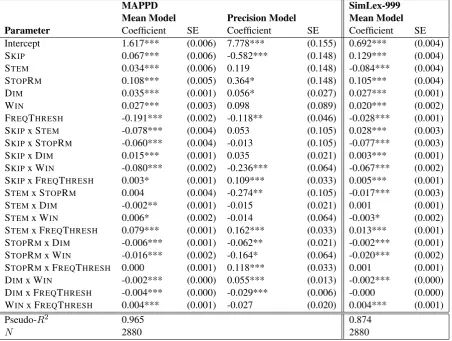
B Table of Estimates for Beta Regression Models
MAPPD SimLex-999
Mean Model Precision Model Mean Model Parameter Coefficient SE Coefficient SE Coefficient SE Intercept 1.617*** (0.006) 7.778*** (0.155) 0.692*** (0.004) SKIP 0.067*** (0.006) -0.582*** (0.148) 0.129*** (0.004) STEM 0.034*** (0.006) 0.119 (0.148) -0.084*** (0.004) STOPRM 0.108*** (0.005) 0.364* (0.148) 0.105*** (0.004) DIM 0.035*** (0.001) 0.056* (0.027) 0.027*** (0.001) WIN 0.027*** (0.003) 0.098 (0.089) 0.020*** (0.002)
FREQTHRESH -0.191*** (0.002) -0.118** (0.046) -0.028*** (0.001)
SKIPx STEM -0.078*** (0.004) 0.053 (0.105) 0.028*** (0.003) SKIPx STOPRM -0.060*** (0.004) -0.013 (0.105) -0.077*** (0.003) SKIPx DIM 0.015*** (0.001) 0.035 (0.021) 0.003*** (0.001) SKIPx WIN -0.080*** (0.002) -0.236*** (0.064) -0.067*** (0.002)
SKIPx FREQTHRESH 0.003* (0.001) 0.109*** (0.033) 0.005*** (0.001)
STEMx STOPRM 0.004 (0.004) -0.274** (0.105) -0.017*** (0.003) STEMx DIM -0.002** (0.001) -0.015 (0.021) 0.001 (0.001) STEMx WIN 0.006* (0.002) -0.014 (0.064) -0.003* (0.002)
STEMx FREQTHRESH 0.079*** (0.001) 0.162*** (0.033) 0.013*** (0.001)
STOPRMx DIM -0.006*** (0.001) -0.062** (0.021) -0.002*** (0.001) STOPRMx WIN -0.016*** (0.002) -0.164* (0.064) -0.020*** (0.002)
STOPRMx FREQTHRESH 0.000 (0.001) 0.118*** (0.033) 0.001 (0.001)
DIMx WIN -0.002*** (0.000) 0.055*** (0.013) -0.002*** (0.000)
DIMx FREQTHRESH -0.004*** (0.000) -0.029*** (0.006) -0.000 (0.000)
WINx FREQTHRESH 0.004*** (0.001) -0.027 (0.020) 0.004*** (0.001)
Pseudo-R2 0.965 0.874
N 2880 2880
Table 3: Table of Estimates for Beta Regression for Mean (µ) and Precision (φ). ‘x’ denotes second-order effects.
[image:10.595.73.526.95.436.2]C MAPPD Grid Search Results, by Corpus Preparation Type