The Economic and Social Review, Vol. 27, No. 4, July, 1996, pp. 365-388
P a r t y Support i n the D a i l Elections 1981-1992:
A n Ecological Analysis
R I C H A R D S I N N O T T
University College, Dublin
B R E N D A N J . W H E L A N
The Economic and Social Research Institute
J A M E S M c B R I D E
The Centre for the Study of American Culture and Language, Salzburg
Abstract: T h i s paper i s a contribution to the aggregate-level or ecological a n a l y s i s of voting
behaviour in I r e l a n d . I t updates and re-evaluates previous research by considering the six elections of 1981,1982 ( F e b r u a r y ) , 1982 (November), 1987, 1989 and 1992. T h e approach to deriving measures of the independent variables is based on aggregating the C e n s u s figures for District Electoral Divisions. T h e paper begins by critically examining past research i n this a r e a focusing especially on the thesis that "agricultural structure" is the m a i n determinant of the F i a n n a F 6 i l vote. I t goes on to present new analyses of party support across each of the six elections for four parties ( F i a n n a F a i l , F i n e G a e l , L a b o u r and Democratic Left/the Workers' P a r t y ) using a model incorporating class, urban-rural a n d liberal-conservative cleavages. T h e final section attempts to d r a w some general conclusions about the nature of party support in I r e l a n d and how it h a s changed over time.
I P R E V I O U S R E S E A R C H
eco-logical analyses of v o t i n g i n t h e early decades of the state can be s u m m a r i s e d by r e f e r r i n g t o t h e r e s u l t s of t h e one study t h a t was b o t h m u l t i v a r i a t e a n d l o n g i t u d i n a l (Gallagher, 1976). T h i s study covered fourteen elections between 1927 a n d 1965 and employed a pool of t e n independent variables derived from t h e census. I t showed t h a t t h e s t r u c t u r e of F i a n n a F a i l support r e m a i n e d f a i r l y constant between 1927 a n d 1938. T h e F i a n n a F a i l vote i n t h a t period can be p r e d i c t e d w i t h a reasonable degree o f success on t h e basis o f t h r e e v a r i a b l e s — p r o p o r t i o n o f f a r m e r s (positive), p r o p o r t i o n of I r i s h speakers (positive) a n d p r o p o r t i o n o f non-Catholics (negative). I n 1943, however, the s t r u c t u r e o f t h e F i a n n a F a i l vote changed s u b s t a n t i a l l y . The p r o p o r t i o n o f non-Catholics ceased t o have a n effect a n d t h e i m p a c t o f t h e p r o p o r t i o n o f f a r m e r s i n a n area changed f r o m p o s i t i v e t o negative. T h e r e was a sub s t a n t i a l decline i n t h e a m o u n t of variance i n t h e F i a n n a F a i l vote t h a t can be e x p l a i n e d (from 63 per cent i n 1938 to 3 1 per cent i n 1943) a n d r e l a t i v e l y low levels o f e x p l a n a t i o n persisted t h r o u g h the remainder of the period analysed.
I n g e n e r a l , t h e C u m a n n n a nGaedheal/Fine Gael vote was m u c h less p r e d i c t a b l e t h a n t h a t o f F i a n n a F a i l . Such p a t t e r n i n g as there i s suggests t h a t i t w a s n o t u n t i l 1932 a n d 1933 t h a t the class composition of t h e con s t i t u e n c i e s became a factor i n t h e C u m a n n n a nGaedheal/Fine G a e l vote (Gallagher, 1976, p. 32) a n d t h a t t h i s r e l a t i o n s h i p was moderate at best a n d g e n e r a l l y i n t e r m i t t e n t . I n 1965 t h e F i n e Gael vote became somewhat more p r e d i c t a b l e ( R2 = 0.46) a n d t h e p r e d i c t o r variables were t h e p r o p o r t i o n of
f a r m e r s ( i n t h i s case, positive) a n d t h e p r o p o r t i o n o f f a r m labourers (neg ative). T h e L a b o u r vote was t h e most predictable of a l l the p a r t y votes. T w o variables — p r o p o r t i o n of f a r m labourers (positive) a n d p r o p o r t i o n of farmers (negative) e x p l a i n s u b s t a n t i a l proportions o f variance ( i n several instances 60 per cent or more) i n the 14 elections over the forty year period examined.
I t is v i t a l t o bear i n m i n d t h a t aggregate or ecological analysis only p e r m i t s inferences t o be m a d e at t h e aggregate l e v e l , i.e., we can t a l k about t h e p a t t e r n a n d t h e sources of p a r t y support i n t e r m s of constituency or area characteristics b u t n o t i n t e r m s of i n d i v i d u a l behaviour. To do so w o u l d be t o f a l l f o u l o f t h e ecological fallacy i d e n t i f i e d b y Robinson (Robinson, 1950). H o w e v e r , even b e a r i n g t h i s l i m i t a t i o n i n m i n d , i t is evident from t h e above s u m m a r y t h a t m u c h can be gleaned about the sources of p a r t y support i n t h e p e r i o d f r o m t h e 1920s to t h e 1960s. Moreover, ecological analysis can be i n t e r p r e t e d i n t a n d e m w i t h t h e analysis of survey d a t a w h e n t h e l a t t e r are available. M a n y of t h e f i n d i n g s based on t h e ecological approach presented i n t h e body o f t h i s paper are supported b y survey d a t a from t h e same p e r i o d (1981-92).1
Convoluted r e d r a w i n g of constituency boundaries i n 1968 a n d 1974 placed major obstacles i n t h e w a y of t h i s k i n d of analysis o f the results of t h e 1969, 1973 a n d 1977 general elections. A s a r e s u l t , t h e r e was a b r e a k i n t h e a p p l i c a t i o n o f t h e ecological approach. F o r t u n a t e l y t h e constituencies defined i n 1979, and used, w i t h m i n o r changes, t h r o u g h o u t t h e 1980s, are m u c h more closely r e l a t e d t o t h e boundaries of counties a n d o f census sub-units w i t h i n counties. The e n s u i n g r e v i v a l o f the ecological approach has l e d t o some new a n d far-reaching conclusions.
O n t h e basis o f a n ecological analysis of t h e November 1982 election L a v e r argued t h a t " F i a n n a F a i l v o t i n g appears to be more consistently predictable f r o m aggregate data t h a n previous analysis suggests" (Laver, 1986, p. 129). The key to t h i s discovery is a composite v a r i a b l e ( a g r i c u l t u r a l s t r u c t u r e ) t h a t was i d e n t i f i e d b y means of a p r e l i m i n a r y factor analysis. T h e factor analysis of six groups of variables (66 variables i n a l l ) y i e l d e d t e n factors. T h e one t h a t proved to be m o s t useful combines d a t a on l a n d use p a t t e r n s ( p r o p o r t i o n of l a n d devoted t o c e r t a i n types of crops, t o pasture, to r o u g h g r a z i n g , etc.) w i t h v a r i a b l e s d e s c r i b i n g f a r m size, d r a w i n g a c o n t r a s t between areas devoted to t i l l a g e / h o r t i c u l t u r e on t h e one h a n d a n d areas w h e r e l i v e s t o c k r e a r i n g a n d a p a t t e r n o f s m a l l a n d m e d i u m sized h o l d i n g s are p r e d o m i n a n t o n t h e other.
Use o f t h i s a g r i c u l t u r a l s t r u c t u r e v a r i a b l e i n a series o f t w o - v a r i a b l e equations accounted for between 59 a n d 63 per cent o f t h e v a r i a n c e i n t h e F i a n n a F a i l vote i n November 1982. T h i s compares v e r y w e l l t o t h e l e v e l e x p l a i n e d b y G a l l a g h e r for t h e p e r i o d 1943-65 (see above). I n a l l o f t h e equations tested, t h e m a i n influence comes f r o m t h e a g r i c u l t u r a l s t r u c t u r e v a r i a b l e ( L a v e r , 1986, pp. 120-123). T h e F i a n n a F a i l vote increases sub s t a n t i a l l y w i t h increases i n t h e level o f livestock f a r m i n g a n d m e d i u m - s i z e d a g r i c u l t u r a l h o l d i n g s i n a county. I t is a r g u e d t h a t t h e r e l a t i o n s h i p between t h e F i a n n a F a i l vote a n d t h e p r o p o r t i o n o f t h e p o p u l a t i o n engaged i n a g r i c u l t u r e is spurious, being "an artefact of a s i t u a t i o n i n w h i c h t h e counties w i t h m o r e l i v e s t o c k f a r m i n g a n d s m a l l or m e d i u m farms also have h i g h e r proportions o f t h e p o p u l a t i o n engaged i n a g r i c u l t u r e " (Laver 1986, p. 125). I t is also argued t h a t t h e regional p a t t e r n of v o t i n g "appears to be a product o f t h e l i n k b e t w e e n v o t i n g a n d a g r i c u l t u r a l t e n u r e a n d l a n d use p a t t e r n s " ( L a v e r 1986, p 126). However, i n t h e case of F i n e Gael, L a v e r concludes t h a t " v a r i a t i o n s i n t h e F i n e Gael vote are impossible t o p r e d i c t u s i n g aggregate d a t a " ( L a v e r , 1986, p. 126). L i k e w i s e , t h e L a b o u r vote shows o n l y a w e a k r e l a t i o n s h i p t o socio-economic v a r i a b l e s a n d t h e conclusion is d r a w n t h a t local a n d candidate factors appear p a r a m o u n t .
choice o f t h e u n i t o f analysis. W h i l e i t is acknowledged t h a t "the i d e a l u n i t w o u l d doubtless be a D a i l constituency" (Laver, 1986, p. 110), the county is chosen as t h e u n i t o f analysis. T h i s has t h e disadvantage of considerably r e d u c i n g t h e n u m b e r o f cases ( f r o m 4 1 t o 26). M o r e i m p o r t a n t l y , w h e n w o r k i n g o n a county basis, D u b l i n presents a p a r t i c u l a r problem because o f i t s size a n d t h e large n u m b e r of constituencies i t contains. T h i s is dealt w i t h i n t h e s t u d y b y o m i t t i n g D u b l i n ; i t is a r g u e d t h a t l i t t l e n e t d i s t o r t i o n is i n t r o d u c e d b y d o i n g so. Since w h a t we are left w i t h , however, is an analysis t h a t excludes close to o n e - t h i r d o f the electorate, a segment moreover w i t h a d i s t i n c t i v e v o t i n g p a t t e r n , t h i s view m a y be o p t i m i s t i c . T h e inescapable a n d s u b s t a n t i a l l i m i t a t i o n is t h a t t h e conclusions relate only to t h e e x p l a n a t i o n of n o n - D u b l i n v o t i n g patterns. T h i s also affects comparisons w i t h t h e results of previous studies.
T h e t h i r d a n d f i n a l problem t h a t arises from w o r k i n g w i t h counties r a t h e r t h a n constituencies is t h a t , for t e n of t h e counties, p a r t y s u p p o r t has to be i n f e r r e d because five constituencies are made u p of pairs of counties. P a r t y support i n these counties is i n f e r r e d by u s i n g t h e 1979 local election results to a p p o r t i o n t h e g e n e r a l election vote for each p a r t y t o each o f t h e counties m a k i n g u p t h e constituency. T h i s involves t h e a s s u m p t i o n t h a t t h e s w i n g f r o m election t o election is constant across t h e t w o counties of a t w o - c o u n t y constituency.
cases or, a l t e r n a t i v e l y , i f one could avoid such a p p o r t i o n m e n t b y t h e use of constituencies r a t h e r t h a n counties.
I I E V A L U A T I N G T H E " A G R I C U L T U R A L S T R U C T U R E " T H E S I S
The use of t h e county as t h e u n i t o f analysis, w i t h the attendant difficulties j u s t described, is n o t i n fact i n e v i t a b l e . T h e S m a l l A r e a P o p u l a t i o n Statistics (SAPS) are available from the 1986 Census of P o p u l a t i o n at D i s t r i c t E l e c t o r a l D i v i s i o n ( D E D ) level i n respect o f a w i d e range of social, demographic a n d economic variables. F o r t h e constituency c o n f i g u r a t i o n defined i n t h e 1979 E l e c t o r a l A c t a n d operative w i t h v e r y few changes t h r o u g h o u t t h e 1980s, these d a t a can be aggregated t o constituency level for each of t h e 4 1 con stituencies. I n a s m a l l n u m b e r of cases, the 1979 constituency boundaries l e d to D E D s b e i n g d i v i d e d u p between t w o constituencies. I n these cases, t h e D E D d a t a were allocated t o t h e constituency i n w h i c h the b u l k o f t h e p o p u l a t i o n o f t h a t D E D was located. T h i s involves a far smaller r i s k o f e r r o r t h a n t h a t involved i n a p p o r t i o n i n g v o t i n g data on t h e basis of local election results.
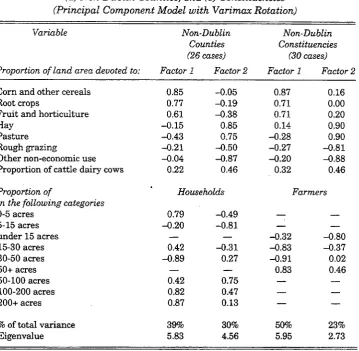
G i v e n t h e i m p o r t a n c e L a v e r a t t a c h e d t o t h e v a r i a b l e m e a s u r i n g a g r i c u l t u r a l s t r u c t u r e , o u r f i r s t step was t o check t h a t t h i s s t r u c t u r e r e m a i n e d r e l a t i v e l y constant w h e n constituency as opposed t o c o u n t y d a t a were used. T h i s was done b y r e p l i c a t i n g t h e L a v e r factor analysis for t h e new u n i t s o f analysis. Despite t h e s w i t c h from 26 cases based on c o u n t i e s2 t o 30
cases based o n constituencies a n d some changes i n t h e i n d i c a t o r s o f a g r i c u l t u r a l s t r u c t u r e ,3 i t d i d prove possible to r e p l i c a t e Laver's a g r i c u l t u r a l
s t r u c t u r e factor to q u i t e a satisfactory degree (see Table 1). E v e n t h e change i n t h e scale on w h i c h f a r m size is measured d i d n o t r a d i c a l l y affect t h e results — Table 1 shows t h a t t h e i m p a c t on t h e factor o f t h e large f a r m variables (100 t o 200 acres a n d over 200 acres) i n t h e L a v e r analysis is picked u p by t h e variable m e a s u r i n g farms over 50 acres i n t h e constituency-level analysis.
A l t h o u g h t h e effect o f one i t e m i n the L a v e r factor (the lowest step on t h e scale (0-5 acres)) is lost due t o t h e less d i f f e r e n t i a t e d l a n d - h o l d i n g scale
2. I n Laver's analysis, Tipperary forms two cases: North and South Riding
3. T h e variables used i n the constituency-based factor a n a l y s i s come from two sources. T h e variables i n the "Proportion of l a n d a r e a devoted to" section of Tables 1 and 3 were extracted from the 1981 Statistical Abstract. T h e variables relating to farm size were extracted from the 1981 C e n s u s of Population. T h e f a r m size variables differ from those in the county-based factor a n a l y s i s i n two ways. F i r s t , the county-based analysis is based on the proportion of households
Table 1: Comparison of Factor Analyses of Agricultural Variables Based on
(a) Non-Dublin Counties, and (b) Constituencies (Principal Component Model with Varimax Rotation)
Variable Non-Dublin Non-Dublin Counties Constituencies (26 cases) (30 cases)
Proportion of land area devoted to: Factor 1 Factor 2 Factor 1 Factor 2
Corn and other cereals 0.85 -0.05 0.87 0.16
Root crops 0.77 -0.19 0.71 0.00
Fruit and horticulture 0.61 -0.38 0.71 0.20
Hay -0.15 0.85 0.14 0.90
Pasture -0.43 0.75 -0.28 0.90
Rough grazing -0.21 -0.50 -0.27 -0.81
Other non-economic use -0.04 -0.87 -0.20 -0.88
Proportion of cattle dairy cows 0.22 0.46 0.32 0.46
Proportion of Households Farmers
in the following categories
0-5 acres 0.79 -0.49
—
—
5-15 acres -0.20 -0.81
—
—
under 15 acres
—
—
-0.32 -0.8015-30 acres 0.42 -0.31 -0.83 -0.37
30-50 acres -0.89 0.27 -0.91 0.02
50+ acres
—
—
0.83 0.4650-100 acres 0.42 0.75
—
—
100-200 acres 0.82 0.47
—
—
200+ acres 0.87 0.13
—
—
% of total variance 39% 30% 50% 23%
Eigenvalue 5.83 4.56 5.95 2.73
available a t constituency level, i t appears t h a t t h e r e is a f a i r l y robust factor s t r u c t u r e u n d e r l y i n g t h e p a t t e r n s o f l a n d use a n d l a n d t e n u r e . T h i s can be described, more or less f o l l o w i n g L a v e r , as t i l l a g e / h o r t i c u l t u r e on r e l a t i v e l y l a r g e f a r m s versus l i v e s t o c k f a r m i n g o n m e d i u m to s m a l l h o l d i n g s . T h e second factor also replicates Laver's "prosperous versus m a r g i n a l " dimension. F r o m the p o i n t o f v i e w o f t h e present exercise, the i m p o r t a n t p o i n t is t h a t t h e c o u n t y a n d c o n s t i t u e n c y based factor analyses produce r e s u l t s t h a t are sufficiently close t o p e r m i t a test o f t h e a g r i c u l t u r a l s t r u c t u r e thesis u s i n g constituencies as t h e u n i t o f analysis.
t h e fact t h a t , i n analyses of t h e county-level r e s u l t s of t h e November 1982 general election (excluding D u b l i n ) , t h i s variable was t h e d o m i n a n t one i n a series o f two-variable regression equations p r o d u c i n g R2 values r a n g i n g f r o m
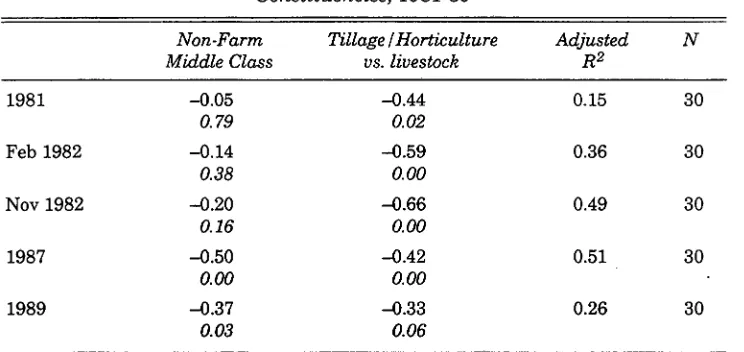
0.50 to 0.63 (Laver, 1986, p. 121). Table 2 presents t h e results of a test of t h i s . r e l a t i o n s h i p at constituency level for a l l five elections of t h e 1 9 8 0 s .4 T h i s test
[image:7.484.60.432.294.470.2]uses t w o variables, t h e T i l l a g e / H o r t i c u l t u r e vs. Livestock factor (as r e p l i c a t e d i n Table 1), a n d t h e p r o p o r t i o n o f t h e n o n - f a r m m i d d l e class i n each con stituency. T h e l a t t e r v a r i a b l e is s i m i l a r to Laver's Professional vs. M a n u a l factor (Laver, 1986, p. 112). T h o u g h l a r g e l y discounted i n Laver's analysis, t h i s v a r i a b l e proves t o have a stronger e x p l a n a t o r y value i n t h e tests w h i c h include b o t h D u b l i n and n o n - D u b l i n constituencies. The results confirm t h a t t h e t i l l a g e versus l i v e s t o c k v a r i a b l e was a s i g n i f i c a n t d e t e r m i n a n t o f t h e F i a n n a F a i l vote i n November 1982. The coefficient for the variable was - 0 . 6 6 (a h i g h score o n t h e v a r i a b l e indicates h i g h t i l l a g e areas, hence t h e r e s u l t s
Table 2: Ecological Analysis of Fianna Fail Vote in Non-Dublin
Constituencies, 1981-89
Non-Farm Middle Class
Tillage /Horticulture vs. livestock
Adjusted R2
N
1981 -0.05 -0.44 0.15 30
0.79 0.02
Feb 1982 -0.14 -0.59 0.36 30
0.38 0.00
Nov 1982 -0.20 -0.66 0.49 30
0.16 0.00
1987 -0.50 -0.42 0.51 30
0.00 0.00
1989 -0.37 -0.33 0.26 30
0.03 0.06
Note: The main entry for each variable is the standardised regression coefficient
beta, the figure beneath i n italics is the significance of the t-value.
i n d i c a t e t h a t F i a n n a F a i l s u p p o r t was lower i n h i g h t i l l a g e areas a n d h i g h e r i n h i g h livestock areas). T h e R2 for the e q u a t i o n was 0.49. However, t h e R2
values for 1981 a n d 1989 are q u i t e l o w (0.15 and 0.26) a n d t h a t for F e b r u a r y 1982 is o n l y moderate a t best ( 0 . 3 6 ) .5 I t is t r u e t h a t t h e e q u a t i o n for 1987
produces a n R2 o f 0.51 b u t t h i s is t h e r e s u l t of t h e combined and more or less
equal effects o f t h e t i l l a g e versus livestock a n d t h e m i d d l e class variables. T h u s i t appears t h a t i t was o n l y i n N o v e m b e r 1982 t h a t the s t r u c t u r e o f a g r i c u l t u r e was i n any sense t h e basis o f constituency-level v a r i a t i o n i n t h e F i a n n a F a i l vote a n d even t h e n t h e level o f variance explained by t h e variable (0.49) is a p p r e c i a b l y l o w e r t h a n t h e l e v e l achieved i n t h e c o u n t y - l e v e l analysis (0.63).
A p o t e n t i a l f l a w i n t h e above t e s t is t h a t m o v i n g to constituencies as the u n i t o f analysis introduces t w o essentially u r b a n u n i t s (the constituencies o f C o r k N o r t h - C e n t r a l a n d C o r k S o u t h - C e n t r a l ) , t h e presence o f w h i c h m a y d i s t o r t t h e analysis a n d account for the l o w e r levels of variance e x p l a i n e d . O n l y 2.73 per cent of t h e p o p u l a t i o n i n Cork N o r t h - C e n t r a l a n d 2.13 per cent i n C o r k S o u t h - C e n t r a l are engaged i n a g r i c u l t u r e . I t does n o t seem sensible t o be a t t e m p t i n g to e x p l a i n t h e behaviour of the other 97-98 per cent o f voters by reference t o w h e t h e r the s t r u c t u r e of a g r i c u l t u r e among the 2 to 3 per cent is o r i e n t e d t o t i l l a g e / h o r t i c u l t u r e or livestock r e a r i n g . C o n s i d e r a t i o n o f t h e p o s s i b i l i t y o f r e m o v i n g these t w o cases, however, raises the issue o f w h e t h e r t h e same a r g u m e n t applies t o other constituencies w i t h large u r b a n concen t r a t i o n s . Does i t m a k e sense t o use a g r i c u l t u r a l s t r u c t u r e to e x p l a i n F i a n n a F a i l s u p p o r t i n L o u t h ( p r o p o r t i o n engaged i n a g r i c u l t u r e 4.82 per cent) or i n L i m e r i c k E a s t (5.14 per cent), i n K i l d a r e (6.07 per cent), i n W i c k l o w (6.86 per cent) or even i n W a t e r f o r d (8.49 per cent)? A l t h o u g h t h i s p r o b l e m is more severe a t t h e constituency level, i t is apparent from the above examples t h a t i t occurs also a t t h e county level. I n fact, i t t u r n s u p i n Laver's county-level analysis i n t h e f o r m of over predictions o f the F i a n n a F a i l vote i n W i c k l o w , C o r k , W a t e r f o r d a n d L o u t h ( L a v e r , 1986. p. 124). L a v e r a r g u e d t h a t t h e W i c k l o w over-prediction "could w e l l r e s u l t f r o m a concentration of p o p u l a t i o n i n a c o m m u t e r b e l t near D u b l i n , y e t these factors w o u l d n o t be c a p t u r e d b y Factor 7 ( t h e a g r i c u l t u r a l s t r u c t u r e factor) a t a l l , since a l l o f t h e i n p u t v a r i ables deal w i t h l a n d h o l d i n g s over t h e whole county r a t h e r t h a n w i t h people, concentrated i n only a p a r t of i t " (p. 124). The a r g u m e n t m i g h t w e l l have been extended t o t h e o t h e r over-predictions t h a t emerged f r o m t h e analysis — C o r k , W a t e r f o r d a n d L o u t h . A s noted, w h e n we t u r n to t h e analysis a t t h e constituency level, t h e a r g u m e n t becomes more urgent.
A l l o f t h i s suggests t h a t t h e m o s t r i g o r o u s a n d t h e f a i r e s t t e s t o f t h e a g r i c u l t u r a l s t r u c t u r e hypothesis w o u l d be to apply the analysis to t h e r e a l l y r e l e v a n t set o f cases, i.e., not j u s t the n o n D u b l i n constituencies b u t t h e n o n -u r b a n ones. There is, of co-urse, t h e problem o f t h e c-ut-off p o i n t t o be -used i n deciding w h a t constituencies to exclude. I n the test t h a t follows we exclude constituencies i n w h i c h more t h a n 90 per cent o f t h e p o p u l a t i o n are engaged i n n o n - f a r m i n g occupations. I n a d d i t i o n t o t h e a l r e a d y excluded D u b l i n constituencies, t h i s cut-off p o i n t excludes the seven constituencies m e n t i o n e d i n the discussion above — Cork N o r t h - C e n t r a l , C o r k South-Central, K i l d a r e , L i m e r i c k East, L o u t h , W a t e r f o r d a n d W i c k l o w .
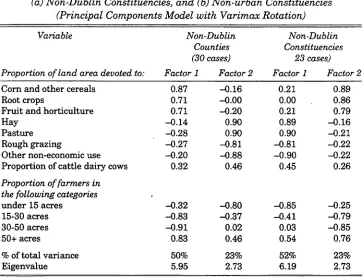
[image:9.484.62.426.330.607.2]Once a g a i n , t h e f i r s t step was t o r e r u n t h e factor analysis i n order to confirm t h e existence of t h e t i l l a g e / h o r t i c u l t u r e versus livestock d i s t i n c t i o n a n d i n order to be able t o assign factor scores t o t h e constituencies. T h i s analysis c o n f i r m e d t h a t t h e t w o factors p r e v i o u s l y i d e n t i f i e d a p p l y t o t h e reduced set of cases, a l t h o u g h the order o f t h e r o t a t e d factors is reversed (see Table 3). A c c o r d i n g l y , i n w h a t follows, we s h a l l use t h e second r a t h e r t h a n t h e f i r s t factor for the factor analysis o f t h e non-urban constituencies i n t h i s
Table 3: Comparison of Factor Analyses of Agricultural Variables Based on
(a) Non-Dublin Constituencies, and (b) Non-urban Constituencies (Principal Components Model with Varimax Rotation)
Variable Non-Dublin Non-Dublin Counties Constituencies (30 cases) 23 cases)
Proportion of land area devoted to: Factor 1 Factor 2 Factor 1 Factor 2
Corn and other cereals 0.87 -0.16 0.21 0.89
Root crops 0.71 -0.00 0.00 0.86
Fruit and horticulture 0.71 -0.20 0.21 0.79
Hay -0.14 0.90 0.89 -0.16
Pasture -0.28 0.90 0.90 -0.21
Rough grazing -0.27 -0.81 -0.81 -0.22
Other non-economic use -0.20 -0.88 -0.90 -0.22
Proportion of cattle dairy cows 0.32 0.46 0.45 0.26
Proportion of farmers in the following categories
under 15 acres -0.32 -0.80 -0.85 -0.25
15-30 acres -0.83 -0.37 -0.41 -0.79
30-50 acres -0.91 0.02 0.03 -0.85
50+ acres 0.83 0.46 0.54 0.76
% of total variance 50% 23% 52% 23%
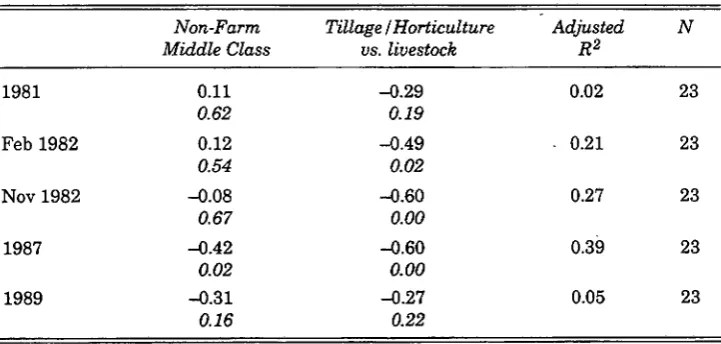
f u r t h e r t e s t o f t h e thesis. Table 4 presents t h e r e s u l t s o f a p p l y i n g t h e t w o -v a r i a b l e social class a n d a g r i c u l t u r a l s t r u c t u r e model t o t h e F i a n n a F a i l -vote i n n o n - u r b a n constituencies i n t h e five elections o f t h e 1980s. S u r p r i s i n g l y , e l i m i n a t i o n o f t h e p r i m a r i l y u r b a n cases does n o t i m p r o v e t h e performance o f t h e m o d e l i n general or of t h e a g r i c u l t u r a l s t r u c t u r e v a r i a b l e i n p a r t i c u l a r . T h e p r o p o r t i o n of variance explained ranges f r o m 0.02 to 0.39. The l a t t e r R2
( w h i c h o b t a i n s i n 1987) is due to t h e combined influence of t h e class a n d a g r i c u l t u r a l variables. T h u s , a p a r t from t h e fact t h a t t h e equation for 1987 produces o n l y a moderate level o f e x p l a n a t i o n , i t does n o t indicate t h a t any o v e r r i d i n g p r i m a c y attaches to t h e a g r i c u l t u r a l s t r u c t u r e v a r i a b l e as t h e d e t e r m i n a n t o f F i a n n a F a i l support. Moreover, t h e a g r i c u l t u r a l s t r u c t u r e v a r i a b l e is s i g n i f i c a n t i n only t w o o f t h e other four equations a n d produces low to negligible explanations of variance. I n assessing the implications of t h e r e s u l t s i n T a b l e 3, i t s h o u l d be borne i n m i n d t h a t these are t h e set o f constituencies i n w h i c h the a g r i c u l t u r a l s t r u c t u r e hypothesis ought to show t h e m o s t positive results.
P u t t i n g t h e r e s u l t s o f these analyses t o g e t h e r suggests t h a t t h e a g r i c u l t u r a l s t r u c t u r e thesis has q u i t e l i m i t e d a p p l i c a b i l i t y . A t best, i t applies only t o t h e November 1982 election. E v e n t h e n , the key a g r i c u l t u r a l s t r u c t u r e v a r i a b l e produces a considerably l o w e r level o f R2 w h e n a p p l i e d at t h e con
[image:10.480.53.414.417.589.2]s t i t u e n c y level as opposed to t h e county level a n d explains only 27 per cent o f t h e v a r i a n c e w h e n applied to t h e 23 least u r b a n constituencies i n w h i c h one w o u l d h a v e expected i t to p e r f o r m best. I n s u m , w h i l e t h e s t r u c t u r e o f
Table 4: Ecological Analysis of Fianna Fail Vote in Non-urban Constituencies,
1981-89 Non-Farm
Middle Class
Tillage/Horticulture vs. livestock
Adjusted R2
N
1981 0.11 -0.29 0.02 23
0.62 0.19
Feb 1982 0.12 -0.49 • 0.21 23
0.54 0.02
Nov 1982 -0.08 -0.60 0.27 23
0.67 0.00
1987 -0.42 -0.60 0.39 23
0.02 0.00
1989 -0.31 -0.27 0.05 23
0.16 0.22
Note: The m a i n entry for each variable is the standardised regression coefficient
a g r i c u l t u r e seems to have h a d some i m p a c t on t h e F i a n n a F a i l vote a t one or two elections, one can h a r d l y speak of "an a g r i c u l t u r a l basis" to F i a n n a F a i l support. We conclude t h a t i t is n o t w o r t h p e r s i s t i n g w i t h a model t h a t p r o duces such meagre results and, i n any event, applies to only, a t most, t w o -t h i r d s o f -t h e elec-tora-te. Accordingly, i n -t h e analysis -t h a -t follows we i n c l u d e t h e f u l l set of 4 1 constituencies and, i n order t o test for t h e i m p a c t o f a g r i c u l t u r e and a r u r a l e n v i r o n m e n t on v o t i n g we r e t u r n to the s t a n d a r d v a r i a b l e of t h e p r o p o r t i o n o f t h e p o p u l a t i o n engaged i n a g r i c u l t u r e . U n l i k e t h e a g r i c u l t u r e s t r u c t u r e v a r i a b l e , t h i s has the advantage of a p p l y i n g across t h e f u l l set o f constituencies.
I l l R E - E S T I M A T I N G T H E E Q U A T I O N S
I n w o r k i n g t o w a r d s the equations presented below, we began by e x a m i n i n g a l a r g e range o f p o t e n t i a l e x p l a n a t o r y v a r i a b l e s i n c l u d i n g age s t r u c t u r e , dependency, occupational structure and various other social a n d demographic characteristics as given i n the S m a l l A r e a P o p u l a t i o n Statistics. T h i s e x a m i n a t i o n i n c l u d e d factor analysis of various subsets of the variables. W h i l e t h e factor a n a l y t i c results were reasonably clear a n d i n t e r p r e t a b l e , t h e r e s u l t i n g composite variables were of l i t t l e or no use i n accounting for t h e p a t t e r n o f p a r t y support. T h i s bears out Laver's experience w i t h factor analysis of a v e r y s i m i l a r set of data.
constituencies i n t h e 1980s and, for the 1992 election, we use the proportions v o t i n g "no-no-no" a n d "yes-yes-no" i n t h e s i m u l t a n e o u s referendums o n t r a v e l , i n f o r m a t i o n a n d the "substantive issue" i n November 1992.6 I n c l u s i o n
of t h e s e v a r i a b l e s i n our m o d e l is i m p o r t a n t because o f t h e obvious significance o f t h e u n d e r l y i n g cleavage, because t h i s cleavage is r e l a t e d to t h e u r b a n - r u r a l a n d class cleavages already present i n t h e m o d e l7 a n d because
other evidence suggests t h a t liberal-conservative attitudes may be r e l a t e d to s u p p o r t for F i a n n a F a i l i n p a r t i c u l a r .8 I n t h e analysis of p a r t y support t h a t
follows, we present f i r s t t h e basic socio-demographic model for each p a r t y i n t h e six elections a n d t h e n examine t h e effect of a d d i n g a measure of t h e liberal-conservative cleavage t o t h e model for each election.
Explaining Fianna Fail Support
I n a d d i t i o n t o t h e u r b a n - r u r a l and class cleavage variables, the basic model for F i a n n a F a i l introduces a t h i r d variable — a d u m m y variable representing t h e constituency o f Donegal N o r t h - E a s t . W e noted above t h e d i l e m m a a r i s i n g i n t h e D o n e g a l N o r t h - E a s t case from t h e s u b s t a n t i a l vote for Independent F i a n n a F a i l candidate N e i l B l a n e y .9 I n c l u d i n g t h i s vote i n t h e measure of
F i a n n a F a i l s u p p o r t i n f l a t e s t h e measure; e x c l u d i n g i t leads to a n u n d e r e s t i m a t i o n o f F i a n n a F a i l support. Laver opted to include t h e Blaney vote a n d t h e choice i s p r o b a b l y t h e best one, g i v e n these t w o options. T h e r e i s , however, a t h i r d p o s s i b i l i t y , t h a t is, n o t to i n c l u d e t h e B l a n e y votes i n t h e F i a n n a F a i l vote b u t t o b u i l d t h e B l a n e y factor i n t o the model by w a y of a d u m m y v a r i a b l e . T h i s w i l l b o t h measure the i m p a c t o f the Blaney factor and, most i m p o r t a n t l y , w i l l allow us t o estimate t h e i m p a c t of the other variables i n t h e m o d e l c o n t r o l l i n g for t h e d i s t o r t i n g effect o f Donegal North-East.
U s i n g t h e basic model, t h e p r e d i c t a b i l i t y of t h e F i a n n a F a i l vote varies c o n s i d e r a b l y over t h e six elections (Table 5). I t is r e l a t i v e l y l o w o n t w o occasions (1981 a n d 1989), w h e n only t h e u r b a n - r u r a l variable ( p r o p o r t i o n o f f a r m e r s ) has a s i g n i f i c a n t effect. I t is moderate to good i n t h r e e adjacent elections (the t w o elections of 1982 a n d t h e election of 1987) i n w h i c h there is evidence o f a negative m i d d l e class effect o n F i a n n a F a i l support — a n effect t h a t i s most evident i n 1987. B u t t h e n i t is a t i t s highest i n 1992 ( R2 = 0.58)
solely o n t h e basis of t h e u r b a n r u r a l variable. T h i s suggests t w o m a i n obser v a t i o n s : t h e r e appears t o be an u n d e r l y i n g u r b a n - r u r a l contrast i n F i a n n a
6. F o r the background to the November 1992 abortion referendums and for the estimation of the proportions voting ultra-conservative (no-no-no) and liberal (yes-yes-no) in them, See Sinnott, W a l s h a n d W h e l a n (1995).
7. F o r the evidence on the impact of u r b a n - r u r a l a n d class contrasts on liberal a n d con servative voting i n referendums see Sinnott (1995), pp. 234-248.
Constant Proportion Farmers Proportion Middle Class Donegal NE Proportion Liberals 1983 (No to abortion
amendment) Proportion Liberals 1992 (YesYesNo) Proportion Ultra-C'vatives 1992 (No-No-No) Proportion Pragmatists 1992 (YesYesYesj Adjusted
R2 N
(a) socio-demographic variables
1981 41.09 0.30
0.00
0.00
0.99
- 8 . 4 6
0.11
0.33 41
F e b 1982 48.78 0.27
0.00
- 0 . 5 8
0.03
- 1 6 . 1 3
0.00
0.49 41
Nov 1982 45.03 0.35
0.00
- 0 . 5 3
0.04
- 1 3 . 1 9
0.01
0.54 41
1987 49.14 0.30
0.00
- 0 . 8 9
0.00
- 1 5 . 0 6
0.02
0.48 41
1989 41.44 0.36
0.00
- 0 . 2 0
0.53
- 6 . 6 3
0.35
0.27 41
1992 34.73 0.51
0.00
- 0 . 2 1
0.40
- 4 . 9 6
0.34
0.58 41
(b) socio-demographic and liberal-conservative variables 1981 40.31 0.32 - 0 . 0 2
0.04 0.95
- 8 . 2 1
0.15
0.02
0.90
0.31 41
F e b 1982 47.59 0.29
0.05
- 0 . 6 1
0.06
- 1 5 . 7 6
0.01
0.03
0.84
0.48 41
Nov 1982 57.05 0.10 0.47
- 0 . 1 6 0.59
- 1 6 . 9 6 0.00
- 0 . 3 5
0.03
0.58 41
1987 54.48 0.19
0.32
- 0 . 7 5
0.04
- 1 6 . 8 1
0.02
- 0 . 1 5
0.45
0.47 41
1989 54.51 0.07
0.73
0.14
0.71
- 1 0 . 9 0
0.14
- 0 . 3 7
0.09
0.31 41
1992 44.11 0.32
0.02
0.29
0.41
- 8 . 1 8
0.13
- 0 . 4 2
0.06
0.61 41
1992 32.67 0.48
0.00
- 0 . 1 5
0.58
- 6 . 0 8
0.30
0.06
0.66
0.57 41
1992 24.51 0.50
0.00
- 0 . 0 6
0.83
- 2 . 5 7 0.65
0.33
0.19
F a i l support w h i c h was greatly accentuated i n 1992 and there is evidence o f a negative m i d d l e class effect over t h e t h r e e elections from 1982 t o 1987, the effect b e i n g most pronounced i n t h e last of these three elections.
G i v e n t h e r e l a t i o n s h i p between t h e class a n d u r b a n - r u r a l cleavages on t h e one h a n d a n d l i b e r a l i s m - c o n s e r v a t i s m on t h e other, the obvious q u e s t i o n is w h e t h e r t h e effects e v i d e n t i n t h i s basic model are n o t j u s t reflections o f a m o r e f u n d a m e n t a l r e l a t i o n s h i p — t h a t b e t w e e n F i a n n a F a i l s u p p o r t a n d conservatism on r e l i g i o u s - m o r a l issues. A s suggested above, we can t e s t t h i s hypothesis a t t h e constituency level b y i n s e r t i n g a measure o f l i b e r a l i s m -c o n s e r v a t i s m i n t o t h e m o d e l . T h e r e s u l t s are r e p o r t e d i n T a b l e 6. T h e negative effect of t h e p r o p o r t i o n o f liberals (proportion v o t i n g "no" i n t h e 1983 abortion a m e n d m e n t )1 0 displaces the positive r u r a l and negative m i d d l e class
effects i n N o v e m b e r 1982 a n d is t h e only s i g n i f i c a n t substantive v a r i a b l e h a v i n g a n effect on F i a n n a F a i l support i n t h a t election. However, before j u m p i n g t o t h e conclusion t h a t t h i s establishes the thesis of "a politics w i t h a liberal-conservative basis", one m u s t emphasise t h a t November 1982 was the only election out of t h e five conducted i n the 1980s i n w h i c h t h i s p r e d o m i n a n t i m p a c t of t h e l i b e r a l conservative cleavage is found. The effect d i d n o t appear a g a i n u n t i l exactly a decade l a t e r — November 1992. Rather t h a n c l a i m i n g to have uncovered t h e s t r u c t u r e o f F i a n n a F a i l support, we conclude t h a t t h e s t r u c t u r e o f F i a n n a F a i l s u p p o r t is v a r i a b l e , t h a t i t involves i n t e r m i t t e n t u r b a n - r u r a l a n d class cleavages a n d t h a t i t can, b u t does n o t necessarily, involve t h e m o b i l i s a t i o n o f the liberalconservative cleavage. W h y t h e l i b e r a l -conservative cleavage m i g h t have been m o b i l i s e d i n November 1982 a n d i n
1992 is beyond the scope o f t h i s article. Suffice i t to note t h a t the issue of t h e h o l d i n g o f a n a b o r t i o n r e f e r e n d u m came t o a head i n t h e r u n u p t o t h e N o v e m b e r 1982 election a n d t h a t t h e 1992 election a c t u a l l y coincided w i t h t h e h o l d i n g o f t h r e e r e f e r e n d u m s o n t h e issue of a b o r t i o n . I t m a y also be r e l e v a n t t h a t t h e 1992 election h a d been preceded by t h e 1990 p r e s i d e n t i a l election a n d t h a t there is considerable evidence of an activation of t h e l i b e r a l -conservative cleavage i n t h a t p a r t i c u l a r c o n t e s t .1 1
Explaining Fine Gael Support
Whereas L a v e r found t h a t "none of the m u l t i p l e regressions used t o predict t h e F i n e Gael vote ( i n November 1982), were s t a t i s t i c a l l y significant" (Laver, 1986, p. 126), a p p l i c a t i o n of t h e basic two-variable model at the constituency l e v e l shows s t a t i s t i c a l l y s i g n i f i c a n t effects for b o t h o f t h e variables i n t h e model ( p r o p o r t i o n of farmers a n d p r o p o r t i o n i n the professional m i d d l e class)
10. W e experimented with both the 1983 abortion "no" vote and the 1986 divorce "yes" vote as measures of liberalism. T h e former proved more effective.
Constant Proportion Farmers Proportion Middle Class Proportion Liberals 1983 (No to Abortion
Amendment) Proportion Liberals 1992 (Yes-Yes-No) Proportion Ultra-C'vatives 1992 (No-No-No) Proportion Pragmatisls 1992 (Yes-Yes-Yes) Ailjusted
R* N
(a) socio-demographic variables
1981 25.03 0.23
0.02
0.93
0.01
0.17 41
F e b 1982 24.34 0.22
0.02
1.11
0.00
0.23 41
Nov 1982 25.44 0.23
0.02
1.19
0.00
0.25 41
1987 13.59 0.51
0.00
0.74
0.01
0.44 41
1989 14.47 0.64
0.00
0.70
0.03
0.46 41
1992 13.64 0.65
0.00
0.28
0.33
0.58 41
(b) socio-demographic and liberal-conservative 1981 20.42 0.33
0.06 variables 0.78 0.05 0.14 0.49
0.16 41
F e b 1982 17.38 0.37
0.03
0.89
0.02
0.21
0.29
0.23 41
Nov 1982 18.54 0.37
0.03
0.97
0.01
0.20
0.29
0.26 41
1987 11.51 0.56
0.00
0.69
0.03
0.06 0.73
0.42 41
1989 12.47 0.68
0.00
0.65
0.09
0.06
0.78
0.45 41
1992 23.34 0.44
0.00
0.82
0.04
- 0 . 4 4
0.06
0.61 41
1992 3.97 0.53
0.00
0.55
0.08
0.29
0.04
0.61 41
1992 25.65 0.65
0.00
0.10 0.74
- 0 . 3 9
0.14
for a l m o s t a l l elections i n the period 1981 to 1992. A d m i t t e d l y , t h e level of variance explained i n 1981 and 1982 is q u i t e low, r a n g i n g from 0.17 i n 1981 t o 0.25 i n N o v e m b e r 1982. These r e l a t i v e l y low R2s are consistent w i t h t h e
p i c t u r e o f t h e g r o w i n g F i n e Gael vote i n t h i s period as a coalition d r a w i n g on diverse sources o f s u p p o r t .1 2 I n 1987 F i n e Gael support d i d n o t j u s t stop
g r o w i n g , i t collapsed; t h e consequences i n t e r m s of t h e sources of i t s support w e r e a s u b s t a n t i a l increase i n p r e d i c t a b i l i t y a n d a n increased reliance on s u p p o r t i n r u r a l areas. I n 1992 t h i s reliance was even more pronounced — t h e m i d d l e class v a r i a b l e became i n s i g n i f i c a n t a n d , despite t h i s , t h e p r e d i c t a b i l i t y of t h e F i n e Gael vote increased substantially ( R2 = 0.58).
I n t r o d u c t i o n o f t h e l i b e r a l conservative v a r i a b l e i n t o t h e m o d e l for F i n e Gael produces a significant effect only i n t h e last election of the series — 1992 — a n d i n d o i n g so i t considerably clarifies the n a t u r e of support for the p a r t y i n t h a t election. I n t h i s case, b o t h l i b e r a l i s m (measured by v o t i n g yes-yes-no i n t h e 1992 r e f e r e n d u m s ) a n d u l t r a - c o n s e r v a t i s m ( v o t i n g no-no-no) have significant effects on t h e Fine Gael vote. T h e l i b e r a l effect is n e g a t i v e1 3 a n d
t h e ultra-conservative effect is positive. I n c l u d i n g either of these variables i n t h e model also t h r o w s l i g h t on t h e operation of the u r b a n r u r a l a n d especially of t h e class variable. The former continues to have a significant t h o u g h some w h a t less pronounced effect. M o s t i n t e r e s t i n g l y , t h e m i d d l e class v a r i a b l e , w h i c h , as we have seen, appeared to drop o u t o f t h e p i c t u r e o f F i n e Gael s u p p o r t i n 1992, is n o w shown t o have a larger, positive e f f e c t .1 4 T h i s sug
gests t h a t , because class a n d liberalism-conservatism are r e l a t e d , t h e u s u a l positive m i d d l e class effect on F i n e Gael is being masked by the simultaneous n e g a t i v e effect o f t h e p r o p o r t i o n o f l i b e r a l s . O n l y w h e n b o t h v a r i a b l e s are i n c l u d e d i n t h e equation do t h e i r j o i n t a n d contrary effects become apparent.
Explaining Labour Party Support
As n o t e d above, support for t h e L a b o u r P a r t y was more predictable t h a n t h a t o f any o f t h e other parties over t h e period u p to 1965. The s i t u a t i o n was v e r y different i n t h e 1980s. B y t h e n , perhaps n o t s u r p r i s i n g l y , t h e former key f a r m l a b o u r e r effect o n L a b o u r v o t i n g h a d completely disappeared. A test o f a new two-variable model (farmers a n d w o r k i n g class) shows a significant effect for only one v a r i a b l e (farmers) i n one election (1989) and i n t h a t election t h e m o d e l e x p l a i n s only 16 per cent of t h e variance. The s i t u a t i o n is d o u b l y p u z z l i n g i n t h a t , c o n t r a r y to previous patterns, t h e significant f a r m e r effect
12. Sinnott (1995), p.291.
13. T h e level of significance of the negative liberal effect on F i n e Gael is 0.06.
Constant
Proportion Proportion Proportion Liberals 1983 Proportion Ultra- Pragmatists Proportion ' Proportion (No to Abortion Liberals 1992 C'vatives 1992 1992
Farmers Working Class Amendment) (Yes-Yes-No) (No-No-No) (Yes-Yes-Yes) Adjusted
R2
(a) socio-demographic variables
1981 14.31 - 0 . 0 3 - 0 . 1 6
0.76 0.66
F e b 1982 13.21 - 0 . 1 0 - 0 . 1 2
0.36 0.76
Nov 1982 12.09 - 0 . 0 7 - 0 . 0 3
0.55 0.95
1987 10.95 0.01 - 0 . 2 4
0.95 0.42
1989 7.97 0.39 0.18
0.01 0.66
1992 23.26 - 0 . 4 5 0.11
0.00 0.64
(b) socio-demographic and liberal-conservative variables
1981 7.18 0.08 - 0 . 0 1 0.11
0.77 0.98 0.65
F e b 1982 1.24 0.08 0.14 0.18
0.76 0.80 0.48
Nov 1982 9.88 - 0 . 0 3 0.02 0.03
0.92 0.98 0.91
1987 - 0 . 5 2 0.22 - 0 . 0 4 0.19
0.39 0.92 0.37
1989 - 1 4 . 6 7 0.83 0.57 0.37
0.04 0.27 0.23
1992 2.07 - 0 . 1 7 0.42
0.45 0.19
1992 24.94 - 0 . 3 0 0.22
0.05 0.37
1992 21.74 - 0 . 4 7 0.07
0.00 0.80
0.36
0.16
-0.22
0.20
0.10
0.73
0.17
N
0.06 34
- 0 . 0 3 36
•0.05 35
-0.05 32
0.16 28
0.41 38
- 0 . 0 8 34
0.05 36
• 0.08 35
•0.05 32
28
0.43 38
0.42 38
i n 1989 was p o s i t i v e .1 5 T h e n i n 1992 t h i s effect was reversed, a negative
f a r m e r effect n o w accounting, v i r t u a l l y o n i t s o w n , for 4 1 per cent of t h e v a r i a n c e i n t h e L a b o u r vote. However, despite t h e recovery i n t h e L a b o u r vote, t h e r e was s t i l l no evidence of a w o r k i n g class effect. Table 7 also shows t h a t i n t r o d u c t i o n of t h e liberal/conservative variables i n t o t h e L a b o u r model produces no significant effects and no i m p r o v e m e n t i n t h e variance explained.
Explaining Support for the Workers' Party /Democratic Left
One has t o be more cautious w i t h t h i s k i n d of analysis of t h e W o r k e r s ' P a r t y / D e m o c r a t i c Left vote because of t h e smaller n u m b e r of cases (i.e., con stituencies) available for the analysis. However, the n u m b e r of constituencies contested since N o v e m b e r 1982 has been sufficient t o enable at least t e n t a t i v e conclusions t o be d r a w n .1 6 T h e r e s u l t s o f t h e a p p l i c a t i o n o f a t w o
-v a r i a b l e model (farmers a n d w o r k i n g class) shows f a i r l y consistent results for t h e 1980s — a s u b s t a n t i a l positive w o r k i n g class effect, a g r o w i n g negative f a r m e r or r u r a l effect a n d a g r o w i n g level of variance explained (from 20 per cent i n 1982 to 40 per cent i n 1989). B u t t h e n i n 1992 t h e p a t t e r n i n g s i m p l y disappears — t h e reduced support for w h a t was now t w o competing parties is a l m o s t c o m p l e t e l y u n p r e d i c t a b l e b y reference t o t h e socio-demographic characteristics of the constituencies.
I n t r o d u c t i o n o f t h e liberal/conservative v a r i a b l e has a considerable effect on t h e e x p l a n a t i o n o f t h e W o r k e r s ' P a r t y vote i n the 1980s. L i b e r a l i s m plays a s i g n i f i c a n t a n d s u b s t a n t i a l role i n a l l t h r e e elections a n d t h e r a n g e o f v a r i a n c e e x p l a i n e d moves u p w a r d s f r o m 4 1 t o 54 per cent. Also, once we c o n t r o l for t h e p o s i t i v e l i b e r a l effect, t h e w o r k i n g class effect o n W o r k e r s ' P a r t y s u p p o r t becomes even more pronounced a n d t h e a p p a r e n t l y negative f a r m e r effect becomes positive i n November 1982 a n d i n 1987. However, t h e liberal-conservative v a r i a b l e is of no use i n 1992 and t h e combined W o r k e r s ' P a r t y a n d Democratic Left support remains q u i t e u n s t r u c t u r e d .
One m i g h t hypothesise t h a t t h e l o w t o moderate levels o f p r e d i c t a b i l i t y o f t h e L a b o u r a n d W o r k e r s ' P a r t y / D e m o c r a t i c L e f t vote are due t o t h e c o m p e t i t i o n for t h e left vote between these p a r t i e s w i t h t h e p a t t e r n s of
15. One possible explanation for a n effect of this type would be the occurrence of a few large deviations caused by "big name" labour candidates r u n n i n g in r u r a l constituencies. We analysed the pattern of residuals from the regression to see i f this was the explanation but could not find conclusive evidence for it, although D i c k S p r i n g did produce such a n effect i n K e r r y North.
Proportion Constant Farmers Proportion Working Class Proportion Liberals 1983 (No to Abortion
Amendment) Proportion Liberals 1992 (Yes-Yes-No) Proportion Ultra-C'vatives 1992 (No-No-No) Proportion Pragmatists 1992 (Yes-Yes-Yes) Adjusted P? N
(a) socio-demographic Nov 1982 -1.36
variables
-0.11
0.33
0.66
0.04
0.20 20
1987 1989 -0.91 -1.77 0.19 0.08 -0.46 0.02 0.64 0.03 1.09 0.01 0.24 0.40 26 21
1992 2.94 -0.18
0.17
0.15
0.43
0.04 23
(b) socio-demographic Nov 1982 -34.05
and liberal-conservative variables
0.43 1.32 0.51 0.07 0.00 0.02
0.41 20
1987 -38.35 0.50
0.03
1.35
0.00
0.60
0.00
0.49 26
1989 -41.01 0.30
0.39
1.77
0.00
0.64
0.02
0.54 21
1992 -15.12 -0.11
0.67
0.42
0.15
0.30
0.21
0.08 23
1992 3.11 -0.16
0.38
0.17
0.44
-0.02
0.21
-0.01 23
1992 -0.21 -0.14
0.35
0.25
0.31
•0.21
0.52
0.02 23
strengths a n d weaknesses between the t w o sides h a v i n g more to do w i t h local or p e r s o n a l i t y factors t h a n w i t h socio-demographic factors. I f t h i s w e r e so, one w o u l d expect a c o n s i d e r a b l y g r e a t e r l e v e l o f p r e d i c t a b i l i t y i n t h e c o m b i n e d l e f t v o t e ( t h a t i s , s u p p o r t for L a b o u r , t h e W o r k e r s ' P a r t y , D e m o c r a t i c L e f t a n d J i m K e m m y ) . A p p l i c a t i o n of the two-variable model to t h e left vote i n t h e 1980s does n o t suggest t h a t t h i s is t h e case (Table 9). H o w e v e r , i n 1992 t h e p r e d i c t a b i l i t y o f t h e l e f t vote is h i g h e r t h a n t h e p r e d i c t a b i l i t y of e i t h e r of i t s component p a r t s a n d t h e equation is d o m i n a t e d by t h e n e g a t i v e f a r m e r effect. I n c l u s i o n of t h e l i b e r a l v a r i a b l e clarifies t h i s p i c t u r e considerably. I t shows a g r o w i n g p r e d i c t a b i l i t y of the left vote from N o v e m b e r 1982 on, w i t h s t r o n g positive w o r k i n g class a n d l i b e r a l effects. These c u l m i n a t e d i n 1992 w h e n these t w o variables explained 67 per cent of the variance i n t h e l e f t - w i n g vote.
I V C O N C L U S I O N
P r o b a b l y t h e m o s t s t r i k i n g f e a t u r e o f o u r analysis, l i k e t h a t of some p r e v i o u s w o r k , i s t h e absence o f any single s t r u c t u r e t h a t accounts for v a r i a t i o n s i n p a r t y s u p p o r t over t h e e n t i r e p e r i o d e x a m i n e d (1981-92). H o w e v e r , t h e a n a l y s i s does i d e n t i f y w a y s i n w h i c h p a r t y s u p p o r t has responded t o d i f f e r e n t p o l i t i c a l s t i m u l i i n d i f f e r e n t elections. I n t h e f i r s t place, i t i n d i c a t e s t h a t social class plays a changing role. M i d d l e class areas showed l o w e r support for F i a n n a F a i l between F e b r u a r y 1982 a n d 1987 b u t n o t i n t h e o t h e r t h r e e elections (1981, 1989 a n d 1992). Such areas showed m o r e s u p p o r t for F i n e Gael i n a l l the elections of t h e period. W h i l e w o r k i n g class areas d i d n o t produce any bonus for t h e L a b o u r P a r t y i n any o f t h e elections considered, t h e y d i d favour t h e W o r k e r s ' P a r t y between November 1982 a n d 1989 a n d t h e y show u p as a factor i n support for the combined left f r o m N o v e m b e r 1982 t o 1992. I n a d d i t i o n to these class factors, t h e u r b a n -r u -r a l cleavage is a mo-re o-r less pe-rsistent element i n t h e suppo-rt fo-r F i a n n a F a i l a n d F i n e Gael, b o t h p a r t i e s b e i n g stronger i n more r u r a l areas. T h e i m p a c t o f t h i s cleavage is, at f i r s t sight, p a r t i c u l a r l y evident i n 1992 w h e n t h e L a b o u r vote a n d especially t h e combined left vote were m u c h stronger i n t h e m o r e u r b a n c o n s t i t u e n c i e s . I n 1992, t h i s single v a r i a b l e ( p r o p o r t i o n o f f a r m e r s i n a constituency) produces levels o f variance explained w h i c h p o i n t t o considerable u r b a n - r u r a l contrasts between F i a n n a F a i l a n d F i n e Gael on t h e one h a n d a n d t h e l e f t - w i n g parties o n t h e other. However, t h i s account o f t h e 1992 election and, indeed, o u r u n d e r s t a n d i n g o f t h e role of b o t h t h e class a n d u r b a n - r u r a l cleavage generally, are f u n d a m e n t a l l y affected by consider i n g t h e i m p a c t o f a t h i r d v a r i a b l e — t h e liberal-conservative cleavage.
Proportion Proportion Proportion Liberals 1983 Proportion Ultra- Pragmatists
Constant
Proportion Farmers
Proportion Working Class
(No to Abortion Amendment) Liberals 1992 (Yes-YesNo) C'vatives 1992 (No-No-No) 1992 (Yes-Yes-Yes) Adjusted
R2 N
(a)socio-demographic variables
1981 10.82 - 0 . 0 9
0.37
0.35
0.35
0.01 34
F e b 1982 10.02 - 0 . 2 1
0.06
0.43
0.29
0.12 38
Nov 1982 11.62 - 0 . 2 7
0.02
0.51
0.21
0.19 36
1987 11.69 - 0 . 3 5
0.01
0.33
0.34
0.19 34
1989 10.88 - 0 . 1 5
0.39
0.85
0.05
0.09 29
1992 25.65 - 0 . 6 9
0.00
0.25
0.35
0.57 39
(b) socio-demographic and liberal-conservative variables 1981 - 2 . 9 8 0.12 0.64
0.64 0.19
0.21
0.36
0.01 34
F e b 1982 - 1 4 . 8 8 0.17
0.55
0.98
0.08
0.38
0.15
0.15 38
Nov 1982 - 2 4 . 8 1 0.32
0.31
1.27
0.02
0.56
0.05
0.26 36
1987 - 2 3 . 9 3 0.30
0.28
0.99
0.02
0.58
0.02
0.32 34
1989 - 5 7 . 5 5 1.16
0.00
2.13
0.00
1.10
O.00
0.46 29
1992 - 2 3 . 1 1 - 0 . 0 3
0.88
0.97
0.00
0.82
0.00
0.67 39
1992 28.78 - 0 . 4 1
0.01
0.48 0.07
- 0 . 4 1
0.01
0.63 39
1992 22.80 - 0 . 7 1
0.00
0.17
0.56
0.19
0.56
notable role i n November 1982 and, exactly 10 years l a t e r , i n the 1992 elec t i o n . I n t h e November 1982 election i t emerges as the d o m i n a n t e x p l a n a t i o n of v a r i a t i o n s i n F i a n n a F a i l s u p p o r t and, between t h e n a n d 1989 i t was a factor i n t h e g r o w i n g s u p p o r t for t h e W o r k e r s ' P a r t y . T h e n , i n t h e 1992 election i t h a d effects almost r i g h t across t h e board. I n c l u d i n g a measure of t h e l i b e r a l conservative cleavage shows t h a t election was n o t so m u c h a m a t t e r o f a n u r b a n r u r a l contrast or cleavage, t h o u g h elements of a n u r b a n -r u -r a l cont-rast -r e m a i n . E q u a l l y , i f not mo-re i m p o -r t a n t , was the conse-rvative s u p p o r t for F i a n n a F a i l a n d F i n e Gael a n d the l i b e r a l support for t h e com b i n e d left. Because social class a n d a t t i t u d e s to r e l i g i o u s - m o r a l issues are themselves r e l a t e d , t a k i n g t h e l i b e r a l conservative cleavage i n t o account i n 1992 also b r i n g s t h e class influences i n t o sharper relief, i.e., persisting m i d d l e class s u p p o r t for F i n e Gael a n d w o r k i n g class support for t h e combined left. I n sum, a l t h o u g h support for I r i s h political parties m a y n o t have a stable a n d consistent social basis, we can conclude t h a t i t is far from being u n s t r u c t u r e d , a l w a y s b e a r i n g i n m i n d t h a t t h e s t r u c t u r e is v a r i a b l e i n t e r m s of i t s content a n d i t s s t r e n g t h i n any g i v e n election. T h e i n t r i g u i n g p o i n t is t h a t b o t h the content a n d s t r e n g t h of t h e u n d e r l y i n g s t r u c t u r e of p a r t y support were most evident i n t h e m o s t recent election analysed. A n y r e a l l y f i r m conclusion m u s t a w a i t t h e n e x t election a n d t h e c o n f i r m a t i o n or otherwise t h a t i t w i l l b r i n g t h a t t h e 1992 election was more t h a n a n isolated episode.
REFERENCES
GALLAGHER, M . , 1976. Electoral Support for Irish Political Parties, 1927-1973, London and Beverly Hills: Sage Publications.
GARVIN, T., 1981. The Evolution of Irish Nationalist Politics, Dublin: Gill and Macmillan.
HARDIMAN, N . , and C.T. W H E L A N , 1994. "Values and Political Partnership", i n C.T. Whelan (ed.), Values and Social Change in Ireland, Dublin: Gill and Mac millan, pp. 136-186.
LAVER, M . , 1986. "Ireland: Politics w i t h Some Social Bases: an Interpretation Based on Aggregate Data", The Economic and Social Review, Vol. 17, No. 2, pp. 107-131. LAVER, M . , M . MARSH and R. SINNOTT, 1987. "Patterns of Party Support", i n
M . Laver, P. Mair and R. Sinnott. (eds.), How Ireland Voted: The Irish General
Election, 1987, Dublin: Poolbeg Press.
PARKER, A.J., 1982. "The 'Friends and Neighbours' Voting Effect i n the Galway West Constituency", Political Geography Quarterly, Vol. 1, pp. 243-262.
PYNE, P., 1969. "The Third Sinn Fein Party: 1923-1926", The Economic and Social
Review, Vol. 1, No. 1, pp. 29-50.
ROBINSON, W.S., 1950. "Ecological Correlations and the Behaviour of Individuals",
American Sociological Review, Vol. 15, pp. 351-357.
RUMPF, E., and A.C. HEPBURN, 1977. Nationalism and Socialism in Twentieth
RUMPF, E., 1959. Nationalismus und Sozialismus in Irland: Historisck-soziologischer
Versuch iiberdie irische Revolution seit 1918, Verlag Anton Hain K G . , Meisenheim
am Glan.
SACKS, P.M., 1970. "Bailiwicks, Locality, and Religion: Three Elements i n an I r i s h Dail Constituency Election", The Economic and Social Review, Vol. 1, No. 4, pp. 531-534.
SINNOTT, R., B. WALSH and B.J. Whelan, 1995. "Conservatives, Liberals and Pragmatists: Disaggregating the Results of the I r i s h Abortion Referendum^ of 1992", The Economic and Social Review, Vol. 26, No. 2, pp. 207-219.
SINNOTT, R., 1995. Irish Voters Decide: Voting Behaviour in Elections and
Referen-dums since 1918, Manchester: Manchester University Press.
A P P E N D I X I
Apportioned Vote in Five Stimulated Two-county Constituencies in November 1982 on the Basis of the Results of the 1979 Local Election in the Individual Counties, and the Discrepancy of the Apportioned Estimates from the Actual
November 1982 Results, for FF, FG, and Labour.
County Vote 1979
TVP 1982.2
Actual Vote 1982.2
% Vote % Discrepa (a) Fianna Fail
Meath 15,065 50,997 24,223 47.50 24,032 47. 12 -0.38
Louth 11,921 43,677 18,825 43.10 19,016 43. 54 0.44
Roscommon 13,444 32,804 17,483 53.30 16,316 49. .74 -3.56
Mayo 28,133 62,148 32,977 53.06 34,144 54. 94 1.88
Clare 20,689 45,250 25,406 56.15 26,185 57. 87 1.72
G a l w a y 33,509 82,138 43,189 52.58 42,410 51. 63 -0.95
Waterford 14,073 42,867 16,700 38.96 18,718 43. 66 4.71
Tipp. S. 12,550 32,211 18,710 58.09 16,692 51. 82 -6.26
Kildare 14,705 48,359 23,124 47.82 21,732 44. 94 -2.88
Wicklow 11,079 41,995 14,982 35.68 16,374 38. 99 3.31
(b) Fine Gael
Meath 10,369 50,997 18,490 36.26 16,525 32. 40 -3.85
Louth 10,489 43,677 14,751 33.77 16,716 38. 27 4.50
Roscommon 11,852 32,804 15,321 46.70 13,406 40. 87 -5.84
Mayo 25,939 62,148 27,424 44.13 29,339 47. .21 3.08
Clare 11,563 45,250 14,826 32.76 15,564 34, ,40 1.63