Temnikova, I, Or˘asan, C., Corpas Pastor, G., and Mitkov, R. (eds.) (2019)Proceedings of the 2nd Workshop on Human-Informed Translation and Interpreting Technology (HiT-IT 2019), Varna, Bulgaria, September 5 - 6, pages 105–115.
105
Human-Informed Speakers and Interpreters Analysis in the WAW Corpus
and an Automatic Method for Calculating Interpreters’ D´ecalage
Irina Temnikova1, Ahmed Abdelali2, Souhila Djabri3 and Samy Hedaya4
1Freelancer, Sofia, Bulgaria
2Qatar Computing Research Institute, HBKU, Doha, Qatar 3University of Alicante, Spain
4Translation and Interpretation Institute, HBKU, Doha, Qatar
.
1[email protected],2[email protected],
3[email protected],4[email protected]
Abstract
This article presents a multi-faceted anal-ysis of a subset of interpreted conference speeches from the WAW corpus for the
English-Arabic language pair. We
ana-lyze several speakers and interpreters vari-ables via manual annotation and matic methods. We propose a new auto-matic method for calculating interpreters’ d´ecalage (ear-voice span) based on Auto-matic Speech Recognition (ASR) and au-tomatic alignment of named entities and content words between speaker and inter-preter. The method is evaluated by two human annotators who have expertise in interpreting and Interpreting Studies and shows highly satisfactory results, accom-panied with a high inter-annotator agree-ment. We provide insights about the rela-tions of speakers’ variables, interpreters’ variables and d´ecalage and discuss them from Interpreting Studies and interpreting practice point of view. We had interesting findings about interpreters behavior which need to be extended to a large number of conference sessions in our future research.
1 Introduction
A key characteristics which speech-to-speech ma-chine translation systems strive to have is a good trade-off between accuracy of translation and low latency (Waibel and Fuegen, 2012; Bangalore et al.,2012). Latencyis defined as the delay be-tween the input speech and the delivered trans-lation (Niehues et al., 2016) and roughly corre-sponds to interpreter’s d´ecalage in human inter-preting.
While a number of engineering approaches are being proposed to reduce latency by in the same
time maintaining good automatic speech transla-tion quality (Waibel and Fuegen,2012;Bangalore et al.,2012;Sridhar et al.,2013b;Schmid and Gar-side,2005), few approaches are getting explicitly inspired by human interpreting, by learning from the strategies which interpreters employ in order to produce good quality translation (Niehues et al.,
2016;He et al.,2015;Sridhar et al.,2013a). In line with this area of research, starting with an initial objective to boost a speech machine translation system working with English/Arabic language pair (Dalvi et al.,2017) we conduct ex-periments on a subset of sessions from the WAW corpus (Abdelali et al.,2018) - a corpus of simul-taneously interpreted conference speeches, to get informed about interpreters’ behaviour and learn which strategies interpreters employ to maintain good output accuracy while in the same time not exceeding their delay from the speaker. Our task is complex, as we want to find a way in which hu-man expertise in interpreting can boost the perfor-mance of speech machine translation systems.
With this article, we are enriching our previous research (Temnikova et al., 2017;Abdelali et al.,
2018) and run an extensive multilateral analysis on a subset of WAW corpus interpreted sessions, be-fore extending to a large number of sessions. The aim of this article is to test how much and what information we can extract by a combined manual (expert) and automatic analysis and also to pro-pose a new automatic method for d´ecalage calcu-lation. We present the results of a manual evalu-ation run by two human experts on the points of reference generated by our d´ecalage method.
the source speech characteristics of several con-ference sessions (including the presence of noise and other interruptions), 2) several output vari-ables of interpreters (such as d´ecalage, average interpreters’ output speed, number of hesitations, repetitions and false starts) and we interpret our findings using the rich knowledge of a practitioner interpreter with background in Interpreting Stud-ies. We address all these issues with a combination of automatic methods and manual (expert) annota-tions of both speech recordings and speakers’ and interpreters’ transcripts. We link our new findings with the manually annotated interpreting strate-gies in the same subset of conference sessions by two human annotators (Abdelali et al.,2018; Tem-nikova et al.,2017), see Section3.
The rest of the article is structured as follows: Section 2 presents some of the relevant related work; Section 3introduces the data and the gen-eral methodology; Sections 4 and 5 present the analysis of source speeches (both manual annota-tion and automatic analysis of fluency indicators and external conditions tags); Sections6and8 dis-cuss the analysis of interpreter variables (d´ecalage and fluency indicators) and present our automatic d´ecalage calculation method; Section7shows an approximate analysis of speakers input rate and interpreters delivery rate (speaking speed). Sec-tion 9 provides the overall results discussion and Section10concludes the article.
2 Related Work
Interpreting corpora are used as a resource for research in both Interpreting Studies (IS) ( Ben-dazzoli and Sandrelli, 2009; Russo et al., 2018;
Defrancq, 2015) and in Machine Translation (MT) (Paulik and Waibel, 2009; Shimizu et al.,
2013; Sridhar et al., 2013a). Due to the differ-ent aims and available tools, the methods used for research in these two fields are somewhat dif-ferent. As we come from the MT research per-spective (but get inspired by IS), the related works which are the closest to us are He et al. (2016) and Sridhar et al. (2013a). He et al. (2016) run a corpus analysis on a parallel corpus of trans-lated and simultaneously interpreted text for the Japanese-English language pair. They use a ma-chine learning classifier (differently from us) in order to classify interpreters’ strategies in the text. The strategies that they examine are segmentation, passivization, generalization, and summarization
(similar to us). Sridhar et al. (2013a) performs a corpus analysis of the EPIC corpus ( Bendaz-zoli and Sandrelli,2005) investigating interpreters strategies and behaviour for the English-Spanish language pair. They analyze features such as d´ecalage, compression (somewhat corresponding to our summarizing and omissions), hesitations, some discourse features (e.g. analysis of the use of pronouns). Their paper makes an overview of the whole corpus for these features, without link-ing the features as potentially causlink-ing one another and without entering in details and analyzing spe-cific sessions, as our paper does.
Calculation of D´ecalage Most of the Inter-preting Studies approaches for calculating inter-preters d´ecalage involve manual input: there can be manual adding of tags while using software to display aligned segments and play speaker’s and interpreter’s recordings (Defrancq,2015;Lee,
2002). Some researchers use the EXMARaLDA
platform1. Although humans can usually make deeper choices than machines, manual methods take a lot of efforts. The automatic approaches in-clude Sridhar et al. (2013a) and Ono et al. (2008). The most important issue in calculating inter-preters d´ecalage is deciding on the measurement units and points of reference (Defrancq, 2015;
Timarov´a et al., 2011). Measuring units can be words or seconds. The points of reference vary: e.g. end of a speaker’s and start of interpreter’s content word (Ono et al., 2008), words with lit-eral translation (Ol´eron and Nanpon, 1965), ev-ery 5 seconds, beginning of segments where at least one interpreter omitted more than 15 words, beginning of sentence, units of meaning ( Podha-jsk´a, 2008) and “segments correspondence based on content, instead only on simple lexical equiva-lence” (Barik,1973). Our measurement units are seconds, and reference points are selected aligned words (see Section6.1). Our method differs from Sridhar et al. (2013a) as we removed the stop words and used content words and Named Entities (for NEs we also differ from Ono et al., 2008). We also differ from both approaches as we run eval-uation of our d´ecalage method reference points alignment with two expert human annotators.
3 General Methodology
Data Selection - The WAW Corpus: For all ex-periments and analysis we used the recordings
and transcripts of conference speeches and of in-terpreters from the WAW corpus for the source
language English and target Arabic. The WAW
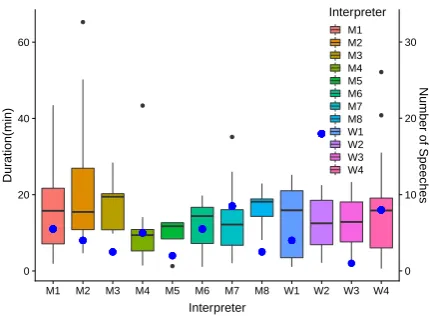
corpus is a conference interpreting corpus col-lected from three conferences which took place in Qatar in 2013-2014: WISE 2013 (World In-novation Summit for Education), ARC’14 (Qatar Foundation’s Annual Research and Development Conference), and WISH 2013 (World Innovation Summit for Health). Most speeches (133) have as source language English, target Arabic, with very few (7) having source language Arabic and target English. The WAW corpus was collected in or-der to train the QCRI’s2speech-to-speech machine translation system. It is composed of the record-ings of both the conference speeches and inter-preters (collected from interinter-preters’ booths), their transcripts (obtained from transcription agencies), and the translations of the transcripts into the op-posite language. The transcripts were manually annotated with tags3. For more details see Ab-delali et al. (2018). The WAW corpus currently contains information such as: recordings length in seconds, interpreters’ gender, topics, length of transcripts in words, number of tags in each tran-script (both for speakers and interpreters). The corpus does not contain the names, nor any per-sonal information about speakers and interpreters, the number of speakers or interpreters per ses-sion, prosody annotation. It has not been Part-of-Speech (POS) tagged nor syntactically parsed. We do not also know any details about the way con-ference interpreting was organized, e.g. if inter-preters were given the speeches to get prepared be-fore interpreting took place. In total there were 12 interpreters, some of which interpreted more than one speech. See Figure1for number of speeches per interpreter and average session duration.
In Abdelali et al. (2018) and Temnikova et al. (2017) a subset of source and target tran-scripts were manually annotated for some inter-preting strategies (as sequences of words): addi-tions, omissions, self-correcaddi-tions, and summariz-ing. The results were showing omissions as high-est number of strategies (Korpal,2012), followed by additions (see Figure5).
Data Selection - Speeches Used in this Paper:
The interpreted conference sessions analyzed in this paper are all for the English-Arabic language
2
Qatar Computing Research Institute (QCRI).
3Transcription instructions with tags definition:
http://tiny.cc/WAWTranscriptionTags.
0 20 40 60
0 10 20 30
M1 M2 M3 M4 M5 M6 M7 M8 W1 W2 W3 W4
Interpreter
Dur
ation(min)
Number of Speeches
Interpreter
[image:3.595.311.526.62.220.2]M1 M2 M3 M4 M5 M6 M7 M8 W1 W2 W3 W4
Figure 1: Average session length and number of speeches ( ) per interpreter in the WAW Corpus.
direction. The majority of experiments (except for the speed comparison for the whole corpus) an-alyzefive interpreted conference sessions, which were a subset of the sessions which we used in our previous research (Abdelali et al.,2018; Tem-nikova et al.,2017). Out of the 5 sessions two were from the same male interpreter (M7) and three from two female interpreters (W2 and W4). Male and female interpreters were selected in order to be able to analyze potential gender differences. Table2shows the duration in minutes of these ses-sions and the speakers and interpreters transcripts lengths in words. The selection criteria were the following:
1. M7, W2, and W4 were the interpreters, which had the highest numbers of sessions inter-preted (see the blue dots in Figure1).
2. There was a large difference in the number of annotated interpreting strategies in these transcripts (see Figure5): in M7-T2 the inter-preter employed the highest number of strate-gies, compared to all interpreter-transcript pairs, while in M7-T1 the interpreter em-ployed the lowest number of strategies.
3. Similarly, W2-T2 had the lowest strategies employed by a female interpreter, while W4-T1 had the highest total number of strategies. W2-T1 was added to create a comparison be-tween two very different sessions of the same interpreter as for M7.
edu-cation (M7-T1), MOOCs (M7-T2), online educa-tion (W4-T1) and the general conference ARC’14 (W2, topics: W2-T2 - energy and environment, W2-T1 - traffic road accident).
Human Annotators: In Sections 4 (manual analysis of source speeches) and6.1(manual eval-uation of d´ecalage) we have relied on two anno-tators (A1 and A2), who both had research ex-perience in Interpreting Studies. In addition, A1 completed studies in translation strategies and A2 has practitioner experience as a simultaneous in-terpreter and a degree in Interpreting Studies. Both annotators have advanced knowledge of English and native Arabic. We also consulted A3, who is a practitioner conference interpreter in Qatar with English and Arabic as source languages.
Methods Overview: Thesource speech char-acteristics that we analyze are: 1) environ-ment conditions: noise, music, quality of sound 2) speakers variables: number of speakers, top-ics, speech intelligibility, (dis)fluency, accent, in-put rate, technicality of the topic. We have se-lected these variables in line with the IS state-of-the-art research, e.g. (Moser-Mercer, 1996; Pio,
2003; Plevoets and Defrancq, 2016; Fern´andez,
2015;Cecot, 2001). The interpreters variables which we analyze are: number of hesitations, false starts, repetitions, strategies used, delivery rate, d´ecalage.
We use automatic methods for calculating the number of tags in the transcripts, to compute the speaking speed of speakers and interpreters, and for computing d´ecalage. We use manual methods for evaluating the clarity and challenges in source recordings, for expert feedback on interpreters be-haviour, and for manual evaluation of the d´ecalage method. We compare all these new findings with our previous results of manual annotation of inter-preting strategies (see Figure5from our previous article).
4 Analysis of Source Speeches - Manual Analysis
Method and Settings: The manual analysis of source speeches consisted in both annotators lis-tening to the five recordings and entering values for several criteria and free text comments in an Excel spreadsheet form. The criteria (with avail-able values) included sound quality (very good,
good, bad), speech intelligibility (clear, medium,
difficult to understand), (dis-)fluency (fluent, not
fluent), number of topics, speakers’ accent (strong
foreign accent, accent, no accent), speakers’ speed
(normal, fast, slow - as perceived by the
annota-tor), number of speakers, topic technicality of the source recording (very technical, somewhat
tech-nical, very few technical words, not technical).
Results: The manual analysis results are avail-able online4. The cells in green show the points
in which both annotators agreed. As we are aware that some of these criteria are not concretely de-fined, we run an objective automatic analysis (see
Section 5). The feedback of A1 and A2 was
that: M7-T1 and W2-T2 consisted in a conference presentation (with or without the session chair recorded), and W2-T1, W4-T1, and M7-T2 were panels; W2 were two women interpreters, who changed; in M7-T1 the speaker was reading and the interpreter was prepared; in W2-T2 the inter-preter applied anticipation. As it can be seen from the online form, there is difference between the two annotators. What they mostly agree about is speech intelligibility, (dis)fluency, number of topics, number of speakers, topic technicality of the source speech, and a bit on speaker’s speed. Specifically, M7-T1 had 1 speaker, M7-T2 was a panel with 8 speakers, W2-T1 had 6 or 7 speak-ers, W2-T2 had 2 speakers (one moderator), and W4-T1 had 6 speakers and was the only speech recording to have 3-4 topics.
5 Analysis of Source Speeches - Tags Analysis
Method and Settings: In order to complement the analysis in Section4with more objective nu-merical results, we counted the number of tags in the source recordings transcripts which were man-ually annotated by professional transcribers. In or-der to make the results comparable, we normalized the tags numbers per transcript length (divided per number of words) and then multiplied by 1000 to get a higher (but still comparable) numbers. Ta-ble1shows the tags and their definitions.
Our hypothesis is, as described by state-of-the-art research, that the presence of at least some of these tags may create challenges for interpreters (e.g. if the speakers make false starts [FALSE], hesitate [HES], repeat or correct themselves [REP] or if there is noise and music).Unidentifiableis an important tag, as if a word or phrase is not
under-4A1 and A2 manual speakers analysis is available at:
Tag [FALSE] [REP] [INTER] [HES] [INTERJ] [BREATH]
Meaning False start Repetition or Correction Interruption Hesitation Interjection Breathing
Tag [LAUGH] [APPLAUSE] [MUSIC] [NOISE] [NE] [UNK]
[image:5.595.122.480.62.121.2]Meaning Laugh Applause Music Noise Named Entity Unidentifiable
Table 1: Tags annotated in WAW transcripts.
standable by transcribers it may also be such for interpreters. We also counted the Named Entities (NEs), as they correspond to names of people, lo-cations and organizations and interpreters are usu-ally supposed to render them correctly.
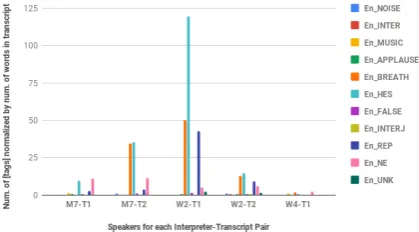
Results: We displayed only those tags whose
value is above 0. Figure 2 shows the amount
[image:5.595.78.288.375.491.2]of tags per source recording which interpreters had to deal with (here we refer to recordings as “interpreter-transcript pair” for consistency). As it can be seen, the source recording with most tags was interpreted by W2 (W2-T1), the second one was M7-T2, while the source recording corre-sponding to W4-T1 had nearly no source speech tags at all.
Figure 2: Number of transcription tags for the source speech of each session (normalized by number of words in the source transcript).
6 Analysis of Interpreters D´ecalage
In this section we propose a new automatic method for calculating the d´ecalage of interpreter from speaker(s).
Gillies(2018) defines d´ecalage as “the time dif-ference between what the speaker says and its re-production by the interpreter in the target
lan-guage”.
We want to be able to access interpreters’ d´ecalage in the WAW corpus for two reasons: 1) to determine when and how often in our data longer d´ecalage is used as a strategy (Cecot,2001; Moser-Mercer,1997) and 2) to take it into account when analyzing the potential cognitive difficulties of
in-terpreters. In fact longer d´ecalage is generally to be avoided by interpreters as they should then keep more information in short-term memory and accuracy may significantly decrease (Lee, 2002). This is especially valid for interpreting between languages with highly different syntactic struc-tures (Lee, 2002; Barik, 1975; Gile, 1997) such as English and Arabic (Bassam et al.,2014;Badr et al.,2009). Thus keeping d´ecalage short can also be considered as an interpreting strategy.
Although d´ecalage is an important feature and we wanted to implement it previously, we had a number of obstacles before being able to build
this method. The biggest challenges were
re-lated to aligning source speech transcripts and in-terpreters transcripts. In fact inin-terpreters transfer meaning and can completely restructure speaker’s speech, make omissions, add words, and use com-pletely different words than the standard transla-tion equivalents.
Also, the alignment needed to be done at word level, which turned out to be very cumbersome and tedious to be performed manually; hence resorting to automatic alignment methods was a better op-tion. This task had to include building or acquir-ing Automatic Speech Recognition (ASR) systems for both English and Arabic languages, to be able to automatically recognize words and mark them with their appropriate time-stamps.
6.1 Analysis of Interpreters: D´ecalage -Method and Evaluation
Transcripts alignment: The source speech and interpreters’ transcripts were aligned by time and words-anchors were extracted using a bilingual dictionary. The anchors are Named Entities (NEs) and words that carry meaning (content words) -as opposed to frequent and functional words. We obtained the content words and NEs from the out-put of the part-of-speech (POS) taggers. To carry the alignment, we force-aligned the transcripts us-ing our in-house ASR system (Khurana and Ali,
POS tagging:Next, we used the part-of-speech tagger module of Farasa (Darwish et al.,2017) to POS tag the Arabic transcripts, and the Stanford POS tagger (Toutanova et al.,2003) for English. Additionally, we acquired a bilingual dictionary that was used for the alignment. The dictionary contains around 20k entries.
Computation of d´ecalage: We compute d´ecalage as the time between when the speaker pronounces a specific named entity (NE) or a con-tent word and when the interpreter pronounces it (or its correspondent) using the onset reference. This time difference reflects the delay between when the interpreter hears a concept and when he is able to produce its correspondence in the target language.
Limitations of the Automatic D´ecalage Es-timation Method: There might be instances in which the approach would not capture this lapse and the availability of these indicators could vary, based on the strategies that the interpreter choose to use. For example, the interpreter might choose to use a pronoun to replace a NE or a concept that was mentioned earlier (e.g. in cases of
summa-rizing or omission). This will impact the
num-ber of anchors that are available for assessment and their alignment. Another inherent issue re-lated to the source and target language pair is when the sentences are reordered differently between the source and target languages. We hypothesize that this would not be a major concern as this addi-tional d´ecalage could be shared across all tran-scripts/interpreters with the same language pair; but it might impact the comparison with other lan-guage pairs.
D´ecalage Method Evaluation: In order to test if our d´ecalage calculation method is giving cor-rect results, we run manual evaluation with our
two annotators A1 and A2. D´ecalage was run
on 16 interpreter-transcript pairs (two per inter-preter, with two male interpreters - M7 and M1 and two female interpreters - W2 and W4), result-ing in a total of 874 aligned d´ecalage anchor word pairs. We selected semi-randomly from them 20 snippets of 10 consecutive lines (a total of 199). The snippets contained a representative variety of issues: named entities (person names, organiza-tions, countries), content words (nouns, adjectives, verbs, adverbs), function words (like determiners and pronouns), several words which speakers re-peated. The annotators had to label each aligned
word pair by providing a label among: Valid,
In-valid,Somewhat validandI don’t know.
Annota-tors were informed to not look for correct word translations only (as interpreters transfer sense), but to also check if the two words are equivalent in terms of being a part of groups of words, in which the speaker and interpreter talk about the same. We then compared their results and run inter-annotator agreement comparison. The evalu-ation showed that A1 marked193 (96.98%) pairs as Valid, 0 as Invalid, 3 as Somewhat valid, and 3 as “I don’t know”. A2 labeled185 (92.96%) pairs as Valid, 14 as Invalid, 0 as Somewhat valid and 0 as “I don’t know”. In terms of inter-annotator agreement,the annotators agreed on 182 out of 199 pairs (both labeled as Valid); 11 had the combination Invalid (A2)-Valid (A1); 3 were In-valid (A2)-Somewhat In-valid (A1) and 3 - Valid (A2)-“I don’t know” (A1)5.
6.2 Analysis of Interpreters: D´ecalage -Results
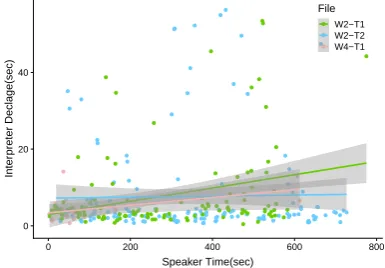
Figure3shows the anchor-based d´ecalages for the two sessions of the male interpreter M7, while Fig-ure4- for the female interpreters W2 and W4. The dots are the single d´ecalages per anchored pair, the line is the average d´ecalage over time, and the width of the grey shaded area indicates the varia-tion.
It is clear from Figure 3 that the d´ecalages in M7-T1 are mostly small – Median of 3.630 secs and Mean of 4.235 secs (in light green); while in M7-T2 (in light blue) the dots are much more spread around and there are many more instances in which the d´ecalage (delay) is high and has a Median of 5.250 secs and a Mean of 5.838 secs.
Figure 4, shows one session of interpreter W4 (W4-T1) and the two sessions of interpreter W2 (W2-T1 and W2-T2). While W2’s d´ecalage in T2 looks consistent (constant) across the whole ses-sion with a Median of 3.880 secs and a Mean of 4.874 secs (light blue line), W4 starts with a lower d´ecalage but there is a significant increase in the delay as time passes (pink line). Something simi-lar with a much steeper increase in Figure4can be observed for W2 in T1 (W2-T1, light green line), for which the ending d´ecalage is approximately 14 seconds vs 2 seconds in the beginning.
5We run Cohen’s kappa, but received a surprisingly low
0 20 40 60
0 250 500 750
Speaker Time(sec)
Inter
preter Declage(sec)
[image:7.595.308.525.63.231.2]File M7−T1 M7−T2
Figure 3: Comparison of interpreter’s d´ecalage be-tween the two sessions of male interpreter (M7).
0 20 40
0 200 400 600 800
Speaker Time(sec)
Inter
preter Declage(sec)
File W2−T1 W2−T2 W4−T1
Figure 4: Comparison of interpreter’s d´ecalage be-tween the sessions of female interpreters.
As shown above, while the process can be fully automated, challenges that are related to the do-main and the availability of an ASR system that can provide the feeds are a major issue. Addition-ally, the accuracy of the lexicons is the weakest link of the proposed approach. The availability of this type of resource is strictly dependent on the language pair as well as on the domain. On the other hand, efforts by volunteers carrying the task of manually curating these resources and expand-ing them is a solution and a warranty for the ap-proach.
7 Analysis of Speakers’ and Interpreters’ Speaking Speed
[image:7.595.86.276.65.200.2]Method and Settings: As the manual annota-tion of speakers’ speed in source recordings in Section4did not show much agreement between annotators (also because no objective definition was given), we wanted to complement our anal-ysis with a more objective numerical approach. In this section we present an approximative calcula-tion of average speaking speed per session of both
Figure 5: Annotated Strategies normalized by the transcript length in words for each session.
speakers (input rate) in source language record-ings and interpreters. We do that by dividing the number of words in each transcript by the length of recordings in minutes. We do this first for the five speeches under consideration, and then in order to validate our approach and get general observations - for all the WAW corpus En-Ar speeches.
We realize that this is an approximative mea-sure, as 1) speaking speed could vary during the session and 2) there are sessions with sev-eral speakers and/or interpreters. In future work we will use d´ecalage’s anchor points to calculate speaking speed in a more accurate way.
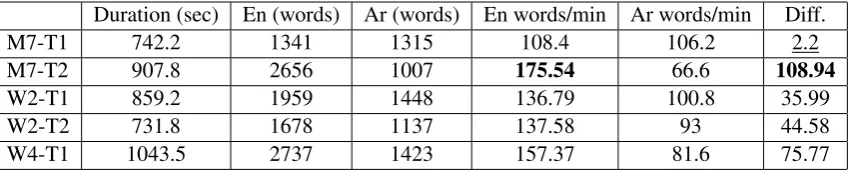
Results: Table 2 shows the results for the 5 sessions. The highest conference speakers’ input rates (see column “En (words)”) are in descending order for M7-T2, W4-T1, and W2-T2 (which were also indicated by A1 asfastspeakers). The source speed of W2-T1 is nearly the same as for W2-T2, and M7-T1 is clearly the lowest speed. For mat-ters of conformity with related work, we have con-verted the source input rate (speakers speed) into words/minute. According to (Pochhacker,2015), an input rate of 100-120 words per minute is con-sidered as “comfortable speech rate” (Pochhacker,
[image:7.595.85.278.253.387.2]the lowest speaker’s speed and the highest inter-preter’s speed (also close to speaker’s speed); M7-T2 has the highest speaker’s speed and the lowest interpreter’s speed. In terms of difference between speakers’ speed and interpreter’s speed M7-T2 has the highest value of 108.94 and the lowest differ-ence value is 2.2 for M7-T1 (which means that in average the interpreter is moving almost at the same speed as speaker). It can be also seen that in M7-T1 speaker’s (En) and interpreter’s (Ar) num-ber of words is nearly the same (differently from the other 4 recordings). According to A2’s feed-back in Section4 in M7-T1 the speaker is read-ing (no spontaneous speech element) and the inter-preter seems well prepared (according to both an-notators the interpreter rendered correctly all sta-tistical details), and thus most probably had the speech beforehand.
In order to have a wider picture of what our approximate speed calculation method generates, Figure 6 shows the approximate speaking speed results for all source and interpreters recordings in the WAW corpus for the interpreting direction En-Ar. Clearly there is a repeated general tendency across all speeches with the speed of interpreters being generally lower (around 1/2 from the speed of the source language speaker(s)).
Figure 6: Speakers and Interpreters average speed for English into Arabic.
8 Analysis of Interpreters - Tags
Method and Settings: Similarly to speakers, we counted the number of tags in the interpreters (tar-get language) recordings transcripts which were manually annotated by professional transcribers during transcription. We applied exactly the same method which we used for speakers (described in Section 5). We analyzed the same tags as in Ta-ble 1. We base our analysis on the assumption
that hesitations, repetitions and false starts in inter-preters’ transcripts may show that the interpreter is challenged (Cecot, 2001). For example, it is known that hesitation pauses and other disfluen-cies of interpreters can be caused by difficulties in syntactic and lexical planning of discourse (Cecot,
2001). For matters of consistency we analyze all the available tags.
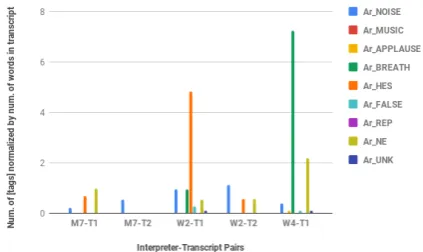
[image:8.595.312.524.298.424.2]Results: Figure7shows the distribution of tags per interpreter-transcript pair. As in Figure2, only existing tags are displayed. Clearly W2-T1 and W4-T1 have the highest number of tags. W2-T1 has an exceptionally high number of hesitations and W4-T1 has an exceptionally high number of breathing annotated. The lowest number is for M7-T2 which has only some [NOISE] tags.
Figure 7: Number of transcription tags for the in-terpreter’s output for each session (normalized by number of words in the interpreter’s transcript).
9 Discussion
Analysis of interpreters: W2 interpreted the highest number of sessions (see Figure 1). Next are M7 and W4. The average session length for W4 is higher than of M7 and slightly higher than W2. In M7-T1 and M7-T2, speaker’s input rate and interpreter’s speaking speed confirm the large difference in strategies used by M7 (see Figure5). Also, the highest input rates in M7-T2 and W4-T1 could explain the largest number of omissions in these two interpreters’ sessions.
Analysis of speaker-interpreter combina-tions:
M7-T1 - 1 speaker (speaker reading and inter-preter prepared), second shortest duration. Had a low number of annotated strategies (additions, omissions and summarizing), constant d´ecalage from speaker of in average 3-4 seconds.
[image:8.595.76.293.444.579.2]Duration (sec) En (words) Ar (words) En words/min Ar words/min Diff.
M7-T1 742.2 1341 1315 108.4 106.2 2.2
M7-T2 907.8 2656 1007 175.54 66.6 108.94
W2-T1 859.2 1959 1448 136.79 100.8 35.99
W2-T2 731.8 1678 1137 137.58 93 44.58
[image:9.595.88.514.62.148.2]W4-T1 1043.5 2737 1423 157.37 81.6 75.77
Table 2: Speakers and interpreters speed (rounded) in the 5 analyzed speeches.
speakers’ [BREATH] and [HES]. Interpreter had no tags, except for some [NOISE]. Had the high-est number of annotated omissions (see Figure5) and had also additions and self-corrections. This is the session with highest input rate and the in-terpreter with lowest speed. Inin-terpreter must have skipped a lot (and used some generalizations ac-cording to A1) to maintain low speed. As we have seen in Figure3 his d´ecalage is higher and is in-creasing with the duration of the session. Accord-ing to A2 the interpreter seems to be usAccord-ing silence and pauses to keep d´ecalage lower.
W2-T1 - panel (2 interpreters), the speaker had a high number of hesitations [HES], breathing [BREATH] and repetitions [REP] (see Figure 2). The interpreter had a relatively high number of [HES]. So, there was a high number of hesitations in both speakers and interpreter (compare Figures
2and7). Had a much higher number of omissions and higher number of additions than W2-T2. We see a steep increase in d´ecalage which ends with over 14 seconds.
W2-T2 1 speaker (2 interpreters), shortest recording duration. Interpreter applied anticipa-tion. Very technical speech, speakers talked with lower voice. The lowest number of strategies (but all 4 are used). Had a nearly constant d´ecalage (a bit increasing towards the end) of in average 3-4 seconds.
W4-T1 - panel, longest duration. The inter-preter had a high number of [BREATH] and the highest number of NEs, which visibly does not correspond to the number of NEs in the speak-ers’ transcript. Further analysis of the [NE] tag is necessary. Has a large number of omissions anno-tated. D´ecalage is also increasing, but not so steep as for W2-T1. Also here, the speakers’ average input rate (according to our calculations) is high.
10 Conclusions and Future Research
Our aim was to test what amount and quality of insights we can gather from the WAW corpus with our new methods - a combination of automatic
ap-proaches and interpreters expertise. We presented an automatic d´ecalage method which was tested on the English-Arabic language pair and showed to have high evaluation results from two expert hu-man annotators.
We analyzed in detail five conference sessions (as they had interpreting strategies manually an-notated) and provided general observations about multiple interpreters. We discovered that the de-pendence between speakers’ variables (e.g. in-put rate and hesitations) and interpreters variables (e.g. d´ecalage and strategies used) is very com-plex.
We found that: 1) manual expert analysis of an experienced researcher with interpreting and Inter-preting Studies background enormously enriches automatic analysis findings; 2) the data existing in our corpus, accompanied by the new automatic d´ecalage method provides rich insights.
Our analysis showed that among the issues that create challenges for interpreters and may gener-ate increasing d´ecalage and a higher amount of used strategies are: 1) large number of speakers; 2) spontaneous speech (as in question-answering sessions and panels vs prepared presentations or reading); 3) speakers’ hesitations and repetitions; 4) high speakers input rate (see especially W4-T1 and M7-T2). We also found out that interpreters have much lower speaking speed than speakers’ input rate, which adds to our previous and cur-rent observations that interpreters usually generate much fewer words.
As future work we need to run our experiments on a larger number of conference sessions to get general observations, to deepen our analysis of in-put rate and interpreters’ delivery rate and test our methods on other corpora and language pairs.
11 Acknowledgements
References
Ahmed Abdelali, Irina Temnikova, Samy Hedaya, and Stephan Vogel. 2018. The WAW Corpus: The First Corpus of Interpreted Speeches and their Trans-lations for English and Arabic. In LREC 2018. (ELRA), Miyazaki, Japan.
Ibrahim Badr, Rabih Zbib, and James Glass. 2009. Syntactic phrase reordering for english-to-arabic statistical machine translation. In Proceedings of the 12th Conference of the European Chapter of the Association for Computational Linguistics. Associ-ation for ComputAssoci-ational Linguistics, pages 86–93.
Srinivas Bangalore, Vivek Kumar Rangarajan Srid-har, Prakash Kolan, Ladan Golipour, and Aura Jimenez. 2012. Real-time incremental speech-to-speech translation of dialogs. In Proceedings of the 2012 Conference of the North American Chapter of the Association for Computational Linguistics: Human Language Technologies. Association for Computational Linguistics, pages 437–445.
Henri C Barik. 1973. Simultaneous interpretation: Temporal and quantitative data. Language and speech 16(3):237–270.
Henri C Barik. 1975. Simultaneous interpretation: Qualitative and linguistic data. Language and speech 18(3):272–297.
Hammo Bassam, Moubaiddin Asma, Obeid Nadim, and Tuffaha Abeer. 2014. Formal description of arabic syntactic structure in the framework of the government and binding theory. Computaci´on y Sistemas 18(3):611–625.
Claudio Bendazzoli and Annalisa Sandrelli. 2005. An approach to corpus-based interpreting studies: Developing EPIC (european parliament inter-preting corpus). In MuTra 2005–Challenges of Multidimensional Translation: Conference Proceedings. pages 1–12.
Claudio Bendazzoli and Annalisa Sandrelli. 2009. Corpus-based interpreting studies: Early work and future prospects. Tradum`atica: traducci´o i tecnologies de la informaci´o i la comunicaci´o 1(7).
Michela Cecot. 2001. Pauses in simultaneous inter-pretation: A contrastive analysis of professional in-terpreters performances. The inin-terpreters newsletter 11:63–85.
Fahim Dalvi, Yifan Zhang, Sameer Khurana, Nadir Durrani, Hassan Sajjad, Ahmed Abdelali, Hamdy Mubarak, Ahmed Ali, and Stephan Vogel. 2017. QCRI live speech translation system. EACL 2017 page 61.
Kareem Darwish, Hamdy Mubarak, Ahmed Abdelali, and Mohamed Eldesouki. 2017. Arabic pos tag-ging: Dont abandon feature engineering just yet. In Proceedings of the Third Arabic Natural Language Processing Workshop. pages 130–137.
Bart Defrancq. 2015. Corpus-based research into the presumed effects of short EVS. Interpreting 17(1):26–45.
Emilia Iglesias Fern´andez. 2015. Making sense of in-terpreting difficulty through corpus-based observa-tion. Interpreting Quality: A Look Around and Ahead 19:35.
Daniel Gile. 1997. Conference interpreting as a cognitive management problem. Applied Psychology-London-Sage- 3:196–214.
Andrew Gillies. 2018. Conference Interpreting: A Students Practice Book. Routledge.
He He, Jordan L Boyd-Graber, and Hal Daum´e III. 2016. Interpretese vs. translationese: The unique-ness of human strategies in simultaneous interpreta-tion. In HLT-NAACL. pages 971–976.
He He, Alvin Grissom II, John Morgan, Jordan Boyd-Graber, and Hal Daum´e III. 2015. Syntax-based rewriting for simultaneous machine translation. In Proceedings of the 2015 Conference on Empirical Methods in Natural Language Processing. pages 55– 64.
Sameer Khurana and Ahmed Ali. 2016. QCRI ad-vanced transcription system (QATS) for the Arabic multi-dialect broadcast media recognition: MGB-2 challenge. In Spoken Language Technology Workshop (SLT), 2016 IEEE.
Paweł Korpal. 2012. Omission in simultaneous interpreting as a deliberate act, Intercultural Studies Group Universitat Rovira i Virgili, chapter 9, pages 103–111.
Tae-Hyung Lee. 2002. Ear voice span in english into korean simultaneous interpretation. Meta: Journal des traducteurs/Meta: Translators’ Journal 47(4):596–606.
Barbara Moser-Mercer. 1996. Quality in interpreting: Some methodological issues. LINT.
Barbara Moser-Mercer. 1997. Beyond curiosity: Can interpreting research meet the challenge? In G.M. Fountain J.H. Danks, G.M. Shreve and M.K. McBeath, editors, Cognitive Processes in Translation and Interpreting. Sage Publications, London, pages 176–195.
Jan Niehues, Thai Son Nguyen, Eunah Cho, Thanh-Le Ha, Kevin Kilgour, Markus M¨uller, Matthias Sper-ber, Sebastian St¨uker, and Alex Waibel. 2016. Dy-namic transcription for low-latency speech transla-tion. In Interspeech. pages 2513–2517.
Takahiro Ono, Hitomi Tohyama, and Shigeki Matsub-ara. 2008. Construction and analysis of word-level time-aligned simultaneous interpretation corpus. In LREC 2008.
Matthias Paulik and Alex Waibel. 2009. Automatic translation from parallel speech: Simultaneous inter-pretation as mt training data. In Automatic Speech Recognition & Understanding, 2009. ASRU 2009. IEEE Workshop on. IEEE, pages 496–501.
Sonia Pio. 2003. The relation between st delivery rate and quality in simultaneous interpretation. The Interpreters Newsletter 12:69–100.
Koen Plevoets and Bart Defrancq. 2016. The effect of informational load on disfluencies in interpreting. Translation and Interpreting Studies. The Journal of the American Translation and Interpreting Studies Association 11(2):202–224.
Franz Pochhacker. 2015. Routledge encyclopedia of interpreting studies. Routledge.
Kvˇeta Podhajsk´a. 2008. Time lag in simultaneous in-terpretation from english into czech and its depen-dence on text type. Folia Translatologica 10:87– 110.
Mariachiara Russo, Claudio Bendazzoli, Bart De-francq, et al. 2018. Making way in corpus-based interpreting studies. Springer.
Philipp H Schmid and Adrian Garside. 2005. Method and apparatus for reducing latency in speech-based applications. US Patent 6,961,694.
Hiroaki Shimizu, Graham Neubig, Sakriani Sakti, Tomoki Toda, and Satoshi Nakamura. 2013. Con-structing a speech translation system using si-multaneous interpretation data. In Proceedings of International Workshop on Spoken Language Translation (IWSLT).
Vivek Kumar Rangarajan Sridhar, John Chen, and Srinivas Bangalore. 2013a. Corpus analysis of si-multaneous interpretation data for improving real time speech translation. In INTERSPEECH. pages 3468–3472.
Vivek Kumar Rangarajan Sridhar, John Chen, Srinivas Bangalore, Andrej Ljolje, and Rathinavelu Chengal-varayan. 2013b. Segmentation strategies for stream-ing speech translation. In Proceedstream-ings of the 2013 Conference of the North American Chapter of the Association for Computational Linguistics: Human Language Technologies. pages 230–238.
Irina Temnikova, Ahmed Abdelali, Samy Hedaya, Stephan Vogel, and Aishah Al Daher. 2017. In-terpreting strategies annotation in the waw corpus. RANLP 2017 page 36.
S´arka Timarov´a, Barbara Dragsted, and Inge G Hansen. 2011. Time lag in translation and inter-preting: A methodological exploration. Methods
and strategies in process research: Integrative approaches in translation studies pages 121–146.
Kristina Toutanova, Dan Klein, Christopher D Man-ning, and Yoram Singer. 2003. Feature-rich part-of-speech tagging with a cyclic dependency net-work. In Proceedings of the 2003 Conference of the North American Chapter of the Association for Computational Linguistics on Human Language Technology-Volume 1. Association for computa-tional Linguistics, pages 173–180.
Alexander Waibel and Christian Fuegen. 2012. Si-multaneous translation of open domain lectures and speeches. US Patent 8,090,570.