Optical Coupling Sensitivity Study of Luminescent PV Devices Using Monte Carlo Ray Tracing Model
Mehran Rafiee1*, Subhash Chandra1, Hind Ahmed1, Keith Barnham2 and Sarah J. McCormack1
1-Dept. of Civil, Structural and Environmental Engineering, Trinity College Dublin, Dublin 2, Ireland.
2-Faculty of Natural Sciences, Department of Physics, Imperial College London, London SW7 2AZ, UK
* Corresponding author. Email: [email protected] Tel: +353 1 896 2671
Abstract:
The optimisation of optical coupling between photovoltaic (PV) solar cells and luminescent devices such as luminescent solar concentrators (LSC) and luminescent downshifting (LDS) layers is important and can affect their performance significantly. An LSC of 60 × 60 × 3 mm and LDS of 100 × 100 × 0.01 mm both doped with CdSe/ZnS quantum dots (QDs) and coupled to PV solar cells have been modelled. The performance and optical coupling sensitivity of these luminescent PV (LPV) devices were studied by changing the airgap thickness (G) between the luminescent layer and PV solar cell using a Monte Carlo Ray Tracing (MCRT) algorithm. The host materials were epoxy and poly (methyl methacrylate) (PMMA) polymers for the LSC and LDS, respectively, with a refractive index of 1.5. LPV devices were irradiated by standard AM1.5 global solar radiation. The highest optical efficiency and solar concentration ratio obtained for the LSC device were 2.8% and 56% respectively. Both were decreased to 2.2% and 43% when G was increased from 0 to 0.5 mm. For G = 0.5 to 2 mm, the optical efficiency and solar concentration ratio decreased to 1.85% and 36%, respectively. In the LDS device, an optical efficiency of 82% was achieved when there was no airgap between the luminescent device and the PV solar cell. Efficiency dropped to 76% when G increased to 0.1 mm and further decreased to 66% for G = 2 mm. The total performance deduction (ΔP) was respectively 37% and 19% for LSC and LDS when G increased from 0 to 2 mm which showed that the LSC was more sensitive than the LDS to optical coupling.
Keywords: Luminescent Solar Concentrator, Luminescent Down Shifting, Optical Coupling, PV
1- Introduction:
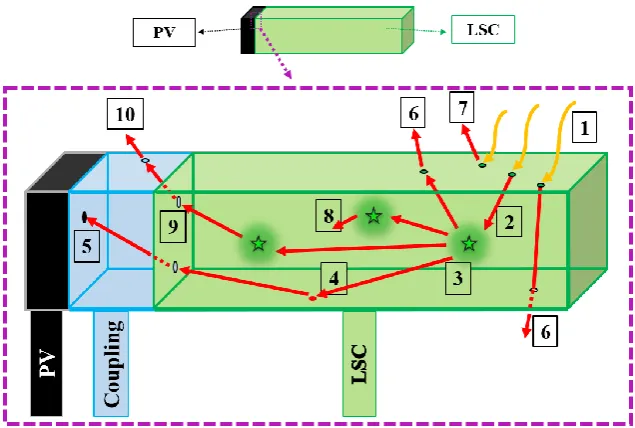
Luminescent photovoltaic (LPV) devices such as the Luminescent Solar Concentrator (LSC) (Chatten et al., 2011, Chandra et al., 2012, S. Chandra, 2017) and Luminescent Downshifting Layers (LDS) (Ahmed, 2014, Hovel et al., 1979) are cost effective technologies to optically enhance the performance of PV solar cells. As seen in Figure 1 and 2, in both LSC and LDS, luminescent materials are doped in a transparent host polymer layer (Aste et al., 2011, Pagliaro et al., 2010, Debije and Verbunt, 2012). In LSCs, Fig 1, the incident solar radiation is absorbed by the luminescent material, concentrated and wave-guided to the edges of the device where the PV solar cell is coupled. A thin film LDS layer shown in Figure 2, is deposited on top of the PV solar cell and the absorbed incident solar radiation is red-shifted by the LDS layer to the region where the PV cell is more efficient.
Figure 1: Configuration of an LSC which shows: 1- photon enters the LSC and is 2- absorbed by the luminescent material, then 3- re-emitted at longer wavelength and 4- wave-guided by Total Internal Reflection (TIR) and 5- reaches the PV cell through the optical coupling. Losses include: 6- the fraction of light which is lost through the bottom and other surfaces (escape cone loss), 7- front surface reflection and 8- the emitted photon which is reabsorbed by another luminescent molecules and its energy is decreased. 9- a fraction of radiation striking the optical coupling, might be 10- deviated and lost due to refractive index differences of the optical coupling and luminescent layer. Note that, the radiation may also be scattered or attenuated by the host or coupling material which are not shown here.
[image:2.595.138.460.445.629.2]Absorbance (A) in LPV devices is defined by Beer Lambert law (Kocsis et al., 2006) as follows:
𝐴 = 𝑙𝑜𝑔10𝑇 (1)
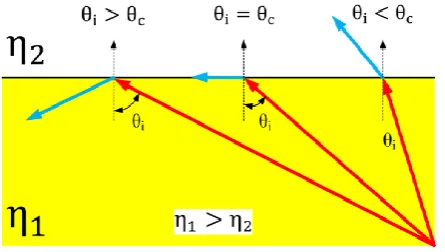
where T is the value of transmittance. Absorbance is characterized by the concentrations of the luminescent material and the geometry of the device. As shown in Figure 2.a and b, the reflection (R) and refraction (T) can be determined from Snell’s Law (Glassner, 1989):
𝑅 = 𝐼 − 2(𝑁. 𝐼)𝑁
𝑇 = 𝜂𝑖𝑡𝐼 + [𝜂𝑖𝑡𝐶𝑖− √1 + 𝜂𝑖𝑡2(𝐶𝑖2− 1)] 𝑁 (2)
where 𝐶𝑖 = 𝑐𝑜𝑠(𝜃𝑖), 𝜂 is the refraction index of the medium. 𝜃𝑖 is the angle of direction between the normal of a surface (N) and the incident ray (I). The ray is reflected by the angle of reflection (𝜃𝑟) or refracted by the angle of refraction 𝜃𝑡. The total internal reflection (TIR) phenomenon can be seen in Figure 2.c which is the basic mechanism of trapping and wave-guiding light inside a medium according to solid critical angle (𝜃𝑐) of the medium which is calculated as (Glassner, 1989):
𝜃𝑐 = 𝑠𝑖𝑛−1
𝜂2
𝜂1
(3)
In all aforementioned transmittance mechanisms (reflection, refraction and TIR), the angle of the ray at the boundaries of the device is characterized by the refraction indices of the inner and outer media. As a result, the PV solar cell (with 𝜂 ≈ 3.5) and luminescent layers (with 𝜂 ≈ 1.5) need to be coupled using a compatible index matching fluid (Weber and Lambe, 1976). Without using the appropriate index matching coupling material, the total fabrication cost might be decreased; however, an airgap may appear in the coupling between the luminescent device and PV solar cell. The refraction index of air (𝜂𝑎𝑖𝑟) is ≈
1; therefore, the radiation at the boundary of the device and the airgap deviates and scatters the light which increases the optical losses. Here, LPV devices have been modeled to investigate their optical losses and performance variations as a function of the optical coupling quality.
(c)
Figure 2: (a) Reflection and (b) Refraction of a ray striking a surface, and (c) Trapping mechanism of ray inside a medium based on critical angle when the medium is denser
than the outer environment (𝜂1> 𝜂2) (Glassner, 1989)
2-
Monte Carlo Ray Tracing Algorithm (MCRT):
The model used in this study has a statistical nature based on a Monte Carlo algorithm. It is a compatible and robust method to study the behavior of non-linear systems with dramatic uncertainty (Jacques and Wang, 1995, Joy, 1995, Şahin and Ilan, 2013, Şahin et al., 2011). In MCRT, the inputs were interpreted by weighted probabilities and counting all probable events in the LPV devices such as reflection, refraction, absorption, emission and TIR. Optical loss mechanisms such as escape cone losses, scattering, reabsorption, and attenuation were also considered in the model. The probability of each event was determined according to parameters such as wavelength, angle of the incident photon, characteristics of the host and luminescent material, dimensions and configuration of the LPV device.
The ray tracing algorithm was applied based on a set of photon intersection calculation processes in an iterative loop to trace each incident photon. The process continued until the fate of each photon was detected and then the same algorithm was executed for the other incident photons. After applying the iterative loop to all incident photons, the final optical efficiency is calculated by:
𝜂𝑜𝑝𝑡 =
∫ 𝐸𝑃𝑂𝑈𝑇(𝜆). 𝑑(𝜆) 𝜆𝑚𝑎𝑥
𝜆𝑚𝑖𝑛
∫ 𝐸𝑃𝐼𝑁(𝜆). 𝑑(𝜆) 𝜆𝑚𝑎𝑥
𝜆𝑚𝑖𝑛
(4)
where 𝐸𝑃𝑂𝑈𝑇(𝜆) is the output energy spectrum at the PV cell plane and 𝐸𝑃𝐼𝑁(𝜆) is the energy spectrum of the input solar radiation. Having known the optical efficiency, the solar concentration ratio, CP can be obtained by:
𝐶𝑃= 𝛤 × 𝜂𝑜𝑝𝑡 (5)
where 𝛤 is the geometric gain and it is known as the aperture surface ratio (𝐴𝐴𝑃𝑅) to the total PV cell area (𝐴𝑃𝑉) which can be calculated as follows:
𝛤 =𝐴𝐴𝑃𝑅 𝐴𝑃𝑉
(6)
[image:4.595.188.411.70.196.2]CdSe/ZnS QDs with quantum yield (QY) of 85%. The QDs emission and absorbance spectra are shown in Figure 4. As it can be seen, the QD absorbed solar radiation below 500 nm and the absorbance peak was at 460 nm. The emission of the QD was a Gaussian spectrum in the region between 430 to 530 nm with a peak at around 485 nm which resulted in a Stokes shift of around 25 nm
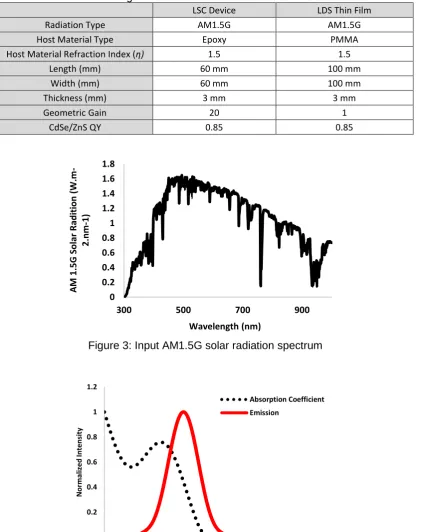
Table 1: Configuration of the modeled LSC and LDS devices
LSC Device LDS Thin Film
Radiation Type AM1.5G AM1.5G
Host Material Type Epoxy PMMA
Host Material Refraction Index (η) 1.5 1.5
Length (mm) 60 mm 100 mm
Width (mm) 60 mm 100 mm
Thickness (mm) 3 mm 3 mm
Geometric Gain 20 1
[image:5.595.153.434.539.729.2]CdSe/ZnS QY 0.85 0.85
Figure 3: Input AM1.5G solar radiation spectrum
Figure 4: Normalized absorption coefficient and emission spectra for CdSe/ZnS QD 0
0.2 0.4 0.6 0.8 1 1.2 1.4 1.6 1.8
300 500 700 900
A
M
1.5G
So
lar
R
ad
ition
(
W.
m
-2.nm
-1)
Wavelength (nm)
0 0.2 0.4 0.6 0.8 1 1.2
400 450 500 550 600 650
Norm
al
iz
e
d
Inten
si
ty
Wavelength (nm)
3-
Results and Discussion:
Both LPV devices were modelled under similar circumstances and inputs. Therefore, the amount of top surface reflection was around 17% for both devices due to the close refraction indices of host materials (𝜂 ≈ 1.5). The rest of the photons (around 82%) refracted into the layers. The LPV devices were modelled for different airgap thicknesses (G = 0 to 2 mm) between the luminescent layer and PV solar cell.
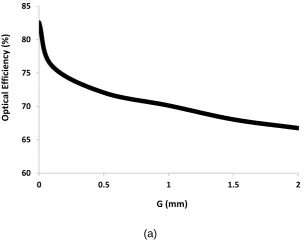
Figure 5.a shows the optical efficiency over the airgap variations for the LDS device. The value of 𝜂𝑜𝑝𝑡 significantly decreased from around 82% to 76% when G increased by only 0.1 mm. Further increase in G from 0.1 to 2 mm, resulted in 𝜂𝑜𝑝𝑡 decreasing smoothly to around 66%.
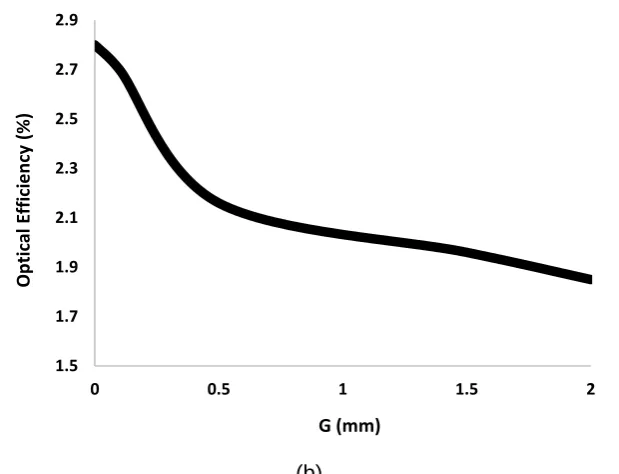
[image:6.595.147.453.451.701.2]The initial fall in the optical efficiency of the LSC with air gap thickness was significantly less steep for the LSC than the LDS device (Figure 5.b), under perfect optical coupling condition (G = 0 mm), 𝜂𝑜𝑝𝑡 was around 2.79% which decreased to 2.16% when G increased to 0.5 mm. Above G = 0.5 mm, 𝜂𝑜𝑝𝑡 decreased with less slope and reached 1.85 at G = 2 mm.
Table 2 presents the detailed statistical modelling results. As it can be seen for LDS, by increasing the airgap from 0 to 2 mm, 15.5% increase was found in the rate of the photons exiting the edges. Moreover, thermal losses increased by around 0.32%. Increase in the edge losses was due to the photon deviation in the airgap as a results of refraction index differences. The increase in thermal losses was because of the increase in photon path length resulting in higher attenuation losses inside the airgap. These losses decreased the rate of the photons reaching the bottom-mounted PV from around 82% to 66%. As a result, around 19% deduction (ΔP) was observed in the performance of the device. For the modelled LSC, increasing the airgap resulted in around 0.27% increase in thermal and 0.43% increase in edge losses. Therefore, the rate of the photons reaching the PV cell at the side-edge decreased from 2.46 to 1.77. The total solar concentration ratio decreased from 56% to 36% which resulted in around 37% performance deduction.
(a)
60 65 70 75 80 85
0 0.5 1 1.5 2
Opti
cal
E
ff
icienc
y
(%
)
(b)
[image:7.595.143.453.69.306.2]Figure 5: Optical efficiency over airgap variations for the modeled: a) LDS and b) LSC
Table 2: Investigating the performance of the modeled LPV devices by changing the airgap thickness
LPV Device LDS LSC
G (mm) 0 2 0 2
Reflected (%) 17.42 17.43 17.54 17.53
Refracted (%) 82.58 82.57 82.46 82.47
Thermal Loss (%) 0.02 0.34 4.24 4.51
Exited the Edges (%) 0.0003 15.50 75.76 76.19
Reached PV (%) 82.55 66.73 2.46 1.77
ηopt (%) 82.56 66.74 2.79 1.85
Cp (%) 82.56 66.74 55.80 35.34
ΔP (%)
(Between G = 0 to 2mm) -19.17% -36.67%
4-
Conclusion:
A MCRT algorithm model was developed to model a 60 × 60 × 3 mm LSC and a 100 × 100 × 0.01 mm LDS devices and to investigate their optical coupling sensitivity and related performance. The airgap in both LPV devices was varied between 0 to 2 mm. Increasing the airgap resulted in increasing the attenuation losses and photon deviation through the edges of LPV devices. The performance of LSC decreased by increasing G from 0 to 0.5 mm; while, the performance of LDS was more significantly affected at low air gaps. However, over the full air-gap range studied the LSC loss more efficiency than that the LDS. Around 19% performance deduction was observed for the LDS when G increased from 0 to 2 mm; while, the performance of the LSC reduced by around 37% under the same circumstance. This indicated that the LSC was more sensitive to the quality of optical coupling than LDS. The results can be used for further device design and optimization of the fabrication process.
1.5 1.7 1.9 2.1 2.3 2.5 2.7 2.9
0 0.5 1 1.5 2
Op
tical
E
ff
ic
ie
n
cy
(%
)
5-
Acknowledgment:
The authors would like to acknowledge the funding from the European Research Council grant (639760) entitled PEDAL: Plasmonic enhancement of advanced luminescent solar devices and funding from Science Foundation Ireland (SFI).
6-
References:
AHMED, H. 2014. Materials Characterization And Plasmonic Interaction In Enhanced Luminescent Down-Shifting Layers For Photovoltaic Devices. PhD, Dublin Institute of Technology. AHMED, H., DORAN, J. & MCCORMACK, S. 2016a. Increased short-circuit current density and
external quantum efficiency of silicon and dye sensitised solar cells through plasmonic luminescent down-shifting layers. Solar Energy, 126, 146-155.
AHMED, H., MCCORMACK, S. & DORAN, J. 2016b. External Quantum Efficiency Improvement with Luminescent Downshifting Layers: Experimental and Modelling. International Journal of Spectroscopy, 2016.
AHMED, H., MCCORMACK, S. & DORAN, J. 2017. Plasmonic luminescent down shifting layers for the enhancement of CdTe mini-modules performance. Solar Energy, 141, 242-248.
ASTE, N., ADHIKARI, R. & DEL PERO, C. Photovoltaic technology for renewable electricity production: Towards net zero energy buildings. Clean Electrical Power (ICCEP), 2011 International Conference on, 2011. IEEE, 446-450.
ASTE, N., TAGLIABUE, L. C., PALLADINO, P. & TESTA, D. 2015. Integration of a luminescent solar concentrator: Effects on daylight, correlated color temperature, illuminance level and color rendering index. Solar Energy, 114, 174-182.
CHANDRA, S. 2013. Approach to Plasmonic Luminescent Solar Concentration. PhD, Dublin Institute of Technology.
CHANDRA, S., DORAN, J., MCCORMACK, S., KENNEDY, M. & CHATTEN, A. 2012. Enhanced quantum dot emission for luminescent solar concentrators using plasmonic interaction. Solar Energy Materials and Solar Cells, 98, 385-390.
CHATTEN, A. J., FARRELL, D. J., BOSE, R., DIXON, A., POELKING, C., GÖDEL, K. C., MAZZER, M. & BARNHAM, K. W. Luminescent and geometric concentrators for building integrated photovoltaics. Photovoltaic Specialists Conference (PVSC), 2011 37th IEEE, 2011. IEEE, 000852-000857.
DEBIJE, M. G. & VERBUNT, P. P. 2012. Thirty years of luminescent solar concentrator research: solar energy for the built environment. Advanced Energy Materials, 2, 12-35.
GAJIC, M., LISI, F., KIRKWOOD, N., SMITH, T. A., MULVANEY, P. & ROSENGARTEN, G. 2017. Circular luminescent solar concentrators. Solar Energy, 150, 30-37.
GLASSNER, A. S. 1989. An introduction to ray tracing, Elsevier.
HOVEL, H., HODGSON, R. & WOODALL, J. 1979. The effect of fluorescent wavelength shifting on solar cell spectral response. Solar Energy Materials, 2, 19-29.
JACQUES, S. L. & WANG, L. 1995. Monte Carlo modeling of light transport in tissues. Optical-thermal response of laser-irradiated tissue. Springer.
JOY, D. C. 1995. Monte Carlo modeling for electron microscopy and microanalysis, Oxford University Press.
KOCSIS, L., HERMAN, P. & EKE, A. 2006. The modified Beer–Lambert law revisited. Physics in Medicine & Biology, 51, N91.
PAGLIARO, M., CIRIMINNA, R. & PALMISANO, G. 2010. BIPV: merging the photovoltaic with the construction industry. Progress in Photovoltaics: Research and Applications, 18, 61-72. S. CHANDRA, H. A., M. RAFIEE AND S. J. MCCORMACK 2017. Plasmonic Quantum Dot Solar
Concentrator. SPIE Photonics West 2017.
ŞAHIN, D. & ILAN, B. 2013. Radiative transport theory for light propagation in luminescent media. JOSA A, 30, 813-820.
ŞAHIN, D., ILAN, B. & KELLEY, D. F. 2011. Monte-Carlo simulations of light propagation in luminescent solar concentrators based on semiconductor nanoparticles. Journal of Applied Physics, 110, 033108.