Content Without a Gold Standard
Annie Louis
∗University of Pennsylvania
Ani Nenkova
∗∗University of Pennsylvania
The most widely adopted approaches for evaluation of summary content follow some protocol for comparing a summary with gold-standard human summaries, which are traditionally called model summaries. This evaluation paradigm falls short when human summaries are not available and becomes less accurate when only a single model is available. We propose three novel evaluation techniques. Two of them are model-free and do not rely on a gold standard for the assessment. The third technique improves standard automatic evaluations by expanding the set of available model summaries with chosen system summaries.
We show that quantifying the similarity between the source text and its summary with appropriately chosen measures produces summary scores which replicate human assessments accurately. We also explore ways of increasing evaluation quality when only one human model summary is available as a gold standard. We introduce pseudomodels, which are system sum-maries deemed to contain good content according to automatic evaluation. Combining the pseudomodels with the single human model to form the gold-standard leads to higher correlations with human judgments compared to using only the one available model. Finally, we explore the feasibility of another measure—similarity between a system summary and the pool of all other system summaries for the same input. This method of comparison with the consensus of systems produces impressively accurate rankings of system summaries, achieving correlation with human rankings above 0.9.
1. Introduction
In this work, we present evaluation metrics for summary content which make use of little or no human involvement. Evaluation methods such as manual pyramid scores (Nenkova, Passonneau, and McKeown 2007) and automatic ROUGE scores (Lin and Hovy 2003) rely on multiple human summaries as a gold standard (model) against which they compare a summary to assess how informative the candidate summary is. It is desirable that evaluation of similar quality be done quickly and cheaply
∗ E-mail:[email protected].
∗∗ University of Pennsylvania, Department of Computer and Information Science, 3330 Walnut St., Philadelphia, PA 19104. E-mail:[email protected].
Submission received: 18 June 2011; revised submission received: 23 March 2012; accepted for publication: 18 April 2012.
on non-standard test sets that have few or no human summaries, or on large test sets for which creating human model summaries is infeasible. In our work, we aim to identify indicators of summary content quality that do not make use of human summaries but can replicate scores based on comparison with a gold standard very accurately.
Such indicators would need to be easily computable from existing resources and to provide rankings of systems that agree with rankings obtained through human judgments. There have been some early proposals for alternative methods. Donaway, Drummey, and Mather (2000) propose that a comparison of the source text with a summary can tell us how good the summary is. A summary that has higher similarity with the source text can be considered better than one with lower similarity. Radev and Tam (2003) perform a large scale evaluation with thousands of test documents. Their work is set up in a search engine scenario. They first rank the test documents using the search engine. Then they perform the same experiment now substituting the summaries from one system in place of the original documents. The system whose summaries have the most similar ranking as that generated for the full documents is considered the best system because not much information loss is introduced by the summarization process.
But these methods did not gain much popularity and their performance was never compared to human evaluations. Part of the reason is that only in the last decade have several large data sets with system summaries and their ratings from human judges become available for performing such studies. Our work is the first to provide a comprehensive report of the strengths of such approaches and we show that human ratings can be reproduced by these fully automatic metrics with high accuracy. Our results are based on data for multi-document news summarization.
The key insights of our approach can be summarized as follows:
Input–summary similarity:Good summaries are representative of the input and so one would expect that the more similar a summary is to the input, the better its content. Identifying a suitable input–summary similarity metric will provide a means for fully automatic evaluation of summaries. We present a quantitative analysis of this hypothe-sis and show that input–summary similarity is highly predictive of scores assigned by humans for the summaries. The choice of an appropriate metric to measure similarity is critical, however, and we show that information-theoretic measures turn out to be the most powerful for this task (Section 4).
Addition of pseudomodels: Having a larger number of model summaries has been shown to give more stable evaluation results, but for some data sets only a single model summary is available. We test the utility ofpseudomodels, which are system summaries that are chosen to be added to the human summary pool and that are used as additional models. We find that augmenting the gold standard with pseudomodels helps obtain better correlations with human judgments than if a single model is used (Section 5).
System summaries as models:Most current summarization systems perform content selection reasonably well. We examine an approach to evaluation that exploits system output and considers all system summaries for a given input as a gold standard (Sec-tion 6). We find that similarity between a summary and such a gold standard constitutes a powerful automatic evaluation measure. The correlation between this measure and human evaluations is over 0.9.
Metrics), is freely available.1 We test these resource-poor approaches to predict sum-mary content scores assigned by human assessors. We evaluate the results on data from the Text Analysis Conferences.2
We find that our automatic methods to estimate summary quality are highly predic-tive of human judgments. Our best result is 0.93 correlation with human rankings using no model summaries and this is on par with automatic evaluation methods that do use human summaries. Our study provides some direction towards alternative methods of evaluation on non-standard test sets. The goal of our methods is to aid system development and tuning on new, especially large, data sets using little resources. Our metrics complement but are not intended to replace existing manual and automatic approaches to evaluation wherein the latter’s strength and reliability are important for high confidence evaluations. Some of our findings are also relevant for system development as we identify desirable properties of automatic summaries that can be computed from the input (see Section 4). Our results are also strongly suggestive that system combination has the potential for improving current summarization systems (Section 6).
We start out with an outline of existing evaluation methods and the potential shortcomings of these approaches which we wish to address.
2. Current Content Evaluation Methods
Summary quality is defined by two key aspects—content and linguistic quality. A good summary should contain the most important content in the input and also structure the content and present it as well-written text. Several methods have been proposed for evaluating system-produced summaries; some only assess content, others only linguis-tic quality, and some combine assessment of both. Some of these approaches are manual and others can be performed automatically.
In our work, we consider the problem of automatic evaluation of content quality. To establish the context for our work, we provide an overview of current content evaluation methods used at the annual evaluations run by NIST.
The Text Analysis Conference (TAC, previously called the Document Understand-ing Conference [DUC]3) conducts large scale evaluation of automatic systems on dif-ferent summarization tasks. These conferences have been held every year since 2001 and the test sets and evaluation methods adopted by TAC/DUC have become the standard for reporting results in publications. TAC has employed a range of manual and automatic metrics over the years.
Manual evaluations of the systems are performed at NIST by trained assessors. The assessors score the summaries either
a) by comparing with agold-standard summarywritten by humans, or
b) by providing adirect ratingon a scale (1 to 5 or 1 to 10).
The human summaries against which other summaries are compared are inter-changeably called models, gold standards, and references. Within TAC, they are typ-ically calledmodels.
1 SIMetrix can be downloaded athttp://www.seas.upenn.edu/∼lannie/IEval2.html. 2 http://www.nist.gov/tac/.
2.1 Content Coverage Scores
The methods relying on a gold standard have evolved over the years. In the first years of DUC, a single model summary was used. System summaries were evaluated by manually assessing how much of the model’s content is expressed in the system summary. Each clause in the model represents one unit for the evaluation. For each of these clauses, assessors specify the extent to which its content is expressed in a given system summary. The average degree to which the model summary’s clauses overlap with the system summary’s content is called coverage. These coverage scores were taken as indicators of content quality for the system summaries.
Different people include very different content in their summaries, however, and so the coverage scores can vary depending on which model is used (Rath, Resnick, and Savage 1961). This problem of bias in evaluation was later addressed by the pyramid technique, which combines information from multiple model summaries to compose the reference for evaluation. Since 2005, the pyramid evaluation method has become standard.
2.2 Pyramid Evaluation
Thepyramid evaluation method(Nenkova and Passonneau 2004) has been developed for reliable and diagnostic assessment of content selection quality in summarization and has been used in several large scale evaluations (Nenkova, Passonneau, and McKeown 2007). It uses multiple human models from which annotators identify semantically defined Summary Content Units (SCUs). Each SCU is assigned a weight equal to the number of human model summaries that express that SCU. An ideal maximally informative summary would express a subset of the most highly weighted SCUs, with multiple maximally informative summaries being possible. The pyramid score for a system summarySis equal to the following ratio:
py(S)= sum of weights of SCUs expressed inS
sum of weights of an ideal summary with the same number of SCUs asS (1)
In this way, a more reliable score for a summary is obtained using multiple reference summaries. Four human summaries are normally used for pyramid evaluation at TAC.
2.3 Responsiveness Evaluation
Responsivenessof a summary is a measure of overall quality combining both content selection and linguistic quality. It measures to what extent summaries convey appropri-ate content in a structured fashion. Responsiveness is assessed by direct ratings given by the judges. For example, a scale of 1 (poor summary) to 5 (very good summary) is used and these assessments are done without reference to any model summaries.
substantial influence on the responsiveness judgments, however. The high correlation also indicates that two types of human judgments made on very different basis— gold-standard summaries and direct judgments—can agree and provide fairly similar rankings of summaries.
2.4 ROUGE
Manual evaluation methods require significant human effort. Moreover, the pyramid evaluation involves detailed annotation for identifying SCUs in human and system summaries and requires training of assessors to perform the evaluation. Outside of TAC, therefore, system developments and results are regularly reported using ROUGE, a suite of automatic evaluation metrics (Lin and Hovy 2003; Lin 2004b).
ROUGE automates the comparison between model and system summaries based on n-gram overlaps. These overlap scores have been shown to correlate well with human assessment (Lin 2004b) and so ROUGE removes the need for manual judgments in this part of the evaluation.
ROUGE scores are computed typically using unigram (R1) or bigram (R2) overlaps. In TAC, four human summaries are used as models and their contents are combined for computing the overlap scores. For fixed length summaries, the recall from the comparison is used as the quality metric. Other metrics such as longest subsequence match are also available. Another ROUGE variant is RSU4, which computes the overlap in terms ofskip bigrams, where two unigrams with a gap of up to four intervening words are considered as bigrams. This latter metric provides some additional flexibility compared to the stricter R2 scores.
The correlations between ROUGE and manual evaluations for systems in TAC 2009 are shown in Table 1 and vary between 0.76 and 0.94 for the different variants.4 Here, and in all subsequent experiments, Spearman correlations are computed using the R toolkit (R Development Core Team 2011). In this implementation, significance values for the correlations are produced using the AS 89 algorithm (Best and Roberts 1975).
These correlations are highly significant and show that ROUGE is a high perfor-mance automatic evaluation metric.
We can consider the ROUGE results as the upper bound of performance for the model-free evaluations that we propose because ROUGE involves direct comparison with the gold-standard summaries. Our metrics are designed to be used when model summaries are not available.
2.5 Automatic Evaluation Without Gold-Standard Summaries
All of these methods require significant human involvement. In evaluations where gold-standard summaries are needed, assessors first read the input documents (10 or more per input) and write a summary. Then manual comparison of system and gold standard is done, which takes additional time. Gillick and Liu (2010) hypothesize that at least 17.5 hours are needed to evaluate two systems under this set up on a standard test set. Moreover, multiple gold-standard summaries are needed for the same input, so different assessors have to read and create summaries. The more reliable evaluation
Table 1
Spearman correlation between manual scores and ROUGE metrics on TAC 2009 data (53 systems). All correlations are highly significant with p-value<10−10.
ROUGE variant Pyramid Responsiveness
ROUGE-1 0.88 0.76
ROUGE-2 0.94 0.82
ROUGE-SU4 0.92 0.79
methods such as pyramid involve even more annotations at the clause level. Although responsiveness does not require gold-standard summaries, in a system development setting, responsiveness judgments are resource-intensive. It requires judges to directly assign scores to summaries, so humans are in the loop each time the evaluation needs to be done, making it rather costly. For ROUGE, however, once the human summaries are created, the scores can be computed automatically for repeated system development runs. This benefit has made ROUGE immensely popular. But the initial investment of time for gold-standard creation is still necessary.
Another important point is that for TAC, the gold standards are created by trained assessors at NIST. Non-expert evaluation options such as Mechanical Turk have recently been explored by Gillick and Liu (2010). They provided annotators with gold-standard references and system summaries and asked them to score the system summaries on a scale from 1 to 10 with respect to how well they convey the same information as the models. They analyzed how these scores are related to responsiveness judgments given by the expert TAC assessors. The study assessed only eight automatic systems from TAC 2009 and the correlation between the ratings from experts and Mechanical Turk annotations was 0.62 (Spearman). The analysis concludes that evaluations produced in this way tend to be noisy.
One reason was that non-expert annotators were quite influenced by the readability of the summaries. For example, they tended to assign high scores to the baseline summary that picks the lead paragraph. The baseline summary, however, is ranked by expert annotators as low in responsiveness compared to other systems’ summaries. Further, the non-expert evaluation led to few significant differences in the system rank-ings (score of system A is significantly greater/lesser than that of B) compared with the TAC evaluations of the same systems.
of the judges turns out to be the most significant factor influencing summary scores. Gillick and Liu do not elicit model summaries, only direct judgments on quality. We suspect that the task would only be harder if model summaries were to be created by non-experts.
The problem that has been little addressed by any of these discussed metrics is eval-uation when there are no gold-standard summaries available. Systems are developed by fine-tuning on the TAC data sets, but in non-TAC data sets in novel or very large domains model summaries may not be available. Even though ROUGE provides good performance in automatic evaluation, it is not usable under these conditions. Further, pyramid and ROUGE use multiple gold-standard summaries for evaluation (ROUGE correlates with human judgments better when computed using multiple models; we discuss this aspect further in Section 5) so even a single gold-standard summary may not be sufficient for reliable evaluation.
In our work, we propose fully automatic methods for content evaluation which can be used in the absence of human summaries. We also explore methods to further improve the evaluation performance when only one model summary is available.
3. Data and Evaluation Plan
In this section, we describe the data we use throughout our article. We carry out our analysis on the test sets and system scores from TAC 2009. TAC 2009 is also the year when NIST introduced a special track called AESOP (Automatically Evaluating Summaries of Peers). The goal of AESOP is to identify automatic metrics that correlate well with human judgments of summary quality.
We use the data from the TAC 2009 query focused-summarization task.5Each input consists of ten news documents. In addition, the user’s information needs associated with each input is given by a query statement consisting of a title and narrative. An example query statement is shown here:
Title: Airbus A380
Narrative: Describe developments in the production and launch of the Airbus A380.
A system must produce a summary that addresses the information required by the query. The maximum length for summaries is 100 words.
The test set contains 44 inputs, and 53 automatic systems (including baselines) participated that year. These systems were manually evaluated for content using both pyramid and responsiveness methods. In TAC 2009, two oracle systems were intro-duced during evaluation whose outputs are in fact summaries created by people. We ignore these two systems and use only the automatic participant submissions and the automatic baseline systems.
As a development set, we use the inputs, summaries, and evaluations from the previous year, TAC 2008. There were 48 inputs in the query-focused task in 2008 and 58 automatic systems participated.
TAC 2009 also involved an update summarization task and we obtained similar results on the summaries from this task. In this article, for clarity we only present results
on evaluating the query-focused summaries, but the update task results are described in detail in Louis and Nenkova (2008, 2009a, 2009c).
3.1 Evaluating Automatic Metrics
For each of our proposed metrics, we need to assess their performance in replicating manually produced rankings given by the pyramid and responsiveness evaluations. We use two measures to compare these human scores for a system with the automatic scores from one of our metrics:
a) SPEARMAN CORRELATION: Reporting correlations with human evaluation metrics is the norm for validating automatic metrics. We report Spearman correlation, which compares the rankings of systems produced by the two methods instead of the actual scores assigned to systems.
b) PAIRWISE ACCURACY: To complement correlation results with numbers that have easier intuitive interpretation, we also report the pairwise accuracy of our metrics in predicting the human scores. For every pair of systems (A, B), we examine whether their pairwise ranking (eitherA>B,A<B, orA=B) according to the automatic metric agrees with the ranking of the same pair according to human evaluation. If it does, the pair isconcordantwith human judgments. The pairwise accuracy is the percentage of concordant pairs out of the total system pairs. This accuracy measure is more inter-pretable than correlations in terms of the errors made by a metric. A metric with 90% accuracy incorrectly flips 10% of the pairs, on average, in a ranking it produces. This measure is inspired by the Kendall tau coefficient.
We test the metrics for success in replicating human scores overall across the full test set as well as identifying good and bad summaries for individual inputs. We therefore report the correlation and accuracy of our metrics at the following two levels.
a) SYSTEM LEVEL(MACRO): The average score for a system is computed over the entire set of test inputs using both manual and our automatic methods. The correlations between ranks assigned to systems by these average scores will be indicative of the strength of our features to predict overall system rankings on the test set. Similarly, the pairwise accuracies are computed using the average scores for the systems in the pair.
b) INPUT LEVEL (MICRO): For each individual input, we compare the rankings for the system summaries using manual and automatic evaluations. Here the correlation or accuracy is computed for each input. For correlations, we report the percentage of inputs for which significant correlations (p-value < 0.05) were obtained. For accuracy, the systems are paired within each input. Then these pairs for all the inputs are put together and the fraction of concordant pairs is computed. Micro-level analysis highlights the ability of an evaluation metric to identify good and poor quality system summaries produced for a specific input and this task is bound to be harder than system level predictions. For example, even with wrong prediction of rankings on a few inputs, the average scores (macro-level) for a system might not be affected.
4. Input–Summary Similarity: Evaluation Using Only the Source Text
Here we present and evaluate a suite of metrics which do not require gold-standard human summaries for evaluation. The underlying intuition is that good summaries will tend to be similar to the input in terms of content. Accordingly, we use the similarity of the distribution of terms in the input and summaries as a measure of summary content. Although the motivation for this metric is highly intuitive, it is not clear how simi-larity should be defined for this particular problem. Here we provide a comprehensive study of input–summary similarity metrics and show that some of these measures can indeed be very accurate predictors of summary quality even while using no gold-standard human summaries at all.
Prior to our work, the proposal for using the input for evaluation has been brought up in a few studies. These studies did not involve a direct evaluation of the capacity of input–summary similarity to replicate human ratings, however, and they did not compare similarity metrics for the task. Because large scale manual evaluation results are available now, our work is the first to evaluate this possibility in a direct manner and involving study of correlations with different types of human evaluations. In the following section we detail some of the prior studies on input–summary similarity for summary evaluation.
4.1 Related Work
One of the motivations for using the input text rather than gold-standard summaries comes from the need to perform large scale evaluations with test sets comprised of thousands of inputs. Creating human summaries for all of them would be an impossible task indeed.
In Radev and Tam (2003), therefore, a large scale fully automatic evaluation of eight summarization systems on 18,000 documents was performed without any human effort by using the idea of input–summary similarity. A search engine was used to rank docu-ments according to their relevance to a given query. The summaries for each document were also ranked for relevance with respect to the same query. For good summarization systems, the relevance ranking of summaries is expected to be similar to that of the full documents. Based on this intuition, the correlation between relevance rankings of summaries and original documents was used to compare the different systems. A system whose summaries obtained highly similar rankings to the original documents can be considered better than a system whose rankings have little agreement.
Another situation where input–summary similarity was hypothesized as a possible evaluation was in work concerned with reducing human bias in evaluation. Because humans vary considerably in the content they include for the same input (Rath, Resnick, and Savage 1961; van Halteren and Teufel 2003), rankings of systems are rather different depending on the identity of the model summary used (also noted by McKeown et al. [2001] and Jing et al. [1998]). Donaway, Drummey, and Mather (2000) therefore suggested that there are considerable benefits to be had in adopting a method of evaluation that does not require human gold standards but instead directly compares the original document and its summary. In their experiments, Donaway, Drummey, and Mather demonstrated that the correlations between manual evaluation using a gold-standard summary and
b) automatic evaluation by directly comparing input and summary6
are the same. Their conclusion was that such automatic methods should be seriously considered as an alternative to evaluation protocols built around the need to compare with a gold standard.
These studies, however, do not directly assess the performance of input–summary similarity for ranking systems. In Louis and Nenkova (2009a), we provided the first study of several metrics for measuring similarity for this task and presented correla-tions of these metrics with human produced rankings of systems. We have released a tool, SIMetrix (Summary-Input Similarity Metrics), which computes all the similarity metrics that we explored.7
4.2 Metrics for Computing Similarity
In this section, we describe a suite of similarity metrics for comparing the input and summary content. We use cosine similarity, which is standard for many applications. The other metrics fall under three main classes: distribution similarity, summary likeli-hood, and use of topic signature words. The distribution similarity metrics compare the distribution of words in the input with those in the summary. The summary likelihood metrics are based on a generative model of word probabilities in the input and use the model to compute the likelihood of the summary. Topic signature metrics focus on a small set of descriptive and topical words from the input and compare them to summary content rather than using the full vocabulary of the input.
Both input and summary words were stopword-filtered and stemmed before com-puting the features.
4.2.1 Distribution Similarity. Measures of similarity between two probability distribu-tions are a natural choice for our task. One would expect good summaries to be charac-terized by low divergence between probability distributions of words in the input and summary, and by high similarity with the input.
We experimented with three common measures: Kullback Leibler (KL) divergence, Jensen Shannon (JS) divergence, and cosine similarity.
These three metrics have already been applied for summary evaluation, albeit in a different context. In their study of model-based evaluation, Lin et al. (2006) used KL and JS divergences to measure the similarity between human and machine summaries. They found that JS divergence always outperformed KL divergence. Moreover, the per-formance of JS divergence was better than standard ROUGE scores for multi-document summarization when multiple human models were used for the comparison.
The use of input–summary similarity in Donaway, Drummey, and Mather (2000), which we described in the previous section, is more directly related to our work. But here, inputs and summaries were compared using only one metric: cosine similarity.
Kullback Leibler (KL) divergence:The KL divergence between two probability distri-butionsPandQis given by
D(P||Q)= w
pP(w) log2
pP(w)
pQ(w)
(2)
It is defined as the average number of bits wasted by coding samples belonging toP using another distributionQ, an approximate ofP. In our case, the two distributions of word probabilities are estimated from the input and summary, respectively. Because KL divergence is not symmetric, both input–summary and summary–input divergences are introduced as metrics. In addition, the divergence is undefined whenpP(w)>0 but pQ(w)=0. We perform simple smoothing to overcome the problem.
p(w)= C+δ
N+δ∗B (3)
HereCis the count of wordwandNis the number of tokens;B=1.5|V|, whereV is the input vocabulary andδwas set to a small value of 0.0005 to avoid shifting too much probability mass to unseen events.
Jensen Shannon (JS) divergence:The JS divergence incorporates the idea that the dis-tance between two distributions cannot be very different from the average of disdis-tances from their mean distribution. It is formally defined as
J(P||Q)=1
2[D(P||A)+D(Q||A)], (4)
where A=P+2Q is the mean distribution of P and Q. In contrast to KL divergence, the JS distance is symmetric and always defined. We compute both smoothed and unsmoothed versions of the divergence as summary scores.
Vector space similarity:The third metric is cosine overlap between thetf ∗idf vector representations of input and summary contents.
cosθ= vinp .vsumm
||vinp|| ||vsumm|| (5)
We compute two variants:
1. Vectors contain all words from input and summary.
2. Vectors contain only topic signature words from the input and all words of the summary.
Topic signatures are words highly descriptive of the input, as determined by the application of the log-likelihood test (Lin and Hovy 2000). Using only topic signatures from the input to represent text is expected to be more accurate because the reduced vector has fewer dimensions compared with using all the words from the input.
4.2.2 Summary Likelihood.For this approach, we view summaries as being generated according to word distributions in the input. Then the probability of a word in the input would be indicative of how likely it is to be emitted into a summary. Under this gen-erative model, the likelihood of a summary’s content can be computed using different methods and we expect the likelihood to be higher for better quality summaries.
Unigram summary probability:
(pinpw1)n1(pinpw2)n2...(pinpwr)nr (6)
where pinpwi is the probability in the input of wordwi,ni is the number of times wi appears in the summary, andw1. . .wrare all words in the summary vocabulary.
Multinomial summary probability:
N!
n1!n2!. . .nr!
(pinpw1)n1(pinpw2)n2. . .(pinpwr)nr (7)
whereN=n1+n2+. . .+nris the total number of words in the summary.
4.2.3 Use of Topic Words in the Summary.Summarization systems that directly optimize the number of topic signature words during content selection have fared very well in evaluations (Conroy, Schlesinger, and O’Leary 2006). Hence the number of topic signatures from the input present in a summary might be a good indicator of summary content quality. In contrast to the previous methods, by limiting to topic words, we use only a representative subset of the input’s words for comparing with summary content. We experiment with two features that quantify the presence of topic signatures in a summary:
1. The fraction of the summary composed of input’s topic signatures.
2. The percentage of topic signatures from the input that also appear in the summary.
Although both features will obtain higher values for summaries containing many topic words, the first is guided simply by the presence of any topic word and the second measures the diversity of topic words used in the summary.
4.2.4 Feature Combination Using Linear Regression. We also evaluated the performance of a linear regression metric combining all of these features. During development, the value of the regression-based score for each summary was obtained using a leave-one-out approach. For a particular input and system-summary combination, the training set consisted only of examples which included neither the same input nor the same system. Hence during training, no examples of either the test input or system were seen.
4.3 Results
We first present an analysis of all the similarity metrics on our development data, TAC’08. In the next section, we analyze the performance of our two best features on the TAC’09 data set.
4.3.1 Feature Analysis: Which Similarity Metric is Best?. Table 2 shows the macro-level Spearman correlations between manual and automatic scores averaged across the 48 inputs in TAC’08.
Table 2
Spearman correlation on the macro level for TAC’08 data (58 systems). All results are highly significant with p-values<0.000001 except unigram and multinomial summary probability, which are not significant even at the 0.05 level.
Features Pyramid Responsiveness
JS div −0.880 −0.736
JS div smoothed −0.874 −0.737
% of input topic words 0.795 0.627
KL div summary–input −0.763 −0.694
cosine overlap, all words 0.712 0.647
% of summary = topic words 0.712 0.602 cosine overlap, topic words 0.699 0.629
KL div input–summary −0.688 −0.585
multinomial summary probability 0.222 0.235 unigram summary probability −0.188 −0.101
regression 0.867 0.705
ROUGE-1 recall 0.859 0.806
ROUGE-2 recall 0.905 0.873
linear regression combination of features obtains high correlations with manual scores but does not lead to better results than the single best feature: JS divergence.
JS divergence obtains the best correlations with both types of manual scores— 0.88 with pyramid score and 0.74 with responsiveness. The regression metric performs comparably, with correlations of 0.86 and 0.70. The correlations obtained by both JS divergence and the regression metric with pyramid evaluations are in fact better than that obtained by ROUGE-1 recall (0.85).
The best topic signature-based feature—the percentage of input’s topic signatures that are present in the summary—ranks next only to JS divergence and regression. The correlations between this feature and pyramid and responsiveness evaluations are 0.79 and 0.62, respectively. The proportion of summary content composed of topic words performs worse as an evaluation metric with correlations 0.71 and 0.60. This result indicates that summaries that cover more topics from the input are judged to have better content than those in which fewer topics are mentioned.
Cosine overlaps and KL divergences obtain good correlations but still lower than JS divergence and the percentage of input topic words. Further, rankings based on unigram and multinomial summary likelihood do not correlate significantly with manual scores.
On a per input basis, the proposed metrics are not that effective in distinguishing which summaries have good and poor content. The minimum and maximum correla-tions with manual evaluacorrela-tions across the 48 inputs are given in Table 3. The number and percentage of inputs for which correlations were significant are also reported.
JS divergence obtains significant correlations with pyramid scores for 73%. The best correlation was 0.71 on a particular input and the worst performance was 0.27 correla-tion for another input. The results are worse for other features and for comparison with responsiveness scores.
Table 3
Spearman correlations at micro level for TAC’08 data (58 systems). Only the minimum and maximum values of the significant correlations are reported, together with the number and percentage of inputs that obtained significant correlation.
Pyramid Responsiveness
number number
Features max min significant (%) max min significant (%)
JS div −0.714 −0.271 35 (72.9) −0.654 −0.262 35 (72.9) JS div smoothed −0.712 −0.269 35 (72.9) −0.649 −0.279 33 (68.8) KL div summary-input −0.736 −0.276 35 (72.9) −0.628 −0.261 35 (72.9) % of input topic words 0.701 0.286 31 (64.6) 0.693 0.279 29 (60.4) cosine overlap - all words 0.622 0.276 31 (64.6) 0.618 0.265 28 (58.3) KL div input-summary −0.628 −0.262 28 (58.3) −0.577 −0.267 22 (45.8) cosine overlap - topic words 0.597 0.265 30 (62.5) 0.689 0.277 26 (54.2) % summary = topic words 0.607 0.269 23 (47.9) 0.534 0.272 23 (47.9) multinomial summary prob. 0.434 0.268 8 (16.7) 0.459 0.272 10 (20.8) unigram summary prob. 0.292 0.261 2 (4.2) 0.466 0.287 2 (4.2)
regression 0.736 0.281 37 (77.1) 0.642 0.262 32 (66.7)
ROUGE-1 recall 0.833 0.264 47 (97.9) 0.754 0.266 46 (95.8)
ROUGE-2 recall 0.875 0.316 48 (100) 0.742 0.299 44 (91.7)
content selection quality in only 77% of the cases. For example, a set of documents, each describing a different opinion on an issue, is likely to have less repetition on both the lexical and content unit levels. Because the input–summary similarity metrics rely on the word distribution of the input for clues about important content, their predictiveness will be limited for such inputs.8 Follow-up work to our first results on fully automatic evaluation by Saggion et al. (2010) has assessed the usefulness of the JS divergence measure for evaluating summaries from other tasks and for languages other than English. Whereas JS divergence was significantly predictive of summary quality for other languages as well, it did not work well for tasks where opinion and biograph-ical type inputs were summarized. We provide further analysis and some examples in Section 7.
Overall, the micro level results suggest that the fully automatic measures we ex-amined will not be useful for providing information about summary quality for an individual input. For averages over many test sets, the fully automatic evaluations give more reliable results, and are highly correlated with rankings produced by manual evaluations. On the other hand, model summaries written for the specific input would give a better indication of what information in the input was important and interesting. This is indeed the case as we shall see from the ROUGE scores in the next section.
4.3.2 Comparison with ROUGE.The aim of our study is to assess metrics for evaluation in the absence of human gold standards, scenarios where ROUGE cannot be used. We do not intend to directly compare the performance of ROUGE with our metrics,
therefore. We discuss the correlations obtained by ROUGE in the following, however, to provide an idea of the reliability of our metrics compared with evaluation quality that is provided by ROUGE and multiple human summaries.
At the macro level, the correlation between ROUGE-1 and pyramid scores is 0.85 (Table 2). For ROUGE-2 the correlation with pyramid scores is 0.90, practically identical with JS divergence.
Because the performance of these two measures seem close, we further analyzed their errors. The focus of this analysis is to understand if JS divergence and ROUGE-2 are making errors in ordering the same systems or whether their errors are different. This result would also help us to understand if ROUGE and JS divergence have com-plementary strengths that can be combined. For this, we considered pairs of systems and computed the better system in each pair according to the pyramid scores. Then, for ROUGE-2 and JS divergence, we recorded how often they provided the correct judgment for the pairs as indicated by the pyramid evaluation. There were 1,653 pairs of systems at the macro level and the results are in Table 4.
This table shows that a large majority (80%) of the same pairs are correctly predicted by both ROUGE and JS divergence. Another 6% of the pairs are such that both metrics do not provide the correct judgment. Therefore, ROUGE and JS divergence appear to agree on a large majority of the system pairs. There is a small percentage (14%) that is correctly predicted by only one of the metrics. The chances of combining ROUGE and JS divergence to get a better metric appears small, therefore. To test this hypothesis, we trained a simple linear regression model combining JS divergence and ROUGE-2 scores as predictors for the pyramid scores and tested the predictions of this model on data from TAC 2009. The combination did not give improved correlations compared with using ROUGE-2 alone.
In the case of manual responsiveness, which combines aspects of linguistic quality along with content selection evaluation, the correlation with JS divergence is 0.73. For ROUGE, it is 0.80 for R1 and 0.87 for R2. Here, ROUGE-1 outperforms all the fully automatic evaluations. This is evidence that the human gold-standard summaries provide information that is unlikely to ever be approximated by information from the input alone, regardless of feature sophistication.
At the micro level, ROUGE clearly does better than all the fully automatic measures for replicating both pyramid and responsiveness scores. The results are shown in the last two rows of Table 3. ROUGE-1 recall obtains significant correlations for over 95% of inputs for responsiveness and 98% of inputs for pyramid evaluation compared to 73% (JS divergence) and 77% (regression). Undoubtedly, at the input level, comparison with model summaries is substantially more informative.
[image:15.486.55.437.618.663.2]When gold-standard summaries are not available, however, our features can pro-vide reliable estimates of system quality when averaged over a set of test inputs.
Table 4
Overlap between ROUGE-2 and JS divergence predictions for the best system in a pair (TAC 2008, 1,653 pairs). The gold-standard judgment for a better system is computed using the pyramid scores.
JSD correct JSD incorrect
ROUGE-2 correct 1,319 (79.8%) 133 (8.1%)
Table 5
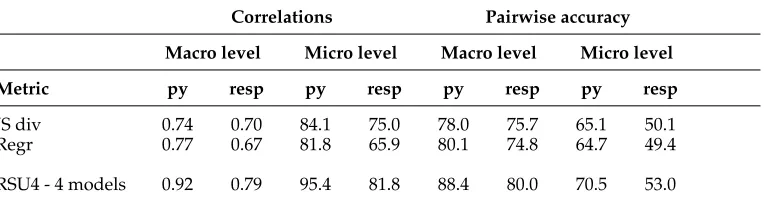
Input–summary similarity evaluation: Results on TAC’09 (53 systems).
Correlations Pairwise accuracy
Macro level Micro level Macro level Micro level
Metric py resp py resp py resp py resp
JS div 0.74 0.70 84.1 75.0 78.0 75.7 65.1 50.1
Regr 0.77 0.67 81.8 65.9 80.1 74.8 64.7 49.4
RSU4 - 4 models 0.92 0.79 95.4 81.8 88.4 80.0 70.5 53.0
4.3.3 Results on TAC’09 Data.To evaluate our metrics for fully automatic evaluation, we make use of the TAC’09 data. The regression metric was trained on all of the 2008 data with pyramid scores as the target. Table 5 shows the results on the TAC’09 data. We also report the correlations obtained by ROUGE-SU4 because it was the official baseline measure adopted at TAC’09 for comparison of automatic evaluation metrics.
The correlations are lower than on our development set. The highest correlation at macro level is 0.77 (regression) in contrast to 0.88 (JS divergence) and 0.86 (regression) obtained on the TAC’08. The regression metric turns out better than JS divergence on the TAC’09 data for predicting pyramid scores. JS divergence continues to be the best metric on the basis of correlations with responsiveness, however.
In terms of the pairwise scores, the automatic metrics have 80% accuracy in pre-dicting the pyramid scores at the system level, about 8% lower than that obtained by ROUGE. For responsiveness, the best accuracy is obtained by regression (75%). This result shows that the ranking according to responsiveness is likely to have a large number of flips. ROUGE is 5 percentage points better than regression for predicting responsiveness but this value is still low compared to accuracies in replicating the pyramid scores.
The pairwise accuracy at the micro level is 65% for the automatic metrics and here the gap between ROUGE and our metrics is 5 percentage points but it is a significant percentage as the total pairs at micro level are about 60,000 (all pairings of 53 systems in 44 inputs).
Overall, the performance of the fully automatic evaluation is still high for use during system development. A further advantage is that these metrics are consistently predictive across two years as shown by these results. In Section 7, we analyze some reasons for the difference in performance in the two years. In terms of best metrics, both JS divergence and regression turn out to be useful with little difference in performance between them.
evaluation using a single gold-standard summary as compared to using several gold standards.
To tackle this problem, we propose the use of pseudomodel system summaries. Our approach is as follows: We first predict the scores of systems on the basis of the few available models. The top ranking systems from this evaluation are then considered as “pseudo-models;” their summaries are added to the gold-standard set along with the existing human models. The final evaluation scores are produced by comparison with this expanded model set—original model summaries plus the pseudomodels. Our hypothesis is that the scores produced after the addition of pseudomodels would be more reliable and correlate better with human scores compared with evaluation using a single model summary.
Before we describe our method, we provide a glimpse of the variation in evaluation quality depending on the number of models used. Previous studies have shown that at the system level, system rankings even with a single model will be stable when computed over a large enough number of test inputs. Harman and Over (2004) show that the relative ranks of systems computed using one model do not change when computed using another model when the number of inputs is large. Again under the same conditions of having a large number of inputs, Lin (2004a) and Owkzarzak and Dang (2009) show that ROUGE correlations with human scores are stable when using few human models. In machine translation evaluation, similar results are noted by Zhang and Vogel (2010), who found that the lack of additional reference translations can be handled by evaluating the systems on more test examples.
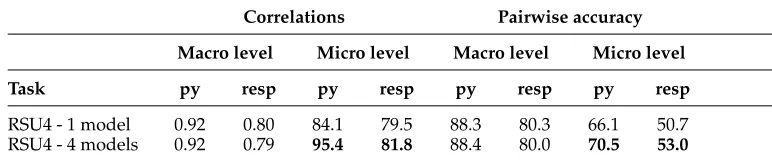
Multiple models are particularly important for evaluation at the level of individual inputs, however. Table 6 shows the difference in correlations and pairwise accuracy of ROUGE with human scores when one and four model summaries are used. We picked the first model in alphabetical order of their names for the computation of correlation between metrics and a single model.
[image:17.486.50.436.582.663.2]At the system level, the correlations from both set-ups are similar. But at the micro level, there is considerable difference in performance. Using all four models, significant correlations with pyramid scores are obtained for 95% of the inputs. The evaluations that rely on a single model produce significant correlations for only 84% of the inputs, however. For responsiveness scores, which are model-independent, we see that the micro-level evaluations have a smaller increase as more models are added (79% to 81%). Again in terms of pairwise accuracy, the accuracy in predicting micro-level pyramid scores improves by 4% when additional models are used and the improvement is 3% for predicting responsiveness scores. Given this difference in performance when one and many models are used, we investigate how to improve evaluation when only one model is available.
Table 6
ROUGE evaluation with different number of models: macro level (Spearman correlations), micro level (percentage of inputs with significant correlations on TAC’09 data). No. of systems = 53.
Correlations Pairwise accuracy
Macro level Micro level Macro level Micro level
Task py resp py resp py resp py resp
We explore the possibility of augmenting the model set with good system sum-maries. These system summaries or “pseudomodels” are chosen to be the ones which receive high scores based on the one available model summary. We expect that the benefit of pseudomodels will be noticeable in micro-level correlations with pyramid scores. At the macro level, even with multiple human models there is no improvement in correlations compared with a single model, and the addition of less-ideal system summaries is not likely to be better than adding human summaries.
5.1 Related Work
The idea of using system output for evaluation was introduced in the context of machine translation by Albrecht and Hwa (2007, 2008). In their method, Albrecht and Hwa (2007) designate some systems to act as pseudoreferences. Then, every candidate translation to be evaluated is compared to the translations produced by the pseudoreferences using a variety of similarity metrics. Each similarity value is then used as a feature and trained to predict the human assigned score for that candidate translation. They show that the scores produced by their regression metric using only system-based references correlates with human judgments to the same extent as scores produced using multiple human reference translations. Also, when the regression method was used with human references and some pseudoreferences put together, the correlations obtained by the final metric was better than using the human references alone.
In Albrecht and Hwa (2007), pseudoreferences of different quality—best, moderate and worst—are chosen using the gold-standard judgments and evaluated for use as pseudoreferences. They found that having the best systems as pseudoreferences worked best, although even adding the worst system as pseudoreference gave reasonable per-formance as their regression approach is trained to predict quality by comparison to the standard of the reference. In their work, however, pseudoreferences of different quality are chosen in an oracle manner (using the human-assigned scores). This setting is not practical because it depends on the actual system scores. In later work, Albrecht and Hwa (2008) use off-the-self machine translation systems as pseudoreferences and show that they can contribute to good results. This later work is a more realistic set-up and here regression is important because we have no guarantees as to the quality of the off-the-shelf systems on the test data.
A similar idea of augmenting machine output to human gold standard was ex-plored in Madnani et al. (2007) in the context of machine translation (MT). For tuning MT systems, often multiple reference translations are required. Madnani et al. aug-mented reference translations of a sentence with automatically generated paraphrases of the reference. They found in the experiments that such augmentation helped in MT tuning—the number of reference translations needed could be cut in half and compensated with automatic paraphrases.
5.2 Choice of Pseudoreference Systems
For this evaluation, the choice of the pseudoreference system is an important step. In this section, we detail some development experiments that we performed to understand how to best choose such pseudoreferences for the summary evaluation task.
oracle human-assigned scores. The remaining systems were taken as the evaluation set. For each summary in the evaluation data, we computed features to indicate their similarity with the summaries of the chosen pseudoreference systems. Our similarity features were the recall scores from ROUGE overlaps. We computed one feature each for unigram, bigram, trigram, and four-gram ROUGE scores. Each of these four features is computed for each pseudoreference summary.
The scores are used in a linear regression model to predict the summary score. We used a cross-validation approach where the summaries from one of the evaluation systems were used as the test set and the summaries from the remaining systems are used for training the regression model. Then the average predicted score of each system in the evaluation data was computed and compared with their average scores as assigned during manual evaluations.
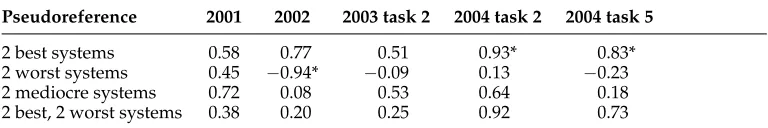
The experiment was performed using data from four years of DUC conferences, 2001 to 2004. The manual scores in these earlier DUC years were the content coverage scores (described in Section 2.1), which use a single model summary for comparison. Table 7 shows the Spearman correlations between the scores from evaluations only against the pseudoreferences and those from the manual evaluation with the single model. The different settings for choice of pseudoreference systems are also indicated.
These results showed that using the best systems as pseudoreferences provided the best performance across different years. When only worst or only mediocre systems were used, the performance was much worse for predicting system scores. Even when the best systems were augmented with the worst systems as pseudoreferences, the evaluation quality decreased compared with using the best systems only.
[image:19.486.53.437.582.646.2]Whereas Albrecht and Hwa (2007, 2008) obtained a slight improvement by also using a worst quality pseudoreference in the mix, for summarization it is better to have only the best systems. One reason for this difference could be that for summary eval-uation, examples of worse summaries are not very informative. Two good summaries may have considerable variation in the content. When a summary is similar to a best system, therefore, we can say that the candidate summary is also of good quality. On the other hand, when a candidate summary is similar to a worst system summary, it may either be a worse summary or it may be a good summary with different content than the best system’s summary. Indeed, when ROUGE was first introduced, it was heavily emphasized that it is a recall measure and that precision-oriented measures do worse. Hence the weights learned for the similarity with the worst system may not be very informative. In summarization, the space of both good summaries and worse summaries for the same input is large. Having more examples of good sum-maries appears to benefit evaluation more compared with having samples of worst quality.
Table 7
Spearman correlations between pseudoreference-based regression scores and manual content scores. The first column lists the type of pseudoreference chosen.
Pseudoreference 2001 2002 2003 task 2 2004 task 2 2004 task 5
2 best systems 0.58 0.77 0.51 0.93* 0.83*
2 worst systems 0.45 −0.94* −0.09 0.13 −0.23
2 mediocre systems 0.72 0.08 0.53 0.64 0.18
2 best, 2 worst systems 0.38 0.20 0.25 0.92 0.73
Because the best systems turned out to have the maximum potential for acting as pseudoreferences, we wanted a way to identify some best systems without having to rely on the oracle scores, as before. This idea is feasible for our set-up. In our evaluation, we aimed to augment an existing model, so we used the available model to automatically obtain an idea of some of the good systems from the pool. Then we chose some of these top systems as pseudoreferences and combined them with the one available model to form the reference set for final evaluation. Because the reference set has mostly best summaries, we did not use a regression approach based on similarity to the different references. Rather, we considered all of them as models and computed a single ROUGE score comparing a system summary with the pool of model plus pseudomodel summaries.
5.3 Experimental Set-up
We now detail our experiments on the TAC 2009 data.
TAC provides four model summaries for each input. We assume that only one is available and choose a model for each input: the first in alphabetical order of identifier names. Based on this model, we compute the RSU4 scores for all systems. We use two methods to choose the pseudomodel systems.
In the first approach, we rank all the systems based on their average scores over the entire test set. The summaries of the top three overall best systems (global selection) are added to the set of models for all inputs. Alternatively, we also investigate a different selection method. Foreach input, the top scoring three summaries are added as models forthatinput (local selection). In both cases RSU4 was used to identify the best systems according to the single available gold standard.
The final rankings for all systems are produced using the RSU4 comparison based on the expanded set of models (1 human model + 3 pseudomodel summaries). We implemented a jackknifing procedure so that the systems selected to be pseudomodels (and therefore reference systems) could also be compared to other systems. For each input, one of the reference systems (pseudomodels or human model) was removed at a time from the set of models and added to the set of systems. The scores for the systems were then computed by comparison with the three remaining models. The final score for a system summary (not a pseudomodel) is the mean value of the scores with the four different sets of reference summaries created by the jackknifing procedure. For pseudomodel systems, a single score value will be obtained per input resulting from the comparison with the other three models.
5.4 Results
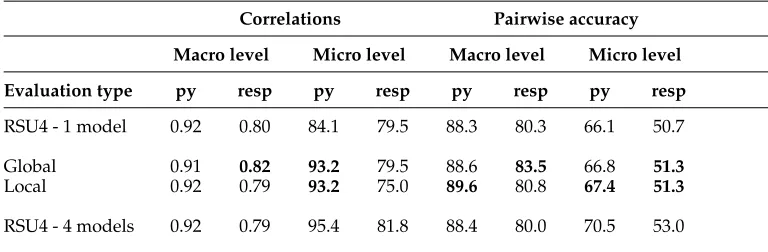
The system and input level performance before and after the addition of pseudomodels is shown in Table 8. The performance using four human models is shown in the last line for comparison.
At the macro level, the pseudomodel summaries provide little improvements. Only for the global model is there an increase in correlation, from 0.80 to 0.82.
Table 8
Performance before and after the addition of pseudomodel summaries: TAC’09 data (53 systems).
Correlations Pairwise accuracy
Macro level Micro level Macro level Micro level
Evaluation type py resp py resp py resp py resp
RSU4 - 1 model 0.92 0.80 84.1 79.5 88.3 80.3 66.1 50.7
Global 0.91 0.82 93.2 79.5 88.6 83.5 66.8 51.3
Local 0.92 0.79 93.2 75.0 89.6 80.8 67.4 51.3
RSU4 - 4 models 0.92 0.79 95.4 81.8 88.4 80.0 70.5 53.0
For responsiveness scores that are model-independent, however, little improve-ments are seen at both macro and micro levels. The pairwise accuracy at micro level for responsiveness is 1% better after the addition of the pseudomodels.
Comparing the two methods for selecting the best system that can serve as a pseudomodel, the global selection of the system that performed best over the entire available data set appears to be more desirable. It improves the correlations with pyra-mid scores while keeping the same correlations with responsiveness as with one model. Local selection provides the same performance as global selection for pyramid scores, although it decreases the micro-level evaluation quality for responsiveness.
6. Consensus-Based: Evaluation Using Only Collection of System Summaries From our experiments with pseudomodels, we see that the addition of system sum-maries to available models proved beneficial and improved the micro-level performance of ROUGE. One question that arises is whether the collection of system summaries together will be useful for evaluation without any human models at all. Again, this idea is related to model-free evaluation. When several systems are available, we investigate if their collective knowledge can help assess summary quality.
Systems use varied methods to select content, and agreement among systems could be indicative of important information. This intuition is similar to that behind the man-ual pyramid method: Facts mentioned only in one human summary are less important compared to content that is mentioned in multiple human models. For the experiments reported in this section, we rely entirely on the combined knowledge from system summaries as a gold standard.
6.1 Related Work
Soboroff, Nicholas, and Cahan (2001) combine the topnresults from all the systems and then sample a certain number of documents from this pool. Those documents selected by many systems are more likely to be in the chosen sample and assumed to be most relevant. The systems are then evaluated by considering this chosen set of documents as the gold-standard relevant set.
In our work, we do not attempt to pick out common content explicitly from the summary pool. If we were to follow the same approach as IR, we would be sampling sentences from the summary pool. But in multi-document summarization, sentences from different documents could contain similar content and we do not want to sample one sentence and use it in the gold standard because then systems would be penalized for choosing other similar sentences. In our work, therefore, we break down the sen-tences and represent the content as a probability distribution over words. A summary is evaluated by comparing its word distribution to that of the pool. We expect that the distribution would implicitly capture the common content.
6.2 Evaluation Set-up
For each input, we collect all the summaries produced by automatic systems and calculate the probabilities of words in the combined set. In this way, we obtain a global probability distribution of words selected in system summaries. In this distribution, the content selected by multiple systems will be more prominent, representing the more important information. The word probabilities from each individual summary are then calculated and compared to the overall distribution using JS divergence. If we assume that system summaries are collectively indicative of important content, then good summaries will tend to have properties that are similar to this global distribution, resulting in low divergence values. We compute the correlations of these divergence values with human-assigned summary scores and Table 9 shows the results from this evaluation.
6.3 Results
[image:22.486.51.432.572.665.2]The correlations are on par with those based on multiple human gold standards. At both macro and micro levels, the correlations and pairwise accuracy are similar to those obtained by ROUGE comparison with four human models. The macro-level correlation is 0.93 with pyramid scores, which is very high for a metric that uses no human input at all. Further, the micro-level correlations are also significant for 90% of the inputs. In our pseudomodel experiments, the gains after the addition of system summaries were
Table 9
Performance of consensus evaluation approach on TAC’09 data (53 systems). For input level (micro), the percentage of inputs with significant correlations is reported.
Correlations Pairwise accuracy
Macro level Micro level Macro level Micro level
Evaluation type py resp py resp py resp py resp
SysSumm 0.93 0.81 90.9 86.4 88.8 80.7 65.2 52.7
modest (only at micro level). Here we see that a large collection of system summaries by themselves have the information required for evaluation.
From this experiment, we find that consensus among system summaries is indica-tive of important content. This result suggests that by combining the content selected by multiple systems, one might be able to build a summary that is better than each of them individually. In fact, this idea of system consensus has been utilized in the development of MT systems for quite some time. One approach in MT is rescoring the n-best list from an individual system’s decoder, and picking the (consensus) translation that is close on average to all translations. Such rescoring is implemented using a minimum Bayes risk technique (Kumar and Byrne 2004; Tromble et al. 2008). The other approach is system combination where the output from multiple systems is combined to produce a new translation. Several techniques including minimum Bayes risk have been applied to perform system combination in machine translation. Shared tasks on system combination have also been organized in recent years to encourage the development of such methods (Callison-Burch et al. 2010, 2011). Such strategies could be a useful direction to explore for summarization as well.
7. Discussion
In this article, we have discussed metrics for summary evaluation when human sum-maries are not present. Our results have shown that these metrics in fact correlate highly with human judgments. But we also need to understand how robust these metrics are and be aware of their limitations. In this section, therefore, we provide a brief discussion of the use of these metrics in different settings.
7.1 Including Input–Summary Similarity or Consensus-Based Measures in a Summarization System
Firstly, because input–summary similarity features are computed using the input, they can be useful features to incorporate in a summarization system. The combination of systems to perform evaluation also provides a way to build a better system. The concern would be how the usefulness of these metrics will change if systems were also optimizing for them. To optimize a metric such as JS divergence exactly would be difficult because the JS divergence score cannot be factored or divided among individual sentences, a necessary condition if the problem should be solved using an Integer Linear Program as in McDonald (2007) and Gillick and Favre (2009). Therefore only greedy methods are possible. In fact, KL divergence was greedily optimized in Haghighi and Vanderwende (2009) to obtain a high performance summarizer. Gaming the evaluation should carry little concern, however, as these metrics are proposed with a view to tuning systems.
and grammatical sentences, and maintaining non-redundancy. Systems should there-fore be optimizing for a wide variety of factors and thus input–summary similarity and consensus evaluation can be used in the final output to measure the content quality of the summary. Any content evaluation should obviously be accompanied by linguistic quality evaluation in contrast to the current trend to only report content scores.
The high performance of the JS divergence metric also has another implication for system development. On average, the JS divergence measure is highly predictive of summary quality. It indicates that for a large number of inputs in the TAC data sets, good content can be predicted with high accuracy just based on the input’s term distributions. Such inputs should therefore be easy to summarize for systems. Although discourse-based and other semantic approaches to summarization have been proposed, most of the systems in TAC rely on surface features such as word distributions. In this situation, we may not be focusing on robust systems that can handle a variety of inputs. In the early years of DUC, the test set comprised a variety of inputs such as biographies, collections of multiple events, opinions, and descriptions of single events. Later years switched to more single-event-type test sets. The results from our analysis point out that current inputs might be too simple for systems and that the range of inputs in the TAC conference should be expanded to include some input types where more sophisticated methods become necessary. Perhaps the input–summary similarity metrics will be helpful in picking out those inputs that need deeper analysis. In the following section, we provide some further analysis into the cases where the input– summary similarity turns out less predictive.
7.2 Input–Summary Similarity and Dependence on Input Characteristics
JS divergence is useful for the average rating of systems on the test set and, in our case, we have 44 examples over which the scores are averaged. At the micro level, certain inputs received poor evaluations from JS divergence. Here we provide some insights into the types of inputs where JS divergence worked and the cases which proved difficult.
Table 10 shows the titles of articles in input D0913, the input that received the best evaluation from JSD (correlation of 0.86). These articles were all published on the same day and deal with the same event, a Supreme Court hearing of a case. This input can be said to be highly cohesive and to be discussing the same topic. For such inputs, the term distribution in the input would reflect content importance since some words have higher probability than others because they are discussed repeatedly in the input documents. Such a term distribution when compared with summaries will give good evaluation performance. We can also see that the human summaries for this input (also shown in Table 10) seem to report the common issues observed in the input. In this case, therefore, input–summary similarity scores can predict the pyramid scores that were assigned based on the model summaries. We also show in the table the summary that is chosen to be best according to JS divergence and the summary that had the worst score. We find that the best summary indeed conveys some of the main issues also reported in the human summaries. On the other hand, the low-scoring summary presents a story line about one of the lawyers involved in the case, which is a peripheral topic described in only one of the input documents. In fact, the summary scored as worst by JS divergence has a pyramid score of 0, whereas the chosen best summary has a pyramid score of 0.39.