Original Article
Gemstone spectral imaging of coronary
artery based on ASIR
Ying Zhang1, Yang-Li Wan2, Juan Song3
1Department of Radiology, Affiliated Midong Hospital of People’s Hospital of Xinjiang Uygur Autonomous Region,
No.3740, Midong South Road, Urumqi 830019, China; 2Department of Imaging, Shihezi People’s Hospital, No. 45,
North 3 Road, Shehezi 832000, China; 3Department of CT/MRI, The First Affiliated Hospital to Shihezi University
Medical College, No. 107, North 2 Road, Shihezi 832000, China
Received May 5, 2019; Accepted July 10, 2019; Epub August 15, 2019; Published August 30, 2019
Abstract: Background: Gemstone spectral imaging (GSI) is able to produce dual energy with the aid of fast kilo-voltage (kVp)-switching technique. The monochromatic images at energy levels ranging from 40 to 140 keV are able to be derived. Adaptive statistical iterative reconstruction (ASIR) can optimize image quality through reducing image noise. The optimal monochromatic energy levels for multiple tissues at different backgrounds have been
preliminarily investigated. However, the influence of background, gender and body mass index (BMI) on the optimal
monochromatic energy level for gemstone spectral imaging of coronary artery based on ASIR has not been reported yet. Objectives: To investigate the influence of background, gender and BMI on the optimal monochromatic energy
level for GSI of the coronary artery based on ASIR. Methods: A total of 90 patients received dual-energy scan of GSI of the coronary artery. Raw data were reconstructed with ASIR. Muscle, fat and myocardium were selected as back-grounds, respectively. CT values and image noise were collected, which were used to calculate the optimal
mono-chromatic energy levels for the left anterior descending (LAD), left circumflex (LCX) and right coronary artery (RCA).
Results: The optimal monochromatic energy levels for LAD, LCX and RCA using muscle as background were not
statistically different between male and female (66.43±0.93 vs 66.41±0.79 for LAD, 66.44±0.94 vs 66.46±0.84
for LCX, and 66.55±1.00 vs 66.54±0.84 for RCA). The optimal monochromatic energy levels for LAD, LCX and RCA
using muscle as background were not statistically different between normal and overweight group (66.69±0.67 vs
66.48±1.00 for LAD, 66.73±0.78 vs 66.50±1.00 for LCX, and 66.85±0.62 vs 66.62±1.09 for RCA), but both of them were higher than in the obese group (vs 65.94±0.59 for LAD, vs 65.97±0.57 for LCX, and vs 65.97±0.63 for RCA). The optimal monochromatic energy levels for LAD, LCX and RCA showed the same trend of fat > muscle >
myocardium (69.71±0.87 vs 66.68±0.70 vs 64.74±0.63 for LAD, 69.80±0.62 vs 66.67±0.65 vs 64.90±0.71 for
LCX, and 69.64±0.70 vs 66.64±0.78 vs 64.96±0.60 for RCA). Conclusions: The separate background of ASIR and
BMI had certain influence on the optimal monochromatic energy levels for LAD, LCX and RCA.
Keywords: Gemstone spectral imaging, optimal monochromatic energy level, coronary artery, background, body mass index, gender
Introduction
Polychromatic imaging in conventional CT ca- uses averaging attenuation of CT values and reduces the image quality [1]. Gemstone spec-tral imaging (GSI) is able to produce dual ener-gy with the aid of a fast kilovoltage (kVp)-switch-ing technique [2]. The monochromatic images at energy levels ranging from 40 to 140 keV are able to be derived, which can eliminate averag-ing attenuation of CT values induced by poly-chromatic imaging [3]. However, the image qu- ality at different energy levels varies. The image
with the best quality can be acquired at the optimal monochromatic energy level, which has the optimal contrast-to-noise ratio (CNR) [4, 5]. Adaptive statistical iterative reconstruction (ASIR) can optimize image quality through re- ducing the image noise. Therefore, it is widely applied in spectral imaging. However, the
sepa-rate background of ASIR may have an influence
Gemstone spectral imaging of coronary artery
influence of background, gender and body ma-ss index (BMI) on the optimal monochromatic
energy level for gemstone spectral imaging of coronary artery based on ASIR was investigat-ed in this study.
Materials and methods
Participants
A total of 90 patients scheduled for CT coro- nary angiography were enrolled between Ja- nuary and April in 2016. They included 43 mal- es and 47 females. The average was (53.0±6.8) years, (25.0±2.1) Kg/m2 and (53.0±6.3)/min,
respectively for age, BMI and heart rate. All
patients received dual-energy scan with GSI. Raw data were reconstructed with ASIR. Mu- scle, fat and myocardium were selected as backgrounds, respectively. The patients were divided into male (n=43) and female (n=47) groups according to gender, as well as normal (18.5 kg/m2<BMI<24 kg/m2, n=30), overweight (24 kg/m2≤BMI<28 Kg/m2, n=39) and obese
(BMI≥28 Kg/m2, n=21) according to BMI. The optimal monochromatic energy levels for the
left anterior descending (LAD), left circumflex (LCX) and right coronary artery (RCA) was deter -mined with GSI Viewer software package. Inclusion and exclusion criteria
The inclusion criteria of participants included (1) clinical suspected coronary heart disease patients; (2) a heart rate less than 65 beats/ min; (3) no contraindications for enhanced sc- an; and (4) written informed consents. The ex- clusion criteria included (1) arrhythmia or a he- art rate greater than 65 beats/min; (2) severe
cardiac, hepatic and renal insufficiency; (3)
al-lergic to contrast agents; and (4) obvious thy-roidism or severe thyrotoxicosis.
CT scan protocol
Discovery CT 750HD (GE healthcare, Milwau- kee, WI) was employed. A high-pressure injec-tor with binocular tube (Ulrich, Germany) was used to inject the contrast agent (iopamidol 370 mgI/mL) via right upper extremity vein. CT values of the upper segment of the thoracic aorta were detected using contrast tracer tech-nique. The threshold was set to 100 HU and monitored at a frequency of 1 time/sec. Sca- nning was triggered when the threshold was
reached, ranging from 1 cm under bronchial bifurcation to 2 cm under cardiac base. Dual-energy GSI mode was employed with a fast tube voltage switching between 80 and 140 kVp. Scanning parameters included tube volt-age period 0.25 ms, rotation speed 0.35 s/r, thickness 0.625 mm. All patients received a dosage of 0.8 mL/Kg of the contrast agent at an injection rate of 5 mL/s and a bonus of 20 mL of saline at the same injection rate after the contrast agent.
Image reconstruction
The 65 keV monochromatic images were recon-structed using ASIR. The reconrecon-structed images were transferred to GE AW 4.6 station with GSI Viewer software package (GE Medical Systems, Waukesha, WI). Regions of interest (ROIs) were
chosen in the LAD, LCX and RCA. ROIs should
have areas as large as possible based on the actual condition and kept away from blood
ves-sels and calcification. Muscle, fat and myocar -dium were selected as the background, at the same level as ROIs. The optimal
monochromat-ic energy levels for the LAD, LCX and RCA at dif -ferent backgrounds were then calculated. Each artery was measured 3 times and the average was obtained.
Statistical analysis
The SPSS 19.0 software (SPSS Inc., USA) was
used to perform statistical analysis, and signifi -cance was set at P<0.05. Normality of data was evaluated with Kolmogorov-Smirnov test. Nor- mal data were expressed as mean ± standard deviation (SD). Covariance analysis was em- ployed to compare the optimal monochromatic energy level between male and female groups, as well as between normal, overweight and obese groups. One-way ANOVA was employed to compare the optimal monochromatic energy levels at different backgrounds, and Post Hoc Multiple Comparisons were performed with Student Newman Keuls method.
Results
Influence of gender on optimal monochromatic energy levels
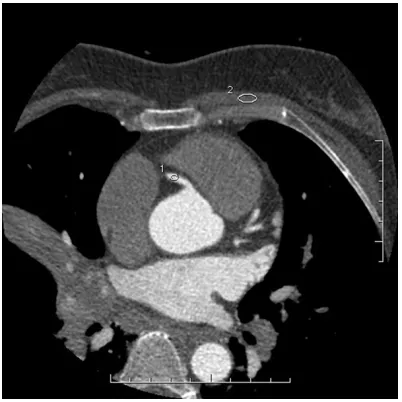
Figure 3. CT values and image noise of RCA using muscle as background, in a male 51 years old and
with a BMI of 23.4 Kg/m2 (normal group). (1) for RCA,
and (2) for background.
calculate the optimal monochromatic energy level.
Covariance analysis was performed using the optimal monochromatic energy level as
depen-dent variable, gender as fixed factor and age, BMI and heart rate as covariates. The results
demonstrated that the optimal monochromatic energy levels for LAD (66.43±0.93 vs 66.41±
0.79 keV), LCX (66.44±0.94 vs 66.46±0.84
keV) and RCA (66.55±1.00 vs 66.54±0.84 keV) using muscle as background were not statisti-cally different between males and females (all P > 0.05). Therefore, gender had no influence
on the optimal monochromatic energy levels
for LAD, LCX and RCA.
Influence of body mass index on optimal monochromatic energy levels
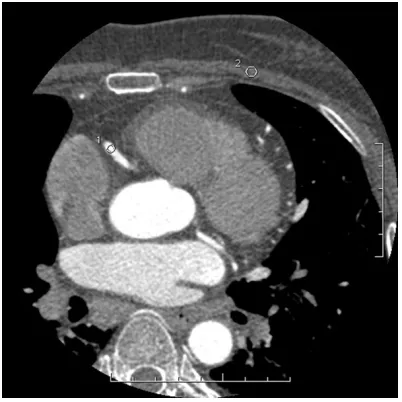
The CT values and image noise of RCA using muscle as background in normal, overweight and obese groups are shown in Figures 3-5, which were used to calculate the optimal mono-chromatic energy level.
Normal group included 12 males and 18 fe- males, overweight group included 19 males and 20 females, obese group included 12 males and 9 females. The distribution of gen-der was not statistically different between nor-mal, overweight and obese groups (P > 0.05).
Covariance analysis was performed using the optimal monochromatic energy level as
depen-dent variable, BMI grouping as fixed factor and
age and heart rate as covariates. The results showed that the optimal monochromatic ener-gy levels for LAD (66.69±0.67 vs 66.48±1.00
keV), LCX (66.73±0.78 vs 66.50±1.00 keV) and
RCA (66.85±0.62 vs 66.62±1.09 keV) using muscle as background were not statistically
dif-Figure 1. CT values and image noise of RCA using muscle as background, in a male 65 years old and
with BMI of 29.2 Kg/m2. (1) for RCA, and (2) for
back-ground.
Figure 2. CT values and image noise of RCA using muscle as background, in a female 60 years old,
with BMI of 29.2 Kg/m2. (1) for RCA, and (2) for
[image:3.612.89.289.72.269.2] [image:3.612.89.290.345.546.2]Gemstone spectral imaging of coronary artery
Figure 6. CT values and image noise of RCA of a
male 49 years old and BMI of 25.2 Kg/m2 using fat
as background. (1) for RCA, and (2) for background.
ferent between normal and overweight group (all P > 0.05). However, the optimal monochro -matic energy levels for LAD (66.69±0.67 vs
65.94±0.59 keV), LCX (66.73±0.78 vs 65.97±
0.57 keV) and RCA (66.85±0.62 vs 65.97±0.63
keV) using muscle as background were signifi -cantly higher in the normal than in the obese group (all P<0.05), and the optimal monochro-matic energy levels for LAD (66.48±1.00 vs
65.94±0.59 keV), LCX (66.50±1.00 vs 65.97±
0.57 keV) and RCA (66.62±1.09 vs 65.97±0.63 keV) using muscle as background were also
sig-nificantly higher in the overweight than in the
obese group (all P<0.05). Therefore, BMI had a certain influence on optimal monochromatic energy levels for LAD, LCX and RCA.
Influence of background on optimal monochro
-matic energy levels
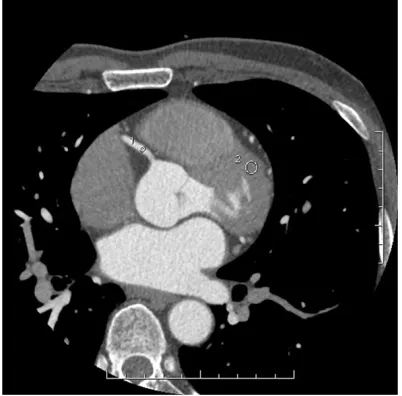
The CT values and image noise of RCA based on different backgrounds are demonstrated in Figures 6-8, and were used to calculate the optimal monochromatic energy level.
According to the results of one-way ANOVA, the optimal monochromatic energy levels for LAD (69.71±0.87 vs 66.68±0.70 vs 64.74±0.63
keV), LCX (69.80±0.62 vs 66.67±0.65 vs
64.90±0.71 keV) and RCA (69.64±0.70 vs 66.64±0.78 vs 64.96±0.60 keV) showed the
same significant trend of fat > muscle > myo -cardium (all P<0.05). Therefore, background
had a certain influence on optimal monochro
-matic energy levels for LAD, LCX and RCA.
Discussion
[image:4.612.89.290.71.270.2]GSI can obtain 101 monochromatic images at energy levels ranging from 40 to 140 keV, and the image with the optimal CNR provides the best image quality. The corresponding energy
Figure 4. CT values and image noise of RCA using muscle as background, in a male 60 years old and
with BMI of 26.4 Kg/m2 (weight group). (1) for RCA,
and (2) for background.
Figure 5. CT values and image noise of RCA using muscle as background, in a female 58 years old and
with BMI of 30.1 Kg/m2 (obese group). (1) for RCA,
[image:4.612.89.290.345.546.2]Figure 8. CT values and image noise of RCA of a male
49 years old and BMI of 25.2 Kg/m2 using muscle
as background. (1) for RCA, and (2) for background.
level is the optimal monochromatic energy le- vel. Monochromatic images have been widely applied in clinical practice, including diagnos-ing tumors, analyzdiagnos-ing urinary calculi, displaydiagnos-ing abdominal vessels and so on [6-9]. The optimal monochromatic energy levels for multiple tis-sues at different backgrounds have been re- ported.
Jia et al, [10] investigated the application of GSI in a multi-parameter quantitative measure-ment of lung cancer using the same ROI in the thoracic aorta as background. Their results de- monstrated that the optimal monochromatic energy level for displaying lung cancer on plain scan, arterial phase and venous phase was 62.2±5.38 keV, 50.63±3.84 keV, and 52.5±3.7 keV, respectively. Yu et al, [11] investigated the application of GSI and ASIR in pediatric abdom-inal CT patients with solid tumors. Their results showed that the optimal monochromatic ener-gy level was 40 keV for displaying abdominal vessels. Lin et al, [12] investigated the applica-tion of GSI in the brain. Their results showed that the optimal monochromatic energy level for displaying brain parenchyma was 70 keV,
which could significantly reduce the
beam-har-dening artifacts and image noise. Ohana et al, [13] reconstructed monochromatic images ev- ery 5 keV from 40 to 140 keV in lung window of spectral CT for analyzing the lung parenchyma. Their results demonstrated that the 50-55 keV
monochromatic reconstructions provided the best diagnostic and image quality. Yu et al, [14] used CT spectral imaging to differentiate hepatocellular carcinoma from focal nodular hyperplasia. Their results demonstrated that CT spectral imaging might be helpful in enhanc-ing accuracy of differentiatenhanc-ing hepatocellular carcinoma from focal nodular hyperplasia and detectability of lesions, and the low monochro-matic energy levels (40-70 keV) provided higher CNRs compared to the high energy levels (80-140 keV). Lv et al, [8] used spectral CT to derive monochromatic images at energy levels from 40 to 140 keV and conventional 140-kVp poly-chromatic images in patients with small HCC
(≤3 cm). Their results showed that the mono -chromatic energy levels of 40, 50 and 70 keV provided monochromatic images with the high-est CNRs. The monochromatic energy level of 70 keV provided the lowest image noise for monochromatic images, which had higher ima- ge quality compared to conventional polychro-matic images. They concluded that the mono-chromatic energy levels (40-70 keV) can en- hance detectability of small HCC, which might not cause the degradation of image quality. Several reconstruction techniques are intro-duced in order to improve the image quality of
CT examination. Filtered back projection (FBP)
technique is traditionally a principal method,
but it is unable to reduce radiation dose signifi -cantly [15-17]. Iterative reconstruction can not
Figure 7. CT values and image noise of RCA of a male
49 years old and BMI of 25.2 Kg/m2 using
[image:5.612.89.290.72.270.2]Gemstone spectral imaging of coronary artery
only minimize image noise but also reduce
radi-ation dose remarkably [18]. ASIR is the
first-generation iterative reconstruction technique
and uses information derived from the FBP
algorithm as an initial building block for image
reconstruction [19]. ASIR is better than FBP in
reducing noise and artifact due to incapability
of FBP in taking into account system noise and
certain system hardware details including de- tector sizes, location and actual focal spot [20, 21]. ASIR has been widely applied in spectral CT and acknowledged the potential in reducing image noise [22-25]. Especially for images at low monochromatic energy levels, ASIR can re- duce their image noise [26]. In this study, 40% ASIR was employed to reconstruct monoch- romatic images and achieved good effects (Figures 1-8).
The influence of background, gender and body mass index (BMI) on the optimal monochromat -ic energy level for GSI of coronary artery based on ASIR has not been reported yet. In our study, the optimal monochromatic energy levels for
LAD, LCX and RCA using muscle as background
were not statistically different between male and female (66.43±0.93 vs 66.41±0.79 for
LAD, 66.44±0.94 vs 66.46±0.84 for LCX, and
66.55±1.00 vs 66.54±0.84 for RCA); the
opti-mal monochromatic energy levels for LAD, LCX
and RCA using muscle as background were not statistically different between normal and over-weight group (66.69±0.67 vs 66.48±1.00 for
LAD, 66.73±0.78 vs 66.50±1.00 for LCX, and
66.85±0.62 vs 66.62±1.09 for RCA), but both of them were higher than obese group (vs
65.94±0.59 for LAD, vs 65.97±0.57 for LCX,
and vs 65.97±0.63 for RCA); the optimal
mono-chromatic energy levels for LAD, LCX and RCA showed the same trend of fat > muscle >
myocardium (69.71±0.87 vs 66.68±0.70 vs 64.74±0.63 for LAD, 69.80±0.62 vs 66.67±
0.65 vs 64.90±0.71 for LCX, and 69.64±0.70
vs 66.64±0.78 vs 64.96±0.60 for RCA). Th-
erefore, gender had no influence on the optimal monochromatic energy levels for LAD, LCX and RCA of the coronary artery, but BMI and back
-ground had certain influence on the optimal monochromatic energy levels for LAD, LCX and RCA. In summary, BMI and background had certain influence on the optimal monochromat
-ic energy levels for LAD, LCX and RCA.
This study had three main limitations. The first was that we failed to collect patients with BMI≤
18.5 Kg/m2 due to the small sample. The
sec-ond was that the influence of age on the opti -mal monochromatic energy level was not inves-tigated for the same reason. The third was that we only used 40% ASIR in this study. In the next investigative step, we will conduct a larger
sam-ple size study and ascertain the influence of dif -ferent ASIR percentages on the optimal mono-chromatic energy level.
Disclosure of conflict of interest
None.
Address correspondence to: Juan Song, Depart-
ment of CT/MRI, The First Affiliated Hospital to
Shihezi University Medical College, 107 North 2 Ro- ad, Shihezi 832000, China. Tel: +86-993-2858573; E-mail: [email protected]
References
[1] Lv P, Lin XZ, Li J, Li W and Chen K. Differentia -tion of small hepatic hemangioma from small hepatocellular carcinoma: recently introduced spectral CT method. Radiology 2011; 259: 720-729.
[2] Zhang D, Li X and Liu B. Objective characteriza -tion of GE discovery CT750 HD scanner: gem-stone spectral imaging mode. Med Phys 2011; 38: 1178-1188.
[3] Lin XZ, Wu ZY, Tao R, Guo Y, Li JY, Zhang J
and Chen KM. Dual energy spectral CT imaging of insulinoma-value in preoperative diagnosis compared with conventional multi-detector CT. Eur J Radiol 2012; 81: 2487-2494.
[4] Zhao LQ, He W, Li JY, Chen JH, Wang KY and Tan L. Improving image quality in portal venog-raphy with spectral CT imaging. Eur J Radiol 2012; 81: 1677-1681.
[5] Jia Y, Zhang J, Fan J, Li C, Sun Y, Li D and Xiao X. Gemstone spectral imaging reduced arte -facts from metal coils or clips after treatment of cerebral aneurysms: a retrospective stu-
dy of 35 patients. Br J Radiol 2015; 88:
20150222.
[6] Hou WS, Wu HW, Yin Y, Cheng JJ, Zhang Q and
Xu JR. Differentiation of lung cancers from in
-flammatory masses with dual-energy spectral
CT imaging. Acad Radiol 2015; 22: 337-344. [7] Liu X, Ouyang D, Li H, Zhang R, Lv Y, Yang A and
Xie C. Papillary thyroid cancer: dual-energy
spectral CT quantitative parameters for preop-erative diagnosis of metastasis to the cervical lymph nodes. Radiology 2015; 275: 167-176. [8] Lv P, Zhang Y, Liu J, Ji L, Chen Y and Gao J.
Material decomposition images generated from spectral CT: deteclability of urinary calculi
and influencing factors. Acad Radiol 2014; 21:
[9] Hu D, Yu T, Duan X, Peng Y and Zhai R.
Determination of the optimal energy level in spectral CT imaging for displaying abdominal vessels in pediatric patients. Eur J Radiol 2014; 83: 589-594.
[10] Jia Y, Xiao X, Sun Q and Jiang H. Gemstone
spectral imaging in lung cancer: a preliminary
study. Medicine (Baltimore) 2018; 97: e11170.
[11] Yu T, Gao J, Liu ZM, Zhang QF, Liu Y, Jiang L and Peng Y. Contrast dose and radiation dose re-duction in abdominal enhanced computerized tomography scans with single-phase dual-en-ergy spectral computerized tomography mode for children with solid tumors. Chin Med J (Engl) 2017; 130: 823-831.
[12] Lin XZ, Miao F, Li JY, Dong HP, Shen Y and Chen KM. High-definition CT gemstone spectral im -aging of the brain: initial results of selecting optimal monochromatic image for beam-hard-ening artifacts and image noise reduction. J Comput Assist Tomogr 2011; 35: 294-297. [13] Ohana M, Labani A, Severac F, Jeung MY,
Gaertner S, Caspar T and Roy C. Single source dual energy CT: what is the optimal monochro-matic energy level for the analysis of the lung parenchyma? Eur J Radiol 2017; 88: 163-170. [14] Yu Y, Lin X, Chen K, Chai W, Hu S, Tang R,
Zhang J, Cao L and Yan F. Hepatocellular carci-noma and focal nodular hyperplasia of the liv-er: differentiation with CT spectral imaging. Eur Radiol 2013; 23: 1660-1668.
[15] Sagara Y, Hara AK, Pavlicek W, Silva AC, Paden RG and Wu Q. Abdominal CT: comparison of low-dose CT with adaptive statistical iterative
reconstruction and routine-dose CT with fil -tered back projection in 53 patients. AJR Am J Roentgenol 2010; 195: 713-719.
[16] Völgyes D, Pedersen M, Stray-Pedersen A, Wa- aler D and Martinsen AC. How different
itera-tive and filtered back projection kernels affect
computed tomography numbers and low con-trast detectability. J Comput Assist Tomogr 2017; 41: 75-81.
[17] Thomas AK, Southard R, Curran J and Augustyn R. Comparing fourth generation statistical
iter-ative reconstruction technique to standard fil -tered back projection in pediatric head com-puted tomography examinations. J Comput Assist Tomogr 2018; 42: 475-481.
[18] Park SH, Kim KD, Moon YT, Myung SC, Kim TH, Chang IH and Kwon JK. Pilot study of low-dose nonenhanced computed tomography with iter-ative reconstruction for diagnosis of urinary stones. Korean J Urol 2014; 55: 581-586.
[19] Li X, Shu H, Zhang Y, Li X, Song J, Du J, Qian Y, Liu B and Yu Y. Low-dose CT with adaptive sta -tistical iterative reconstruction for evaluation of urinary stone. Oncotarget 2018; 9: 20103-20111.
[20] Kambadakone AR, Chaudhary NA, Desai GS, Nguyen DD, Kulkarni NM and Sahani DV. Low-dose MDCT and CT enterography of patients with Crohn disease: feasibility of adaptive sta-tistical iterative reconstruction. AJR Am J Roentgenol 2011; 196: W743-752.
[21] Hara AK, Paden RG, Silva AC, Kujak JL, Lawder HJ and Pavlicek W. Iterative reconstruction technique for reducing body radiation dose at CT: feasibility study. AJR Am J Roentgenol 2009; 193: 764-771.
[22] Chen JH, Jin EH, He W and Zhao LQ. Combining automatic tube current modulation with adap-tive statistical iteraadap-tive reconstruction for low-dose chest CT screening. PLoS One 2014; 9: e92414.
[23] Prezzi D, Goh V, Virdi S, Mallett S, Grierson C,
Breen DJ; PROSPeCT Investigators. Adaptive
statistical iterative reconstruction improves im-age quality without affecting perfusion CT quantitation in primary colorectal cancer. Eur J Radiol Open 2017; 4: 69-74.
[24] Rapalino O, Kamalian S, Kamalian S, Paya- bvash S, Souza LC, Zhang D, Mukta J, Sahani DV, Lev MH and Pomerantz SR. Cranial CT with adaptive statistical iterative reconstruction: improved image quality with concomitant radi-ation dose reduction. AJNR Am J Neuroradiol 2012; 33: 609-615.
[25] Kaul D, Grupp U, Kahn J, Ghadjar P, Wiener E,
Hamm B and Streitparth F. Reducing radiation
dose in the diagnosis of pulmonary embolism using adaptive statistical iterative reconstruc-tion and lower tube potential in computed to-mography. Eur Radiol 2014; 24: 2685-2691. [26] Yamada Y, Jinzaki M, Hosokawa T, Tanami Y,