Abstract— Wireless sensor network (WSN) is one of the
popular upcoming multidisciplinary technologies embracing the IT industry. With embedded sensing, computing, communications and controlling capabilities, WSN has a potential to solve complex and distributed measurement and control problems that are difficult, impractical or cost-prohibitive to solve with wired sensor networks. Over the past decade, research on WSN has matured to the extent that it is now feasible to deploy them to solve practical field problems in areas like environmental monitoring, precision agriculture and horticulture, transportation and traffic management, patient care and hospital management, disaster mitigation and management, and so on. As a support for accessing and analyzing application specific WSN data, GUSNI (graphical user sensor network interface) – a VI based tool, has been designed and developed, and is discussed in this paper along with results. With an effective, logically and esthetically designed front panel, this software seamlessly integrates with Crossbow WSN. It collects, analyzes, manipulates and displays sensor based data from individual nodes. It also provides additional functions of online data logging, historical trend viewing, statistical analysis, battery-state indication and network status monitoring. Its unique feature of providing connectivity to heterogeneous mixed node network (where nodes with different sensing modalities are deployed) enhances its applicability in situations where multiple parameters are monitored by different types of nodes. This well designed network coordinator and information display module is an effective API that provides wireless network communication abstraction to higher level application VI. Portable to any present day Window- based computing system, it is easy to understand and operate this tool. Being modular in design, its functionality can easily be expanded or modified in future to make it more versatile or application oriented.
Index Terms— Data monitoring and information display, Software tool, Virtual instrument, Wireless sensor network interface.
I. INTRODUCTION
The architecture or layout of WSN, as shown in fig. 1, consists of spatially distributed embedded devices, called sensor nodes, which form multi-hop mesh network and measure the parameters of interest within the application domain and communicate it to a sink node for access by the end user [1]. The sensor nodes, embedded with basic,
Roop Pahuja is with Department of Instrumentation and Control Engineering, Dr. Bhimarao Ambedkar National Institute of Technology, Jalandhar, Punjab (phone;09988651877, email: [email protected])
H.K. Verma is with Department of Electrical Ensgineering, Indian Institute of Technology Roorkee, Roorkee, Uttrakhand ([email protected])
Moin Uddin is with Dr. Bhimarao Ambedkar National Institute of Technology, Jalandhar, Punjab ([email protected]).
Fig 1 Typical Architecture Layout of WSN
functionalities of data sampling and acquisition, simple computations and wireless multi-hop mesh communication form a reliable, self configurable and self healing network. This network not only measures the phenomenon of interest with desired level of accuracy and data integrity, but also provides better spatial and temporal resolutions to meet stringent requirements of complex and distributed measurement and control applications. Over the past few years, with the availability of standard hardware and software WSN platforms, many applications based upon data collection and monitoring, event based detection, tracking and object classification techniques have sprung up [2]. They cover a broad spectrum of areas such as environmental monitoring [3], precision agriculture and horticulture [4], transportation and traffic management, patient care and hospital management, disaster mitigation and management, asset management, defense services etc [5]-[6].
To use a WSN to solve a practical problem is a complex task. Fig. 2 shows the framework for developing WSN applications, where all the modules, starting from infrastructure selection and deployment, node programming, design of network coordinator and going to the design of information display system with GUI, are carefully studied and implemented. For a purposeful and successful performance of the network, application-specific domain knowledge is essential to decide on various issues related to network selection and deployment, network programming and processing, decision making / controlling and information presentation [2]. Generally WSN has dual configuration setup of a distributed as well as a centralized measurement system Nodes scattered within the application domain perform distributed sensing and control functions while the server connected to the sink node performs centralized network
Design and Implementation of VI Tool for WSN
Applications
Fig. 2 Framework for Developing WSN Application
coordination and control. However, its main aim is to collect, decipher, analyze and process raw data packets from the network and provide useful information to the end user. It may perform network management and configuration, data storage and query processing and / or execute typical application functions for controlling, tracking and decision making. It may also coordinate with a remote data management centre executing dedicated operations and provide data connectivity to multiple remote users on PC terminals, cellular phones or PDA devices. A user-network interface allows the user to access network information and control its operation [2]-[7].
The proprietary WSN software available provide an environment to test and view network data along with other features of node programming, network configuration, and data storage [8]-[9]. But in order to incorporate, custom defined functionality to analyze and manipulate network data, the program needs to be integrated with some higher level application program, which at times may not be possible or easy. Alternative approach to this is to develop an integrated high level program with GUI that would meet application specific needs and network coordinator functionality on the same platform. A tool named GUSNI (Graphical User Sensor Network Interface) has been developed with this objective in mind and is presented here.
GUSNI software is programmed on the platform of LabVIEW, a standard and versatile graphical system development environment for real time measurement and control applications [10]-[11]. Literature survey shows a good use of LabVIEW for deploying WSN applications [12], [13], [14] ,[15], but the tool discussed here is a general purpose type with many more features. This software running on the server connected to the sink node provides seamless integration with Crossbow MTS-MDA mixed node wireless network with different sensing modalities. With effective, logically and esthetically designed front panel, it not only collects, analyzes, manipulates and displays sensor based data from individual nodes accurately with minimum time-lag, but provides additional features of online logging, historical trend viewing, statistical analysis of parametric information, battery state indication and network-status monitoring.
The following sections present design features and software
implementation of the tool along with the tests conducted and results obtained. The last section puts forth conclusions and future scope of the work.
II DESIGN
In WSN of Crossbow nodes, each node consists of a mote (processor and radio) and sensor board. Such nodes, distributed over the application domain, communicate with a sink node interfaced to a gateway board that provides data connectivity to a server through USB or Ethernet port. When the nodes are programmed with the underlying TOS (Tiny Operating System) application, they transmit TOS message packet with header and sensor board application payload information, using 2.4 GHz Zigbee, multi-hop mesh network protocol. A suitable program running on the server collects and displays network data information to the user [8].
This section discusses the design of GUSNI that runs on the server, with functionality of network coordinator and information display system. It is an integrated, multilayered program with modular design, concurrent operations, easy expandability and effective GUI for user interaction and data visualization [10]. It has five main functional modules, each with unique features, as discussed below.
1.Data Acquisition: It is an important and elementary module that establishes a link with the network and performs following functions:
Network selection: Provides connectivity to different network setups (mixed node or single node type with the choice to select sensor board hardware from number of available options irrespective of mote platform).
Live data display: Collects raw TOS message packets from nodes, retrieves node IDs and related sensor information for display with time and date stamp.
Data logging: Logs simultaneously sensor information from corresponding node IDs in the respective files, created dynamically.
2. Status Monitor: This module keeps an eye on the working conditions of the network and has following features:
number of nodes deployed with node IDs, which is readily available for a deterministic setup.
It provides the network status information in case there is some node detection or connection problem. It gives information on the number of nodes not detected along with node IDs. Network view is also shown graphically. Because of unpredictable radio frequency environment, out of range problem, physical damage or loose connections of the node, low battery condition or collision problem, some data packets may be dropped and thereby some node(s) may not be detected. If such a condition persists for a long time, an alert message is issued. User in that case can physically survey the network if possible.
It provides battery state information. With the limited power source, nodes require battery voltage of 2.7V to keep them alive. Battery state monitor measures the node voltage, compares it with the threshold (2.7V) and indicates low battery condition as an alarm.
3. Historical View: This module provides access to the stored data to view historical trends along with live data. It has following options in this regard:
It shows graphical picture of the node parameter(s) selected, i.e. variation in the magnitude of the sampled values over time span. It also displays histogram of data.
For selected node, it provides data packet information as collected over a time, with date and time stamp.
It has an important facility to show variation in the selected parameter value as measured by the nodes of the network for spatial and temporal analysis of data.
4. Location Finder: This module detects GPS enabled nodes to display their latitude and longitude coordinates and their location on earth map.
5. Application Specific Analysis: This module is custom designed and can be modified anytime. It manipulates live data information from respective nodes to meet application specific needs. It may involve decision making based upon statistical analysis, data aggregation or fusion techniques, may collect experimental data for model identification, may execute control algorithm or a rule based model to automate a system, provide data connectivity option to the remote user for access to network information or interaction with the process or any other special functions. Presently it provides statistical analysis of data in terms of minimum, maximum and average values, standard deviation and variance as measured by node(s) over chosen time span.
IIIIMPLEMENTATION
GUSNI is implemented on the graphical Virtual Instrumentation (VI) development platform, LabVIEW. The LabVIEW program is based on data-flow and block diagram programming techniques. It is an industry standard for developing custom defined measurement and control applications. It provides an environment to interface real time data to PC, where all data processing functions and features are programmed with intuitive design of front panel on PC
screen [10]. This front panel, with soft controls and indicators, mimics the panel of any hardwired instrument. Moreover its inherent advantages of modular, faster and portable code implementation, extensive library functions for data acquisition, analysis, signal processing and manipulation, tight integration with third party hardware products using instrument drivers, data connectivity with other applications, variety of control and indicators for front panel design and the networking features etc make it the right single platform [11] to develop all features of GUSNI tool.
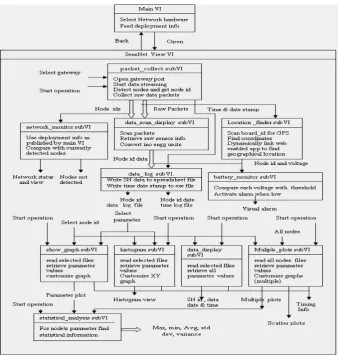
Fig.3 shows the functional flow chart of the GUSNI program developed by the authors. It has a modular and hierarchical design with VI (referred to as main program) and subVIs (referred to as subroutines). The main VI (named WSN Configuration VI) provides the user an option to select node hardware and to feed deployment information in terms of number of nodes deployed with node IDs. Accordingly, this VI opens another VI (named SensNet View VI), that performs the functions of network coordinator and information display system. It has a logically and aesthetically designed front panel to access network information. Its program code has various functional modules implemented using subVIs that are logically wired together and discussed below:
For live data display, data acquisition module uses two subVIs, named packet_collect subVI and data_scan_display subVI. The packet_collect subVI is linked with front panel control to select gateway port and push button control to start network operation. It is programmed using Crossbow WSN driver functions to open gateway port, start data streaming, detect nodes with node IDs and collect raw TOS message packets from nodes with date and time stamp. As soon as the nodes are detected, the nodes IDs are displayed. Raw data packet information is wired to data_scan_display subVI, that scans packet for sensor board ID (defines underlying packet structure) to retrieve raw sensor readings and convert them into engineering units using sensor I/O equations. Each packet information, that includes node ID, board ID, voltage value, sensor data and date and time stamp, is displayed on table indicator. Data logging is also performed simultaneously by another subVI named data_ log subVI. Corresponding to each node ID, two files are created to write and append sensor data and date / time readings, respectively.
For network status and battery state indication, status monitor module uses subVIs named network_monitor subVI and battery_monitor subVI. The former uses network deployment information as published by main VI to display visual indication of network status. If all the nodes deployed are detected, then network status is ‘OK’ otherwise ‘Detection problem’ error message is shown. If none of the nodes deployed is detected, then ‘Connection problem’ error message is shown. Simultaneously it also indicates the number of nodes not detected along with node IDs and graphical view of the network. If deployment information is not available (in case of non-deterministic setups) then only network view is shown with detected nodes. The.
Fig. 3 Functional flowchart representation of GUSNI program.
battery_monitor subVI uses node ID and corresponding voltage value output from the data_scan_display subVI. It compares each voltage value with threshold value of 2.7V to activate a low battery alarm indicator corresponding to the node ID.
Historical trends of network data are viewed in different modes (one activated at a time). Each mode has a front panel push button control to select and execute its subVI and show its results. Corresponding to the node ID and parameter selected, the subVI named show_graph reads its data file to retrieve all samples of parameter and display them on graph indicator showing variation with time. It also shows timing information as read from time log file. The subVI named histogram subVI shows histogram view of a selected parameter of a node on a XY graph. The subVI named data_display subVI reads data and time log file of the selected node to display packet information in numeric format (engineering units) as collected over time. The subVI named multiple_plot subVI reads the data and time log file of all current nodes to retrieve selected parameter value from each and show its variation graphically on the same graph where each plot is labeled programmatically. The subVI named scatter-plot subVI plots the sampled value of parameter against node IDs, thus depicting its spatial and
temporal view.
Location finder module consists of subVI named location _finder subVI, that detects GPS enabled nodes, scans packet information to display coordinates (latitude and longitude) and dynamically links to a web enabled application to find geographical location on the earth map.
Application specific analysis module consists of subVI named statistical_analysis subVI that reads the data file of the node to calculate and display maximum, minimum and average values, standard deviation and variance of the selected parameter.
IV TESTS AND RESULTS
Fig 4 Physical deployment of WSN in a home
forms network coordinating and information display centre. When the nodes are powered on, they transmit their data packets to gateway node. GUSNI program running on the PC provides network connectivity to the user.
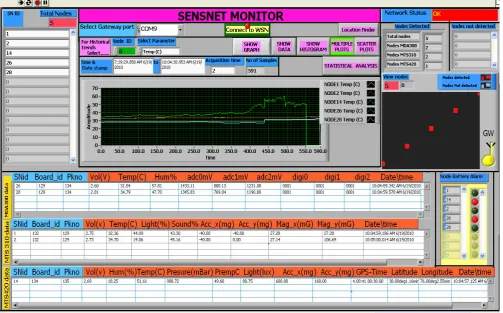
[image:5.595.319.534.82.226.2]To access this network, GUSNI is opened and main VI, named WSN Configuration VI, is used to configure the network (fig.5). Network hardware is selected and node, information is fed to open front panel of SensNet View VI. It is an integrated panel with all the desired features as highlighted above. Figure 6 shows the front panel of SensNet View VI in running mode, that interfaces with the deployed network and displays the results. ‘Connect to network’ button
Fig 5 Front panel of WSN Configuration VI showing network deployment information
is clicked to view live data. It indicates node IDs, sensor information network status and battery status. All the five different types of the nodes deployed are detected, with display of node IDs and related sensor information in respective tables. Network status shown is ‘OK’. Low battery alarm is activated for nodes 14 and 26 as their voltage value is less than 2.7V. Packet information of each node is logged in the respective file. To view the historical trend, ‘Multiple plot’ button is clicked, that shows variations in selected parameter ,
Fig. 6 Front Panel of SensNet View VI showing live network data display with node ids, network and battery status. Also indicating temperature trend as measured by the nodes over time.
[image:5.595.47.551.389.702.2]temperature (in C ) value graphically as measured by the nodes over time with date and timing information thus representing a collaborative view of temperature variation in networked region. In continuous running mode of the program, data is updated at the sampling rate of each node with display time delay of 10s. The information so obtained and displayed is valid and accurate [8]-[9]. All the test conditions are successfully executed and depicted
V CONCLUSIONS AND FUTURE SCOPE
This VI tool reported here is a kind of network coordinator and information display system that provides an integrated environment for developing WSN standalone applications with custom defined functionality. It not only collects and monitors sensor-based network parameters, but also provides additional features such as network status monitoring to indicate node detection and connection problem, if any, battery voltage monitor with low alarm indication, creating and loading node packet information in files dynamically, has various options to view historical trends, find geographical location and provide statistical analysis of data. It also extends support to include application specific high level decision making and control functions. It performs measurement and information processing tasks with high level of accuracy, authenticity and data integrity with time lag of 10 s. This software module is an effective API that provides RF wireless network communication abstraction to higher level application VI. With its intuitive and well designed user interface, it is easy to understand and use this tool .
It provides seamless connectivity to Crossbow WSN with different node-hardware irrespective of mote platform (Micaz/ Iris motes, MTS310/ MTS320/ MTS400/ MTS420 sensor board). Its unique feature of collecting raw TOS message packet from heterogeneous mixed node network (MST - MDA XWSN) makes it an ideal choice for the monitoring and control applications involving multiple parameters with slow data rates. This software with its small memory footprints (5MB) is successfully ported to any present day Window-based computing system connected to WSN. Being modular in design, the code can be easily reused or modified to suit custom needs thus optimizing system development time.
Software up-gradation is a continuous process. There is lot of scope to improve GUSNI tool, in respect of its features and functionality. Support can be included to connect it to other Crossbow WSN products and also with different vendors’ WSN hardware with USB or Ethernet connectivity. Some of the other functions and features that can be added are configuring network parameters, location based node addressing, data base and query processing and connectivity options for different remote users with dedicated client software. The authors are working towards making it more generic and versatile to suit different user communities.
REFERENCES
[1] D.J.Cook and S.K.Das, “Smart Environment: Technology, Protocols and Applications”, John Wiley, 2004.
[2] K. Sohraby, D.Minoli and T. Znati, “Wireless Sensor Networks-Technology, Protocols and Applications”, Wiley Interscience, 2007. [3] O.Green, E.S. Nadimi, “Monitoring and modeling temperature variation
inside silage stacks using novel wireless sensor networks.”, Computers and Electronics in Agriculture 69, 2009, pp. 149-157.
[4] J. Burel, T. Brooke, and R. Beckwith, “Vineyard computing: Sensor networks in agricultural production”, IEEE Pervasive Computing, vol. 3. no.1, 2004, pp. 38-45.
[5] D. Culler, and H. Mulder, “Smart Sensors to Networks the World” ,
Scientific American, June 2004.
[6] J. A. Sankovic, “When Sensors and Actuator Networks Cover the world”,
ETRI Journal, vol l30, no. 5, Oct 2008., pp 627- 633.
[7] S. Hadim, N.Mohamed, “Middleware: Middleware Challenges and Approaches for Wireless Sensor Networks”, IEEE Distributed Systems Online 1541-4922 , vol.7, no. 3, March 2006
[8] Crossbow Technology, “MoteWorks Getting Started Guide”, 2007. [9] Crossbow Technology, “MoteVIEW Users Manual”, 2007
[10] S. Sumathi, P. Surekha “LabVIEW based Advanced Instrumentation Systems”, Springer
[11] National Instruments Corporation, Instrumentation Newsletter Volume 18, Number 1 First Quarter 2006.
[12] A.N. Das, F L. Lewis, D. O. Popa, "Data-Logging and Supervisory Control in Wireless Sensor Networks,", Seventh ACIS International
Conference on Software Engineering, Artificial Intelligence,
Networking, and Parallel/Distributed Computing , 2006, pp.330-338,
[13] P. Ballal, V. Giordano, P. Dang, S. Gorthi, F. Lewis, "A LabView based test-bed with off-the-shelf components for research in mobile sensor networks," Proc. ISIC, Munich, Germany, October 2006.
[14] Wei Fu, Y. S Chang, M. M Aung, C. Makatsoris, C Heun Oh, “WSN Based Intelligent Cold Chain Management”, The 6th International
Conference on Manufacturing Research UK, September 2008
[15] G.Fang Li, S. T Liu,Li D. Chen,
“
Design on Environment Monitoring System for Greenhouse Based on Wireless Sensor Network” , AdvanceMaterials Research , vols 108-111, May 2010, pp 145-150.
.