Study on Composting of Pressmud using
Stabilized Spentwash along with Suitable
Admixture
Veeresh G.S, Amar Byakodi2,
1
Department of Civil Engineering, Angadi Institute of Technology and Management, Belagavi.
2Assistant Professor, Department of Civil Engineering, Angadi Institute of Technology and Management, Belagavi
Abstract: The present study on composting using stabilized spent wash and sugar press mud with microbial consortium by aerobic composting system was conducted at Angadi institute of technology and management Belagavi. The compost prepared by 4 batches and from Press mud and stabilized spent wash using microbial culture within 50 days ranged C: N ratio from 12.06 to 16.69:1 and 16.69:1 to 20.20:1, respectively. This shows effectiveness of microbial decomposing culture on production of good quality compost in a short period of time. This method gave the higher nutritive manorial values after completion of process of composting. The compost obtained by aerobic composting method in all 4 batches contained 1.15-1.72 % Total Kjeldhal nitrogen, 0.9-3.54 % P2O5, 2.25-2.97 % K2O, and had pH range from 6.9-7.02.
Keywords: Press mud, Biomethanated spent wash, microbial consortium, nutrient mixtures.
I. INTRODUCTION
India is the biggest customer of sugar on the planet and the second biggest maker next just to Brazil. The Indian sugar industry has around 571 sugar plants with an introduced limit of roughly 19 million tons. The sugar business is a noteworthy provider of profitable results and waste materials like molasses, bagasse and press mud. [1] Karnataka Sugar industry positions third as far as its commitment of sugar in the aggregate sugar generation in the nation. The Sugar business in Karnataka can produce sugar in such colossal amounts because of the way that sugarcane is richly accessible in the state. Truth be told, Karnataka stands fourth in the nation in the development of sugar stick. For every 100 tonne of sugar cane crushed on an average gives 10 tonne of sugar, 4.5 tonne of molasses, 33 tonne of bagasse and 2.5 tonne of Press mud. One tonne of molasses can produce around 225 litter of alcohol. [1] The study area belgaum, which is likewise well known for its sugar cane generation, there are around 35 sugar ventures are running, delivers roughly huge amounts of sugar which makes Karnataka the third biggest state in nation for the creation of sugar cane.
A. Press mud
Sugar press mud is also known as press mud cake or filter cake. Press mud is a spongy, amorphous and dark brown material. During the manufacture process of sugar cane, cane juice contains more number of impurities which are in the form of precipitates. And these impurities are separated by filtration process. This will produce a cake like form is known as Press mud. Generally press mud is used as manure in India. It generally contains 60-85% moisture the chemical composition depends on cane variety, soil condition, nutrients applied in the field, process of clarification adopted and other environmental factors. Press mud from sugar factory typically contains 71% moisture, 9% ash and 20% volatile solids, with 74-75% organic matter on solids.
B. Spent wash
The distilleries use molasses as a raw material for production of alcohol. Molasses is pumped to Fermenter, diluted with water,
inoculated with yeast culture and necessary nutrients are added. The fermentation period is about 24 to 30 hours and about 7.5 – 9.5 % alcohol be formed in the fermented wash. Then yeast is added in diluted molasses solution and fermentation process takes place. As process goes up glucose is converted in to ethyl alcohol and carbon dioxide. This carbon dioxide will remove as a gaseous form, which is collected separately. After sufficient conversion of glucose in to ethyl alcohol this solution is called beer solution. This beer solution is then passed through distillation column Based on temperature difference ethyl alcohol separated from beer
solution and condensed into liquid form. The wastewater from distillery column called spent wash. Spent wash is dark brown,
II. MATERIAL AND METHODOLOGY
The present study was conducted at Angadi institute of technology and management, Belagavi. Raw materials such as Biomethanated spent wash were brought from ugar sugar industry, which is located 118 km from AITM Belagavi .and the sample
were stored in refrigerator at 40 C. And the press mud is collected from doodhaganga Krishna sahakari sakkare niyamit, chikkodi
which is located 86 km from AITM Belagavi. Composted cow dung is collected from nearby Belagavi city. Microorganisms were brought from agriculture university, Dharawad. The collected samples were stored in a cool place along with precautions for preventing insect nuisance.
Fig: 1 shows the collected 600gm of composted cow dung Fig: 2 show the raw press mud collection
C. Microorganisms and Nutrient Mixtures
The nutrient mixtures is an accelerator for increasing rate of decomposition and the microorganisms used in composting process are mainly Trichoderma, Aspergillus Niger, Pleurotus, and Phaenerochaete.
D. Biomethanated Distillery spent wash
Distillery spent wash treated in a conventional anaerobic digester from a distillery near ugar sugar industry Belagavi. The
Biomethanated distillery spent wash stored at 4-5oC was allowed to attain room temperature before experiments. The
Biomethanated distillery spent was then used as such for pre-treatment using electro coagulation.
E. Electro-coagulation Reactor
Electro-coagulation is one of the techniques utilized for the treatment of highly concentrated wastewater. For the present study, Electro coagulation was done in a plastic plate of size 36 x 26 x 6.50 cm. two aluminium electrodes were utilized of size 22 x 11 cm which was kept at a reasonable separating of 14 cm and thickness of electrodes was 1mm. these electrodes were connected to a DC
supply and voltage was kept at 15 volts along with current of 17.6 mA/cm2. The working volume of Biomethanated spent wash for
the study was 1000 ml.
Preliminary analysis was carried out to determine the treatment of Biomethanated spent wash utilizing electrical conductivity. Working volume of Biomethanated spent wash was added to the plastic plate and electrodes were connected to the DC supply as appeared in the figure. Analysis of EC was completed at 30 minutes for duration of 270 minutes.
F. Methodology
The present study was conducted in Angadi Institute of management and technology campus. 7 plastic containers were made with same proportion of press mud, and different ratios of stabilized spent wash stabilized, microorganism’s culture, cow dung and water. plastic container of size of top diameter of 0.4225m and bottom diameter of 0.1875m at a depth of 0.2375m and the total Volume of
container is 0.02m3 (20lit).
Fig: 4 image of electro coagulation reactor
Experiment was performed by taking 1000ml of distillery spent wash in a plastic tray, 2 aluminium electrodes were utilized as a part
of this test. The direct was applied was 15 volts with a current density 17.6mA/cm2. Power supply is applied started at t=0 and at a
regular interval of 30 minutes sample was collected. The proficiency of electro coagulation was controlled by checking the electrical conductivity for like clockwork from conductivity meter. The decreases electrical conductivity was checked with help of graph.
G.Composting Process
For a better composting, proportions of admixtures are very important. While using microorganisms as an admixture, it is important that the microorganisms are given sufficient time to accumulate to acquire a good quality of compost. In present work, microorganisms were used with spent wash to study the accumulation rate between stabilized spent wash, press mud and microorganisms.
The entire study can be divided into two stages, they are discussed as below. 1st stage: Culture is added in press mud.
2nd stage: Stabilized spent wash is added in press mud
Stage 1: According to literature, addition of microorganisms before spent wash gives microorganism’s better accumulation time with press mud, and also add cow dung the microbial activity and its growth. To enhance the activity, 50 gms of microorganisms and 213 ml of nutrient mixtures were added in 5kg of press mud with 0.6 kg of cow dung, diluting it with 500 ml of water. The entire contents were added in a plastic container of size of top diameter of 0.4225m and bottom diameter of 0.1875m at a depth of
0.2375m and the total Volume of container is 0.02m3 (20lit).
Stage 2: According to literature, after 15 days of acclimatization of micro organisms stabilized spent wash was added to all 4 plastic containers with proportion of 25%, 27.5%, and 30% respectively for every 4 days to maintain proper moisture content is 60% to 80%, except one reference plastic container.
Table-1 Percentage of stabilized spent wash added in press mud
Batches Press mud/culture composition
(PM+ Microorganisms+ nutrient mixture+ Cow dung+
Water)
Percentage addition of stabilized spent wash
volume frequency
of application
4 No’s
B1 5kg+50gm+213ml+600gm+500ml Blank 5 lit 1.25ml
B2 5kg+50gm+213ml+600gm+500ml 25% 1.25lit 312.5ml
B3 5kg+50gm+213ml+600gm+500ml 27.5% 1.375lit 343.75
ml
During these four days there will be rapid growth of bacteria and fungi takes place which can withstand with temperature 100C to
500C. This will be the Mesophilic phase From 4th day to 15th day at temperature less than 320-350C, the breaking down of proteins,
fats, and cellulose takes place during this the mixed population of bacteria’s and fungi which can tolerate the heat. After spraying
stabilized spent wash temperature should be 380-450C.
15th to 50th day, long and slow degradation of lignin and other highly resistant compounds and formation of manure, during this the
temperature will be at their Mesophilic phase i.e. from 100C to 450C, this will be the maturation phase, where other bacteria’s and
fungi predominates the pile and convert the manure into a good manure and the end product.
III.RESULT AND DISCUSION
The physical-chemical characteristics of the press mud were assessed. and the biological properties of the press mud were also studies to determine the characteristics of press mud. The details are given in table.
Table-2 Physico-Chemical characteristics Raw Press mud
Sr .No Parameter Composition Unit
1 pH 6.25
2 Electrical
conductivity
6.554 mS/cm
3 Moisture Content 72.50 %
4 Total Organic Carbon 12.53 %
5 Total Kjeldhal
Nitrogen
0.48 %
6 Total Phosphorus 0.40 %
7 Total Potassium 1.09 %
8 C/N ratio 25.95 %
9 Iron 0.15 Mg/kg
10 Aerobic microbes 52X106 CFU/g
The pH of the raw press mud was 6.25 and the electrical conductivity was 6.554 mS/cm, which shows the acidic status of raw press mud. And moisture content is 72.50. The organic carbon content was 12.53 per cent. The C:N ratio was 25.95: 1 the data on total micronutrient contents revealed that press mud was fairly rich in micronutrients and it contained iron content 0.15mg/kg , The total
microbial population in raw press mud was also estimated. The estimated population of total aerobic microbes is 52x106CFU/g.
A. Electro Coagulation
For the present examination, electro-coagulation was completed in a plastic plate of size 36x26x6.50 cm. two aluminium electrodes were utilized of size 22x11 cm which was kept at a clear spacing of 14 cms and thickness of electrodes was 1 mm. these electrodes
were associated with a DC supply, and voltage was kept up at 15 volts alongside current of 17.6 mA/cm2. The working volume of
Biomethanated spent wash for the examination was 1000 litters. Preliminary analysis was carried out to determine the treatment of Biomethanated spent wash using electrical conductivity. Analysis of EC was completed at each 30 mins for length of 270 minutes and the outcomes are tabulated below.
Electric Conductivity is subject to the broke down solids introduce in the spent wash; the precipitation of disintegrated solids happens and get affected when the current of 15 volts and 17.6 mA/cm2 is gone through BMSW which decreases the measure of broke up solids in spent wash.
Table: 3 preliminary analysis of electro coagulation
Sl. No Time
(minutes)
Electrical conductivity
(mS/cm)
1 0 55
2 30 53
3 60 52
4 90 50
5 120 50
6 150 48
7 180 48
8 210 45
9 240 45
10 270 45
Fig: Effect of contact time on the reduction of electrical conductivity
Table-4 Physico-Chemical Characteristics of Compost Samples after 15 Days
Sr. NO PARAMETER UNIT B1 B2 B3 B4
1 pH 7.33 7.17 7.64 7.12
2 Electrical conductivity mS/Cm 3.47 2.80 2.47 2.03
3 Moisture Content % 78.34 71.82 78.13 77.34
4 Total Organic Carbon % 22.03 21.89 17.60 20.24
5 Total Kjeldhal Nitrogen % 1.20 1.43 1.95 1.11
6 Total Phosphorus (as P2O5) % 3.79 3.22 3.07 3.59
7 Total Potassium (as K2O) % 2.47 2.64 1.85 2.23
8 C/N ratio % 18.36 15.20 9.02 18.24
9 Iron mg/kg 74.27 84.08 75.49 81.79
Comparing raw press mud with cultured press mud it was observed that the moisture content was increase to 72% from 79 %. The pH was increased to 6.25-7.81 which makes the compost neutral. Thermophilic microorganisms can cope up with acidic atmosphere but not less than 6. The organic carbon was increased from 12.53% of raw press mud to 22% of cultural press mud due to addition of nutrient mixtures. The organic carbon gradually decreases as process continuous. The carbon to nitrogen ratio decreases to 25.95 from 18 %, which is good sign of good compost. And the nutrient like potassium and phosphorous nearing to standard which shows the microorganism has good effect on press mud and cow dung also plays its role of enhancing the nutrients.
After 15 days, the stabilized spent wash was added, and the mixture is left out till day 4, and the analyses were done 50 day of mixture.
Table: 5 Parameters of different batches on 50th days
Sr. No Parameter Unit B1 B2 B3 B4
1 pH 7.02 7.28 6.93 7.26
2 Electrical conductivity mS/Cm 3.56 3.84 3.29 4.08
3 Moisture Content % 74.46 73.31 71.59 72.12
4 Total Organic Carbon % 18.79 21.64 19.68 24.08
5 Total Kjeldhal Nitrogen % 1.15 1.67 1.63 1.19
6 Total Phosphorus (as P2O5) % 4.21 3.50 3.59 4.01
7 Total Potassium (as K2O) % 2.94 4.27 2.58 2.79
8 C/N ratio % 16.69 12.93 12.06 20.20
9 Iron mg/kg 77.35 82.55 75.25 78.65
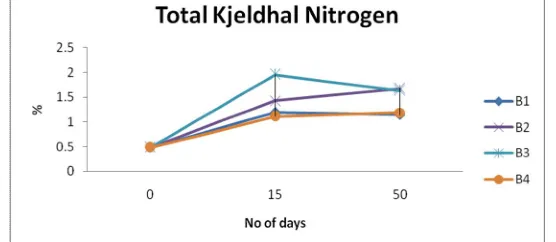
increment in every one of the 4 groups, B1 1.20, B2 1.43, B3 1.95, B4 1.11, because of more microbial movement in composting, and afterward spraying stabilized spent wash with various proportion in all batches aside from one B1, following 50 days composting esteems are increments to, B1 1.15, B2 1.67, B4 1.19 and reduction in B3 1.63, because of medium microbial action in composting. Total C:N ratio at initial stage is 25.95% after 15 days composting it decreases in all 4 batches, B1 18.36, B2 15.20, B3 9.20, B4 18.24, due to action of microorganisms from nutrient mixtures, and then application of stabilized spent wash with different ratio in all batches except one, after 50days also it reduces B1 16.69, B2 12.23, B3 12.06, B4 20.20, because of degradation of organic matter by microbial activity C/N ratio value is reduced at final compost.
Fig: Graph shows pH variations during composting
[image:7.612.173.451.598.719.2]The above diagram demonstrates the variety of pH during composting. Raw press mud has pH 6.25, following 15 days pH abatements to B1 7.33, B2 7.17, B3 7.64, B4 7.12, in each of the 4 batches. and after application of stabilized spent wash with various proportion in every one of the 4 batches aside from one reference B1, 50 days pH values fall into B1 7.02, B2 7.28, and expands B3 6.93, diminishes B4 7.28, end of the composting process time frame pH esteem are neutral range, it reasonable for high-impact aerobic composting.
Fig: Graph shows total organic carbon variations during composting
From above diagram Total Kjeldhal nitrogen at beginning stage is 0.48%, following 15 days composting it increment in every one of the 4 groups, B1 1.20, B2 1.43, B3 1.95, B4 1.11, because of more microbial movement in composting, and afterward spraying stabilized spent wash with various proportion in all batches aside from one B1, following 50 days composting esteems are increments to, B1 1.15, B2 1.67, B4 1.19 and reduction in B3 1.63, because of medium microbial action in composting.
Fig: Graph shows C:N ratio variations during composting
From above graph Total C:N ratio at initial stage is 25.95% after 15 days composting it decreases in all 4 batches, B1 18.36, B2 15.20, B3 9.20, B4 18.24, due to action of microorganisms from nutrient mixtures, and then application of stabilized spent wash with different ratio in all batches except one, after 50days also it reduces B1 16.69, B2 12.23, B3 12.06, B4 20.20, because of degradation of organic matter by microbial activity C/N ratio value is reduced at final compost.
IV.CONCLUSIONS
The present study was conducted at Angadi institute of technology and management Belagavi. Aerobic composting process is carried out by suitable admixtures, with different ratio of stabilized spent wash. The entire study can be divided into two stages, 1st stage: Culture is added in press mud. 2nd stage: stabilized spent wash is added in press mud with different ratios. At stage 1, the culture was added, the analysis were done and the composition such as pH, moisture content, total organic carbon, C/N ratio, 7.8, 79%, 22%, 18% due to turning the compost, moisture content was increased, and organic carbon increases, C/N ratio decreased. At stage 2, stabilized spent wash added in press mud with different ratio, after 50 days showed pH desired values in all 4 batches, and total organic carbon of B2, B3, such as, 21.04, 24.08, which was showed desired values. C/N ratio showed desired results in all batches, and phosphorous, potassium showed good results in, B5 batches.
Hence it was concluded that, major parameters such as pH, total Kjeldhal nitrogen, total organic carbon, C/N ratio, potassium and phosphorous of batch of B5 showed desired values thus compost material use to increase the nutrient value of soil.
REFERENCES
[1] Shivakumar M. Kamble, Gopal. V. Dasar and S. S. Gundlur, (2017), “Distillery Spent wash Production Treatment and Utilization in Agricultural- A Review”, International Journal of Pure and Applied Bioscience. Vol. 5, pp. 379-386
[2] Karan M. Agarwal, B.R. Barve and Shareena S.Khan, “Biogas from Pressmud”, IOSR Journal of Mechanical and Civil Engineering. pp. 37 – 41
[3] V. Rengraj and mazhee sultan, (2014), “standardization of the optimal ratio of distillery spent wash to the press mud windrows for effective and ecofriendly compost”, International journal of novel trends in pharmaceutical sciences, vol 4
[4] Bijaya ketan sarangi, sandeep narayan mulidar, Praveen bhatt, shewta kalve, Tapan chakrabarti, Ram awatar pandey, (2008), “compost from sugar mill press mud and distillery spent wash for sustainable agriculture”, global sciences book, vo
[5] K. rasappan, A. kumar and P. santosh,(2015), “studies on sugar cane press mud and distillery waste as a biofertilizer through composting”, International journal chemical sciences, vol(3)
[6] Shrikumar v, mahamuni and ashok s. patil, (2012), “microbial consortium treatment to distillery spent wash and press mud cake through pit and windrow system of composting”, journal of chemical, biological and physical sciences, vol. 2,
[7] Dr. Rakhi. Chaudhary and Ms. Mahima. Arora, (2011), “Study on Distillery Effluent: Chemical Analysis and Impact on Environment”, International Journal of Advanced Engineering Technology. Vol. 2, pp. 352-356
[8] Anil Kumar. Varma, (2010), “Removal of COD and Colour from: Distillery Waste water using Fenton Oxidation”, Department of Chemical Engineering Indian Institute of Technology Roorkee. pp. 1-77.