IJ. Exp. Biol. (1961), 38, 301-3H 3 0 1
With 9 text-figures Printed in Great Britain
ON THE REGULATION OF THE RESPIRATION IN REPTILES
I. THE EFFECT OF TEMPERATURE AND CO2 ON THE
RESPIRATION OF LIZARDS (LACERTA)
BY BODIL NIELSEN
The Laboratory of Zoopkysiology A, University of Copenhagen
{Received 7 October i960)
Ventilation of the lungs accomplished by movements of the ribs is, in the phylo-genetic development of the animals, first found in the reptilian class. It may therefore be of interest to investigate the regulation of respiration in this group. The reactions to carbon dioxide and to low oxygen tensions is specially interesting considering the importance of these substances for the respiratory regulation in higher animals and man.
The literature on reptilian respiration is not extensive and is mostly concerned with the respiratory movements in different species: Bert (1870), turtles, snakes, lizards, crocodiles; Langendorff (1891), Lacerta, Anguis; Siefert (1896), Lacerta; Kahn (1902),
Lacerta; Babak (1914a, b), Iguana, crocodile; v. Saalfeld (1934a, b), Uromastix;
Willem & Bertrand (1936), Lacerta; Vos (1936), turtles, snakes, lizards, crocodiles; and Boelaert (1941), various lacertilians, and (1942), crocodiles.
The chemical regulation of respiration in various species of reptiles has earlier been studied by Siefert (1896), Babak (1914a, b), v. Saalfeld (1934a), Vos (1936), Boelaert (1941) and Randall, Stullken & Hiestand (1944). A critical survey of the literature was presented by Vos (1936).
The more recent investigations confirm the finding that CO2 and lack of O2 have
a strong effect on the respiratory pattern of reptiles, but the various studies are often ambiguous and incomplete. Mostly, very high CO2 and very low O2 concentrations
have been used. The range of concentrations within which a natural regulatory effect of these gases take place is probably much smaller. Investigations of the effect of temperature on respiration are few, and the relation between O2 uptake and pulmonary
ventilation has never been studied.
In the present work, the relationships between temperature, O2 uptake, and
ventila-tion have been studied; further, the effect of different concentraventila-tions of CO2 in the
inspiratory air on respiration has been investigated by a method which gives simul-taneous determinations of pulmonary ventilation and oxygen uptake. Two species of lizard (Lacerta viridis and L. sicula) were used as experimental animals. Their re-actions to the respiratory stimuli applied were completely identical.
I. METHODS AND PROCEDURE
experiments. This is an advantage when the natural respiratory regulation is to be studied.
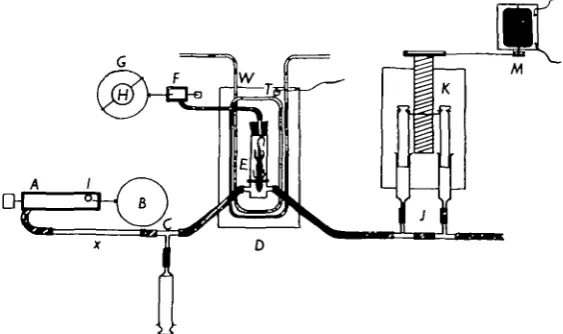
Apparatus. The experimental set-up is shown in Fig. i. A is a spirometer (volume
[image:2.451.81.363.178.345.2]£ 1. or I -2 1.) loaded with a weight /, so that air is forced out through the resistance x through the helmet of the animal container E and out past the glass syringes J. By changing the weight on the spirometer and the resistance (glass capillaries of different lengths and bores) the airflow through the system can be varied. On the drum B the air content in the spirometer A is registered and the volume of air forced through the system during the experiment can therefore be measured.
Fig. i. Apparatus. A, spirometer; B, drum; C, test-tube for air sampling; D, water bath;
E, animal container; F, small Krogh-type spirometer for registration of the respirations; G, revolving drum; H, clockwork; J, air-sampling syringes; K, sampling device; At, electric
motor; T, contact thermometer of the thermostat; W, cooling spiral. /, weight; x, glass capillary resistance.
C is a test-tube for taking samples of the influx air. D is a container filled with
water. The temperature within the container can be regulated by leading cold water through the coil W or by electrical heating. In the latter case, the thermostat T keeps the temperature constant ( ± T ^ J ° C ) . A small electric motor drives a stirrer and provides an even temperature distribution in the water.
E is the animal container and F is a small Krogh-type spirometer (volume 3-5 ml.
or 7 ml.) registering the respiratory movements on the drum G. G is turned at a constant speed (one turn per 30 min., or one per 15 min.) by a clockwork motor H.
The electric motor M drives the sampling device K which slowly pulls back the pistons in the syringes J, so that a small part of the air coming from the animal container (the exit air) is continually sampled.
The animal to be used was placed in a separate cage without food and water the day before the experiment. During the experiment, the animal was placed with a tight-fitting rubber diaphragm around its neck, in a container consisting of a body-chamber and a 'helmet'. The helmet and body-body-chamber, which were firmly screwed together, were thus separated from one another by the air-tight diaphragm.
On the regulation of the respiration in reptiles. I 303
as a ventilation curve on the revolving drum G. The animal container was placed in the water bath D, so that the experiment could be performed at constant temperature. At each experiment the spirometer A was filled with the desired air mixture. The flow was so regulated that the difference in COa percentage in the air reaching the
helmet (influx air) and leaving the helmet (exit air) was about o-6%.
When air mixtures different from room air were used, the particular air mixture was bubbled through the water in the spirometer for about 30 min., so that equilibrium between water and air in the spirometer could be established before the experiment. Each experiment lasted 15 min., but readings and sampling were not started until an initial period (15-60 min.) had elapsed, during which the body temperature became constant and the respiration regular.
Immediately before and after the actual experiment, samples of the influx air were taken. The body temperature of the animal could be measured by means of a thermo-couple, one junction of which, mounted in a small plastic tube, was inserted 1 cm. into the cloaca of the animal. Usually two experiments were made in succession without touching the animal, which often spent about 2 hr. in the apparatus.
Double analyses for COa and Oa content of the influx and exit air were made on
the Scholander 0-5 ml. analysing apparatus (Scholander, 1947). If the results of a pair differed more than 0-05 % on COa or Ot the experiment was discarded.
Computations. From the volume of the influx air at STPD and the NB percentages
of the infln-g and exit air, the volume of the exit air was calculated. Oxygen uptake, carbon dioxide elimination, and R.Q. could then be determined. On the respiration curve, the number of respirations during the experiment was counted and the depth of the respirations was measured. From these data, an average respiratory frequency and an average respiratory depth were estimated. The product of these gave the average pulmonary ventilation per minute during the experiment, (The values were con-verted to BTPS.)
Accuracy of the method. The accuracy of the results attained by the described method
depends on the accuracy of the readings of the volumes of air from spirometer A and on the reliability of the analyses. The latter is of special importance when, as here, the difference between influx air and exit air used for computing the metabolism is so small (o-6 %).
The error on the volume readings is only about 1 %, and the uncertainty of the values for the metabolism can be calculated to be about 10 %. The error on the ventila-tion is of the same order of magnitude, roughly estimated to be 10%, and depends mostly on the readings of the respiratory amplitude.
Even if the values of both metabolism and respiration obtained by this method are encumbered with the above-mentioned uncertainties, they give valuable information. The advantage of giving absolute values for respiratory frequency, depth, and ventila-tion under different circumstances must be considered great compared to the mere description given in earlier investigations.
II. VENTILATION AND METABOLISM AT DIFFERENT TEMPERATURES In ten different animals (3 Lacerta ticula and 7 L. viridis) the oxygen uptake and
3°4
The experimental conditions were, in all experiments, kept as near to resting conditions as possible. It was very seldom that the animals did not struggle to get free one or more times during the experiment. It must also be mentioned that an animal held (as in the present experiments) in a fixed position is probably not relaxed and has an increased muscle tone which may increase the oxygen uptake above the basal level. However, as these sources of error are present in all the experi-ments, it is still justifiable to compare them.
The oxygen uptake was varied by changing the body temperature of the animals. It usually took 40-60 min. to cool an animal down from room temperature to io° C , and about the same time to warm it up to 35° C. Experiments were performed at temperatures of io°, 200 (room temperature), 300 and 350 C. The relationship between O2 uptake and temperature is shown in Fig. 2.
15 20 25 30 Body temp ( ° C )
35
Fig. 2. Oxygen uptake in ml. per ioo g. per hour in relation to body temperature °C. (results from eight animals).
RESULTS
In Fig. 3 the pulmonary ventilation (BTPS) is plotted in relation to the oxygen uptake (STPD). An increase in oxygen uptake gives an increased pulmonary ventila-tion. The relation is not quite rectilinear.
-nl
n
)
|
c >
35
30
20
15
10
5
• • * * • .• • • • • . * * . . . * ' '
• • •
•
1 1 1 1 1 I 1 I 1 1 I 1 1 1 I I 1 1
•
• •
_
-1 -1 -1 -1 -1 -1 -1 -1 -1 -1 -1 -1 -1 35
30
25
20
15
10
5
10 15 20 O2 uptake (ml /hr.)
[image:5.451.69.384.29.202.2]25 30 35
Fig. 3. The relationship between pulmonary ventilation, ml./min. (BTPS) and oxygen uptake, ml./hr. (STPD). The oxygen uptake was varied by changing the body temperature of the animals (results from eight animals combined).
20
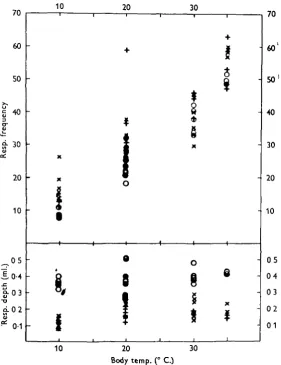
Body temp. (" C.) 30
[image:5.451.86.368.246.611.2]temperature and respiratory depth. The quotient, ventilation/hour -rO, uptake/hour (i.e. the ventilation per litre consumed oxygen), varies a great deal even for the same animal in repeated experiments. Mean values for all animals are shown in Table i, column 3. - 200% - 150% 100% 50% 10 20
Body temp. (°C.)
Fig s Respiratory depth in percentage of the 35° C. value in relation to body temperature (eight anunals: O, X, 3 , + , A, • , » and t ) .
Table i
Vent./hr. (BTPS) Standard Vent./hr. (STPD)
On the regulation of the respiration in reptiles. I 307
The high numerical value of the quotient (65-97, as compared to 20-24 m man) is probably due to the rather primitive structure of the lungs (cf. Milani, 1894).
DISCUSSION
This part of the investigation showed that the rise in metabolic rate caused by an increase in temperature is accompanied by an increase in pulmonary ventilation. The increase is brought about by an increase in respiratory frequency, whereas the re-spiratory depth remains practically unchanged.
The increased ventilation may be caused by an increased blood pCO2 or by the
increased temperature per se, or, perhaps, by a combination of both factors. An increased blood />COa could be caused simply by the increased production of CO2 at
the higher temperatures. No values of blood />CO2 are available, but certain
con-clusions as to its variations may be drawn from the experimental results. The COa output per minute can be expressed as:
COa production = pulmonary ventilation (STPD)
x (expired COa %-inspired COJJ%),
from which follows that
pulm. vent. (STPD) 1
COa production (STPD) ~ (exp. CO2%-insp. CO,%)'
The left-hand expression decreases as temperature increases (Table 1, column 7). Consequently, (exp. COa % — insp. COa %) must be increasing. As the inspired CO2
percentage is kept nearly constant (it must be equal to the average COa percentage
in the helmet, which again is approximately equal to that in the exit air), it follows that the CO2 percentage in the expired air must be higher at the higher temperatures.
With a constant respiratory depth (and a presumably constant dead space) it can be concluded that the alveolar CO2 percentage and hence the blood and tissue pCO2 is
also higher at higher temperatures. The increased ventilation must, therefore, at least partly be caused by an increased CO2 stimulus on the respiratory centre.
This effect of the increased tissue and blood pCOt on respiration is apparently
different from the effect of CO2 added to the inspired air in that it increases the
respiratory frequency and ventilation, whereas inspired COa increases the respiratory
depth and slows the frequency as will be discussed in Part III.
An effect of increased temperature alone on respiration has been demonstrated by v. Saalfeld (1934a). He found that local heating of a leg of Urotnastix, from which the skin was removed and all nerve connexions cut, was followed by an increased ventilation. This effect could be prevented if the neck of the animal (carotid and vertebral arteries) was cooled. From this he concluded that the rise in pulmonary ventilation was caused by a heating of the respiratory centre by the blood. He assumed that, by a general heating of the animal, metabolites from the increased metabolism should further act as stimuli for the respiratory centre, as cooling in this case did not completely abolish the ventilatory increase.
In humans, Cunningham & O'Riordan (1957) have found that a raised temperature increases the sensitivity of the respiratory centre towards COa. An interaction of this
reasons for the increase in pulmonary ventilation at higher temperatures. Finally, metabolic factors other than CO2 could be involved in the ventilatory response to
increased temperature. Whether the increase is caused by one or several of the above-mentioned factors cannot be decided at present. Determinations of pCO2 in blood
and alveolar air may give interesting results.
In the temperature interval studied here the rise in pulmonary ventilation is not connected with temperature regulation. The rise is called forth by the metabolic requirements. This can be seen from the ratio pulmonary ventilationjtitre of O2 con-stoned. This quotient is not higher at higher temperatures as it would have been if
the ventilatory rise was due to thermal panting. On the contrary, the value of
ventilation {BTPS)jhr. -=- O2 uptake {STPD)jhr. at both 300 and 35° C. is smaller than
at io° and 200 C. At still higher temperatures it is quite possible that Lacerta also would show thermal panting [cf. Langlois (1901), Cowles & Bogert (1944), and others]. The better utilization of the respiratory air found at higher temperatures (cf. ventilation (STPD)/Oa uptake (STPD), Table 1) may be due to a larger, and perhaps
better distributed, blood flow through the lungs. It cannot, however, be due to a relatively decreased anatomical dead space, as the respiratory depth is not greater but remains unchanged or even becomes smaller at 300 and 350 C.
III. PULMONARY VENTILATION AND OXYGEN UPTAKE AT DIFFERENT COa PERCENTAGES
Five lizards (2 Lacerta sicula and 3 L. viridis) were used for the study of the influence of CO2 on respiration. The procedure is described in Part I. Pulmonary ventilation,
respiratory frequency and depth, and oxygen uptake were measured.
The composition of the actually inspired or expired air is not known and cannot be computed from the values measured in the experiments. The exit air, however, must fairly accurately represent the average composition of the air in the helmet from which the animal inspires. By changing the flow rate and the composition of the influx air, the exit air can be maintained at a relatively constant composition for any
COa percentage desired.
The CO8 percentage of the expired air and the alveolar air is naturally higher than
that of the exit (and influx) air. At a constant CO2 production (i.e. rest at constant
temperature) an increase in COa percentage in the helmet (exit air) would produce
an equal increase in the expired air if the ventilation did not change. If, however, the ventilation increases, the increase in COa percentage of the expired air will be
less than that of the exit air.
In the following paragraphs the changes in pulmonary ventilation and respiratory pattern will be related to the CO, percentage in the exit air. It must be understood that the changes in alveolar CO2 percentages may be smaller than those of the exit
air, i.e. in cases where the alveolar ventilation has increased.
RESULTS
When the CO2 percentage of the exit air is increased, the respiratory pattern
changes. CO2 percentages below 3 % in the exit air causes a gradual increase in
On the regulation of the respiration in reptiles. I 309
When the COa percentage is increased above 3-4% it produces a 'periodic inhibition'
of respiration. Groups of respirations separated by inspiratory pauses lasting up to 1 min. occur. The duration of this periodic inhibition ('Cheyne-Stokes-like' re-spiration) is dependent on the CO2 percentage, lasting from a few minutes at 3 % to
more than 1 hr. at 13-6%. In this state the respiratory depth is increasing, while the pulmonary ventilation naturally is very low due to the disturbed breathing rate. This is illustrated by Figs. 6a, 7 and 8, where the effect of 7-2% COS is
shown.
After 20-60 min. respiration always becomes adjusted to the CO2 percentage and
is unchanged and regular from then on (steady state, Fig. 6b).
1 min.
Fig. 6. Respiration curves: (a) Start of CO, breathing, note Cheyne-Stokes respiration and long inspiratory pauses. (6) Steady state, 7-2 % CO, in exit air. (c) Change from CO, breathing to room air breathing at 4- (read left to right).
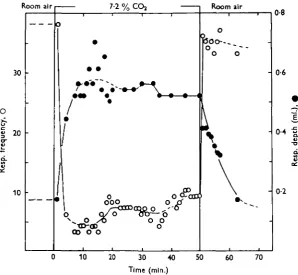
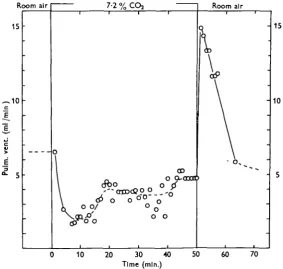
After a steady state has been reached, a sudden shift back to room air with quick flow causes an instantaneous increase in respiratory frequency and, consequently, also in pulmonary ventilation (cf. Figs. 7 and 8). The ventilations attained here are the highest registered for the animals concerned. The respiratory frequency then decreases gradually, reaching the normal steady-state value after 2-10 min.
During the same time the respiratory depth after the shift to room air decreases slowly and, consequently, the pulmonary ventilation also decreases. Normal values for respiratory depth and ventilation are reached after 20-30 min. (Figs. 7, 8).
In Fig. 9 the pulmonary ventilation in the steady state is plotted in relation to the CO2 percentage in the exit air. It is seen that an increase in CO2 to about 3 % causes
a slight increase in pulmonary ventilation. At further increases in the CO2 percentage
the ventilation again decreases, even to subnormal values. This maximum, at about 2-75 % CO2, was observed in all five animals investigated. In the most COa-sensitive
animal the ventilation was doubled at this CO2 concentration.
Fig. 9 shows that in the steady state the respiratory depth increases regularly with increasing CO2 percentage in the exit air (0-4-13-6 %), while the respiratory frequency
decreases. These relationships between CO2 and respiratory depth and frequency was
Room air Room air
10 20 30 40 50
Time (min.)
[image:10.451.69.368.68.343.2]60 70
Fig. 7. Respiratory changes produced by changing from room air breathing to CO, breathing (50 min.) and back to room air. COt percentage 7-2 in exit air. Time in minutes. O,
Respira-tory frequency; • , respiraRespira-tory depth (one animal). Temp. 200 C.
DISCUSSION
The results presented in Figs. 6-9 show that CO2 in the inspired air influences
respiration markedly at all percentages used. At percentages lower than 3 % COjj causes an increased pulmonary ventilation, while higher percentages cause a decrease in pulmonary ventilation to subnormal values. Higher CO2 percentages (above
3-4%) cause further transitory disturbances in the respiratory pattern ('periodic inhibition') by causing a 'Cheyne-Stokes-like' respiration.
Babak (1914a, b), v. Saalfeld (1934a), Vos (1936), and Boelaert (1941) found 'dyspnoea' at low (< 5 % COj) and 'inhibition' at higher CO2 percentages. But
most of their experiments on the influence of CO2 on respiration lie outside the interval
where CO2 stimulates the pulmonary ventilation. Siefert (1896) used 100% CO2; the
narcotic effect therefore was dominant in his experiments. Randall et al. (1944) found that, after a period of apnoea, respiration was stimulated by CO2 even in very high
percentages. This may be due to the fact that their CO2 experiments lasted only until
On the regulation of the respiration in reptiles. I 311
The present study shows that an increase in the CO2 percentage in the inspired
air causes an increase in respiratory depth (Fig. 9). The gradual increase in respiratory depth after the beginning of CO2 breathing (Fig. 7) may imply that the respiratory
depth follows the />CO2 changes of the blood. It is presumed that the pCOz increases
gradually from the beginning of the CO2 breathing and, after some time, reaches a
steady level. On shifting from CO2 breathing back to room air breathing, the
respira-tory depth again decreases slowly (as opposed to the immediate change in frequency). This might also correspond to the presumably slow fall in the/>CO2 of the blood caused
by the gradual COa release from the tissues on returning to room air breathing.
However, the respiratory depth did not increase when the />CO2 of the blood was
increased by raising the temperature (metabolic rate) of the animal. It is also possible that the increased respiratory depth may have been influenced by an oxygen lack in the respiratory centre, this oxygen lack being produced by the long apnoeic pauses after the start of the CO2 breathing and maintained by the low respiratory rate in the
steady state. This assumption, however, needs special investigation.
1 5 •
,10
-oom air
•
-0
\
\ O 0/
7-2 % CO,
cfto
5 o o °"°
c c o
o o CD
Room air
\ :
i ;
\ :
•
-- 15
- 10
• 5
10 20 30 -40 Time (mln.)
[image:11.451.81.365.256.525.2]50 60 70
Fig. 8. As Fig. 7 (see Fig. 7), but showing the variation in pulmonary ventilation.
As for the respiratory frequency, no simple correlation seems to exist between frequency and blood pCOt. At the beginning of CO2 breathing and in the steady
state, the respiratory frequency is the lower the higher the pCOt is in the blood.
An increase in pCOz produced by an increase in metabolic rate, however, increases
causes the frequency to decrease, while an increased C02 tension in the tissues,
when the CO2 content in the inspired air is low, causes the frequency to increase.
The steady-state relationship between frequency and CO2 content in the inspired
air can be explained by the assumption that the respiratory frequency is depressed via chemoreceptive nerve endings in the lungs. An increase in activity of these
8 10 % CO2 in exit air
12 14 16
Fig. 9. Respiratory frequency, depth, and pulmonary ventilation in relation to the COf
percentage in the exit air. Above: O, respiratory frequency; • , respiratory depth. Below: O, pulmonary ventilation (one animal). Temp. 20° C.
chemoreceptors might occur as a response to increasing CO2 content in the lungs.
Experiments of v. Saalfeld, Vos and Boelaert have shown that such chemoreceptors exist and that the receptors must be situated in the lungs, not in the upper respiratory pathways. Thus the 'periodic inhibition' at the beginning of CO2 breathing with
higher CO2 percentage is thought to be a reflex (Babak, v. Saalfeld, Vos and Boelaert)
On the regulation of the respiration in reptiles. I 313
lungs reach the respiratory centre via the vagus nerve, as he found that the inhibition (depression of the frequency) was abolished when the vagus was cut. The causes of the return of the 'Cheyne-Stokes' respiration during prolonged CO2 breathing to
a regular pattern may be thought to be due to an adaptation of the postulated pulmonary chemoreceptors to the CO2 stimulus, whereas the sudden increase in respiratory
frequency, on shifting from CO2 breathing to room air breathing, would then be due
to the disappearance of the depression as room air enters the lungs. The respiratory frequency in the first few minutes after the shift is higher than the normal (about twice the normal steady state frequency). This may be an effect of the still high blood and tissue />CO2 on the respiratory centre. As in the experiments with increased body
temperature the CO2 content in the inspired air is now low and an increased tissue
^CO2 seems to increase the respiratory frequency as shown in Part II.
In the steady state of COt breathing, the inhibitory effect of CO2 via the lung
receptors may veil this direct accelerating effect that blood and tissue CO2 seems to
have on the frequency. However, no correlation between the previous CO2 percentage
and the maximum value of respiratory frequency after the shift to room air was found in the present experiments.
As for the pulmonary ventilation, this study seems to show that in Lacerta the pulmonary ventilation is not primarily regulated by CO2. In the steady state the
ventilation could, at the most, only be doubled by CO2 administration. This small
ventilatory increase (the result of the COa effect on the respiratory frequency) is
especially striking when the great ability of the animals to increase both respiratory frequency and depth is considered. According to Babak, a combination of low O8
concentration and CO2 in the inspired air gives a heavy ' dyspnSe' in Iguana. In man,
Nielsen & Smith (1951) similarly have shown that, during hypoxia, the effect of CO2 on the pulmonary ventilation is much increased. It seems possible that in the
case of Lacerta also, a combination of CO2 and low oxygen percentages can stimulate
the pulmonary ventilation to much higher values than CO2 administration alone.
SUMMARY
1. In two species of Lacerta (L. viridis and L. sicula) the effects on respiration of body temperature (changes in metabolic rate) and of CO2 added to the inspired air
were studied.
2. Pulmonary ventilation increases when body temperature increases. The increase is brought about by an increase in respiratory frequency. No relationship is found between respiratory depth and temperature.
3. The rise in ventilation is provoked by the needs of metabolism and is not established for temperature regulating purposes (in the temperature interval 10°-35° C ) .
4. The ventilation per litre O2 consumed has a high numerical value (about 75,
compared to about 20 in man). It varies with the body temperature and demonstrates that the inspired air is better utilized at the higher temperatures.
5. Pulmonary ventilation increases with increasing CO2 percentages in the inspired
air between o and 3 %. At further increases in the CO2 percentage (3-13-5 %) it
decreases again.
6. At each COa percentage the pulmonary ventilation reaches a steady state after
some time (10-60 min.) and is then unchanged over prolonged periods (1 hr.). 7. The respiratory frequency in the steady state decreases with increasing CO2
percentages. The respiratory depth in the steady state increases with increasing COa
percentages. This effect of CO2 breathing is not influenced by a change in body
temperature from 200 to 300 C.
8. Respiration is periodically inhibited by COa percentages above 4 % . This
inhibition, causing a Cheyne-Stokes-like respiration, ceases after a certain time, proportional to the CO2 percentage (1 hr. at 8-13 % CO2), and respiration becomes
regular (steady state). Shift to room air breathing causes an instantaneous increase in frequency to well above the normal value followed by a gradual decrease to normal values.
9. The nature of the COj effect on respiratory frequency and respiratory depth is discussed, considering both chemoreceptor and humoral mechanisms.
This work was supported by a grant from ' The Danish State Research Foundation' given to Dr Marius Nielsen.
REFERENCES
BABAK, E. (1914a). Uber die Atembewegungen und lhre Regulation bei den Eidechaen. Pfltig. Arch.
get. Phytiol. 156,
531-71-BABAK, E. (19146). Uber die Atembewegungen und ihre Regulation bei den Panzerrechsen.
Pfltig-Arch. ges. Phynol. 156, 572-601.
BERT, P. (1870). Lecons sur la phytiologie compared de la respiration. Paris.
BOELAERT, R. (1941). Sur la physiologic de la respiration de lacertiens. Arch. int. Phytiol. 51, 379-436.
BOELAERT, R. (1942). Sur la physiologic de la respiration de l'alligator mississippiensis. Arch. int.
Phynol. 5a, 57-72.
COWLES, R. B. & BOOERT, C. M. (1944). A preliminary study of the thermal requirements of desert reptiles. Bull. Amer. Mut. Nat. Hist. 82, no. 5, 265—96.
CUNNINGHAM, D. J. C. & O'RIORDAN, J. L. H. (1957). The effect of a rise in the temperature of the body on the respiratory response to CO| at rest. Quart. J. Exp. Phytiol. 42, 329-45.
KAHN, R. H. (1902). Zur Lehre von der Atmung der Reptilien. Arch. Anat. Phytiol., Lpz. {Physiol.
Abt.), pp. 29-52.
LANOENDORFF, O. (1891). Kleine Mittheilungen zur Athmungslehre. I. Untersuchungen zur Athem-mechanik und zur Athmungsinnervation bei einigen Reptilien. Arch. Anat. Phystol., Lpz. (Phytiol.
Abt.), pp. 486-91.
LANGLOIS, J. P. (1901). De la polypnee thermique chez les animaux a sang froid. C.R. Acad. Set.,
Paris, 133, 1017-19.
MTLANI, A. (1894). Beitrage zur Kenntnis der Reptdlienlunge. I. Zool. Jb. {Abt. 2), 7, 545-92. NIKLSKN, M. & SMITH, H. (195 I). Studies on the regulation of respiration in acute hypoxia. Acta
phytiol. tccaid 14, Fasc. 4, 293-313.
RANDALL, W. C , STUIXKEN, D. E. & HIESTAND, W. A. (1944). Respiration of reptiles as influenced by
the composition of the inspired air. Copeia, pp. 136-44.
v. SAALFELD, E. (1934a). Die mechanik der Atmung bei Uromattix. Pft&g. Arch. get. Physiol. 333, 43I-48.
v. SAALFKT.D, E. (19346). Die nervdse Regulierung der Atembewegungen bei Uromattix. PflOg. Arch.
get. Physiol. 333, 449-68.
SCHOLANDKR, P. F. (1947). Analyser for accurate estimation of respiratory gases in one-half cubic centimeter samples. J. Biol. Chan. 167, 235-50.
SIEFERT, E. (1896). Ueber die Athmung der Reptilien und VOgeL PflUg. Arch. ges. Phytiol. 64, 321-506. Vos, H. J. (1936). Over Ademhalmg en Reukxin by Reptilien en Amphibiln. Proefschnft, Groningen. WIIXBM, V. & BERTRAND, M. (1936). Le triphasisme respiratoire chez les Lezards. Bull. Acad. roy.