Study of Attention Capture Aspects with respect to
Contrast Ratio for Wide Background Luminance
Range in Head-up Displays
Karar Vinod, Member IAENG; Singh Yaduvir; Bajpai P P and Garg Harry
Abstract: The continuing progress in head-up display technologies has resulted in its enhanced performance and its applications to various spinoffs. The head-up displays (HUDs) provide prime flight, navigation, and guidance information to the pilot in his/her forward field of view superimposed on the outside scene on a see through glass assembly known as beam combiners (BC), thus allowing the simultaneous scanning of both instrument data and the out-of-the-window scene. Although the HUD has been shown to improve flight performance, there are perceptual and cognitive issues associated with HUDs. Several researches have pointed out a number of issues related to the pilot distribution of near and far domain attentional resources because of the compellingness of symbology elements on the HUD; a concerned term, attention or cognitive capture. Results from a number of simulator based studies suggest that HUDs may decrease pilot situation awareness (SA) in tasks that require continuous monitoring of information in the environment. There is a definite relation of absolute display symbology luminance and the contrast ratio with the attention capture. The study conducted based on participant’s response to varying contrast ratios on HUD under the simulated conditions shows that the optimum value of contrast ratio is between 2 to 5 where the user response is optimized to event detection both on the HUD symbology as well as on the outside scene. Hence it is essential to keep good contrast ratio for comfortable viewing against varying background light conditions. This can be achieved by varying the display luminance according to the background luminance level i.e. at lower background luminance, the display luminance should be made less to avoid too high a contrast ratio which causes problems like reflection, reduced outside view, scattering etc while at high background luminance level, the display luminance should be made sufficiently high to maintain a good contrast ratio to the extent possible.
Index Terms: Head-up Display, Attention Capture, Tunneling, Background Luminance, Symbol Luminance, Contrast Ratio, Situational Awareness, Clutter
I. INTRODUCTION
Attention capture is typically used to refer to the inefficient attentional switching (from HUD to primary task) when using HUDs. This may result in missing external targets, delayed responses to external events, and/or
asymmetrical transition times (longer to switch from HUD-to-external visual processing than vice versa). In effect, the HUD can act as an attentional ‘trap’ that draws information processing resources to the HUD and slows/degrades processing of external events. Although cognitive capture can also work in the reverse direction (i.e., longer to switch from external-to-HUD visual processing than vice versa), the safety relevance of this manifestation of cognitive capture is disputed. Degradation in peripheral performance is attributable to a narrowing of the focus of attention. In the literature, this term is used interchangeably with “cognitive capture” and “cognitive tunneling". Attentional tunneling is only manifested when performance decrements are demonstrated as a function of eccentricity. It can become more difficult to switch attention between objects. This effect is called attentional tunneling. With HUDs, this implies that the compelling nature of the HUD images inhibits the detection of other critical events (especially when the event is unexpected and/or the bottom-up signal quality is degraded), which might lead to unsafe situations like unnoticed runway incursions. [7], [19], [20], [21]
This phenomenon may also result in situation where the pilot or driver may be totally lost in thought, a condition which, in particular, could impair situational awareness. Information processing and capture by the user in head-up displays is critically dependent on attention. Users are much better at detecting events in the environment if their attention is focused on the area in which those events occur. However, attention is a resource with limited capacity. Under some circumstances, a single task or aspect of the environment will capture all of the individual’s attention. If the individual focuses attention in this way then he or she will filter out unattended information and may not detect task-critical information. [1], [2], [3], [4], [5]
The cognitive tunneling is referred to as “the allocation of attention to a particular channel of information, diagnostic hypothesis, or task goal, for a duration that is longer than optimal, given the expected cost of neglecting events on other channels, failing to consider other hypotheses, or failing to perform other tasks”. [6]
Intuitively, one might expect that HUDs would enhance a pilot’s ability to detect events in the external world because the pilot does not have to switch attention back and forth between an HDD and the external environment. However, there is strong evidence to suggest that HUD symbology can capture a pilot’s attention, and impair the pilot’s ability to detect events in the external environment. One of the main areas of interest is whether pilots can view the HUD and the external scene concurrently. It would appear that this is not the case and that pilots need to switch attention back and forth between the HUD and the external scene. [7]
Manuscript received December 26, 2011; revised January 24, 2012.
Karar Vinod is with the Central Scientific Instruments Organisation (CSIR-CSIO), Chandigarh, India. Phone: 2637232; Fax: 91-172-2651808; E-mail: vkarar@rediffmail.com
Singh Yaduvir is with the Thapar University, Patiala, India. E-mail: dryaduvirsingh@gmail.com
Bajpai P P is with the Central Scientific Instruments Organisation (CSIR-CSIO), Chandigarh, India. E-mail: p_p_bajpai@yahoo.co.in
II. BACKGROUND
There are a number of advantages in using HUDs which include increases in flight path tracking accuracy, except during cruise flight; benefits for event detection, except in the approach and landing phase and for unexpected events; lower visibility takeoff and landing; more accurate approach and landing; the elimination of head-down time; a reduction in the time taken to refocus between instruments and the external scene; and the potential to use overlaid symbology for the external scene when it is not visible, raster display during low light condition flights, and hence enhancing situation awareness, its flip sides are problems in switching attention between the internal and external scene and difficulties in detecting unexpected events. Potential reasons like information and work overload, failure to notice sudden changes or change blindness, location of symbology reticles, symbology clutter, mis-accommodation, detection of expected and unexpected events, non-conformal symbology, luminance and contrast ratio, spatial disorientation, HUD field of view, event detection etc contributes in some way or the other in attention capture and tunneling phenomenon.
Several studies were conducted where role of luminance and the contrast ratio in HUD was investigated along with other issues leading to attention capture and consequent tunneling. The results of a study were further extended by another study in which the authors sought to eliminate possible confounds that could lead to other explanations for the presence of a performance tradeoff in attention capture in HUDs. Confounds of differential contrast, complexity, and motion between HUD and background were identified and addressed in their study in an attempt to eliminate them. Therefore, previously unmatched luminance levels of sky and ground were perceptually matched utilizing the technique of heterochromatic flicker photometry method; HUD symbology was changed from white to bright green in order to portray more realistic flight instrumentation, two levels of symbology-to-background luminance were established and defined by contrast ratios (symbology luminance divided by background luminance): 28.80 (High Contrast) and 7.48 (Low Contrast). Results from this study found no effect of Contrast for both Altitude and Path Root Mean Squared Error (RMSE) dependent measures. It was also revealed that there was the possibility of symbology salience resulting from high contrast might hinder efficient processing of HUD information and world information. Implications suggested that high contrast symbology contributing to symbology compellingness, may affect efficient processing, regardless of symbology relevance. They also suggested further examination of symbology salience in a high contrast presentation. [8], [9], [10]
III. DISCUSSIONS
Highlighting salient information and reducing the luminance of information that may be less important and distracting helps in reducing clutter which forms a very potential source of attention capture. In a study it was found that increase in contrast ratio assisted pilots in cruise flight in responding faster to changes in heading, airspeed, and altitude indicators in the HUD condition. [11], [12]
Furthermore, when the contrast ratio of the HUD was the same as that of the HDD, the detection of events in both the near and far domain was superior in the HUD condition. Low lighting the additional information, however, provided pilots with a sense of what was important on the display and distraction from far domain elements was less likely. The results from this study suggest that putting symbology into an appropriate location on the HUD, and ensuring an appropriate level of symbology intensity and contrast with the environment, improve HUD performance. [7], [13]
The inadequate symbol dynamics, lack of standardization were linked with the symbology and operational use, inadequate field-of- view (FOV), intensity/contrast problems, night visibility issues, and an increase in HUD-induced spatial disorientation. These past studies have concluded that the lower the contrast ratio, the greater the potential for object detection at the expense of detection of commanded flight changes and maintenance of desired flight path (i.e., tracking). [14], [15]
Although the literature seemingly agrees that clutter and contrast is a concern during the approach and landing phases of flight, there is relatively little research examining the issue for other phases. Therefore, these researchers performed experiments to address issues involving role of clutter costs (vs. scan costs) effect event detection both for symbology and environment during cruise phase of flight; and involving the effects of intensity and contrast that may modulate the effects of clutter, which was answered through manipulating the weather against which the instruments was displayed and level of the symbology luminance. The experiment conducted to study the response of pilots to events on the symbology and in the environment when attention was modulated through location, luminance, and conformality of the symbology in a low fidelity simulation showed that the detection of commanded flight changes and flight path tracking was superior in the head-down condition due to the high contrast ratio of the HDD. The study also focused on the prediction of the degree of contrast which influences performance and object detection only for the HUD location. It was found that the Symbology with the largest contrast ratios best supported tracking performance and symbology event detection because of the salience of the indications against the background. However, it was also hypothesized that a highly salient display could distract the pilot and captures their attention and, therefore, increase response times to aircraft events. Stated another way, a high contrast ratio benefit symbology event, but not aircraft event, detection compared to low contrast ratio. Therefore, a midlevel contrast ratio was also examined. The study also concluded that weather X intensity interaction in the HUD condition in which the intensities produced the highest contrast ratio with the background yielded the fastest response times. However, this finding was limited to symbology event detection only. [16], [17], [18]
IV. CONTRAST RATIO
luminance is of order of 3.4x10⁴cd/m2, is more than 6.8x10³cd/m2 to maintain a contrast ratio better than 1.2.
For very high range of luminance, the display symbology luminance has to be significantly higher to maintain an adequate contrast ratio. The Contrast Ratio in our study has been expressed as:
Contrast Ratio = (Display Luminance + Background Luminance) / (Background Luminance)
V. EXPERIMENTAL SETUP
Experiment was focused on how user would respond to events on the HUD symbology and in the environment, that is, the outside scene when attention was modulated through ambient and the HUD displays symbology luminance, thus varying the contrast ratio in a low fidelity simulation.
[image:3.595.346.516.50.222.2]The Simulator setup to carry out the study was created using HUD unit developed for LCA-Tejas, X-Y-Z movement platform, Projector setup along with simulator PC, HUD signal simulator, Light source, Light diffuser, Pritchard Spectrophotometer, White background and a TV monitor. The combination of Light source, Light diffuser, Projector setup using simulator PC and White background created various background events at various luminance levels varying from 10cd/m2 to 35,000cd/m2 while the HUD signal simulator was used to vary the HUD symbology.
Figure 1: Test setup used for studying the effect of symbol luminance & contrast ratio on event detection on HUD symbology & outside scene under varying background luminance
26 Participants were chosen for the performing tasks. 14 males and 12 females in the age group of 22 to 28 years, all with engineering background with specialization in Electronics/Computer Science and related field participated in the study and performing tasks. The participants were instructed to perform two tasks: First, to report any detected changes in the upper, lower, right and the left half of the visual field on BC; the second task was to report any detected changes in the outside scene. The luminance was set manually through luminance control potentiometer provided on the HUD unit and participants were tested on single contrast setting. The participants were allowed to train on the setup for three days to make them familiarize with the task and the setup.
[image:3.595.87.263.377.486.2]The participants were asked to perform tasks both in the morning and the evening sessions to eliminate fatigue factor. The tests were performed on three consecutive days.
Figure 2: Few test patterns displayed on HUD during study of effect of symbol luminance and contrast ratio on event detection on HUD symbology & outside scene for varying background luminance
Types of changes were: objects/character that appeared objects that disappeared, objects that changed status, and objects that changed location. All changes took place between scenes, and more than one change could occur between any two scenes. Second, participants were asked to respond to a set of computer based questions. These questions required the participants to make spatial and orientation judgments as well as counts of the visible enemy objects. Each symbology page scene contained either one or two questions, and once the questions were answered, the next symbology page was automatically displayed; therefore participants were reminded to report any changes in a scene first and then answer the questions associated with that scene. [17]
A light source capable of generating light luminance more than 85,000 cd/m2 was used in the experiment. The light output of the source was attenuated using diffuser to simulate background light conditions for luminance levels from 50cd/m2 to 35,000cd/m2. The photometer was used to measure the luminance.
VI. EXPERIMENTAL RESULTS
The results are generated for two conditions: one with background luminance between 100cd/m2 to 35,000cd/m2 and other with background luminance less than 100cd/m2.
Figure 3 to figure 14 shows the plots for Symbol luminance and Contrast ratio Vs Event Detection on HUD Symbology & Outside scene for Background luminance of 35,000, 25,000, 15,000, 5,000, 500, and 100 cd/m2.
0 10 20 30 40 50 60 70 80 90 100
2500 3500 4500 5500 6500 7500 8500 9500
Symbol Luminance (Cd/m2)
[image:4.595.76.265.113.241.2]Event Detection on HUD Symbology (%) Event Detection on Outside Scene (%)
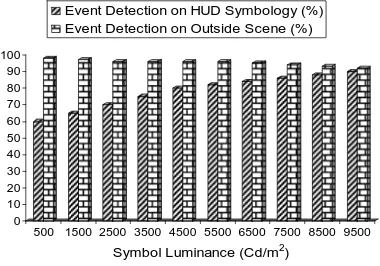
Figure 3: Plot for symbol luminance vs event detection on HUD symbology & outside scene for background luminance of 35,000cd/m2
0 10 20 30 40 50 60 70 80 90 100
1.07 1.1 1.128 1.157 1.185 1.214 1.242 1.27
[image:4.595.319.537.242.335.2]Contrast Ratio (CR) Event Detection on HUD Symbology (%) Event Detection on Outside Scene (%)
Figure 4: Plot for contrast ratio vs event detection on HUD symbology & outside scene for background luminance of 35,000cd/m2
0 10 20 30 40 50 60 70 80 90 100
500 1500 2500 3500 4500 5500 6500 7500 8500 9500
Symbol Luminance (Cd/m2)
[image:4.595.75.269.283.412.2]Event Detection on HUD Symbology (%) Event Detection on Outside Scene (%)
Figure 5: Plot for symbol luminance vs event detection on HUD symbology & outside scene for background luminance of 25,000cd/m2
0 10 20 30 40 50 60 70 80 90 100
1.02 1.06 1.1 1.14 1.18 1.22 1.26 1.3 1.34 1.38
Contrast Ratio (CR) Event Detection on HUD Symbology (%) Event Detection on Outside Scene (%)
Figure 6: Plot for contrast ratio vs event detection on HUD symbology & outside scene for background luminance of 25,000cd/m2
0 10 20 30 40 50 60 70 80 90 100
500 1500 2500 3500 4500 5500 6500 7500 8500 9500
Symbol Luminance (Cd/m2) Event Detection on HUD Symbology (%) Event Detection on Outside Scene (%)
Figure 7: Plot for symbol luminance vs event detection on HUD symbology & outside scene for background luminance of 15,000cd/m2
0 10 20 30 40 50 60 70 80 90 100
1.033 1.1 1.166 1.233 1.3 1.366 1.433 1.5 1.566 1.633
Contrast Ratio (CR)
Event Detection on HUD Symbology (%) Event Detection on HUD Symbology (%)
Figure 8: Plot for contrast ratio vs event detection on HUD symbology & outside scene for background luminance of 15,000cd/m2
0 10 20 30 40 50 60 70 80 90 100
500 1500 2500 3500 4500 5500 6500 7500 8500 9500
[image:4.595.333.523.372.505.2]Symbol Luminance (Cd/m2) Event Detection on HUD Symbology (%) Event Detection on Outside Scene (%)
Figure 9: Plot for symbol luminance vs event detection on HUD symbology & outside scene for background luminance of 5,000cd/m2
0 10 20 30 40 50 60 70 80 90 100
1.1 1.3 1.5 1.7 1.9 2.1 2.3 2.5 2.7 2.9
[image:4.595.77.265.461.587.2]Contrast Ratio (CR) Event Detection on HUD Symbology (%) Event Detection on Outside Scene (%)
[image:4.595.331.524.541.674.2] [image:4.595.74.267.624.756.2]0 10 20 30 40 50 60 70 80 90 100
100 500 1000 1500 2000 2500 3000 3500 4000 4500
Symbol Luminance (Cd/m2)
[image:5.595.76.266.51.180.2]Event Detection on HUD Symbology (%) Event Detection on Outside Scene (%)
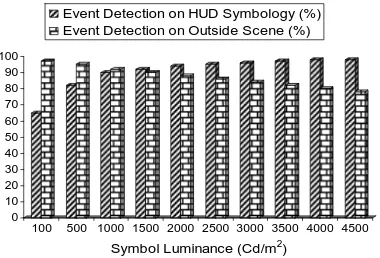
Figure 11: Plot for symbol luminance vs event detection on HUD symbology & outside scene for background luminance of 500cd/m2
0 10 20 30 40 50 60 70 80 90 100
1.2 2 3 4 5 6 7 8 9 10
[image:5.595.75.268.219.351.2]Contrast Ratio (CR) Event Detection on HUD Symbology (%) Event Detection on Outside Scene (%)
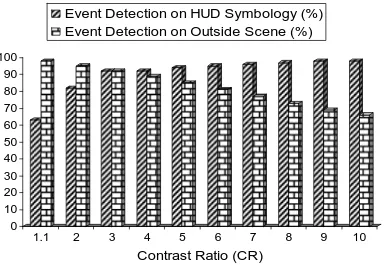
Figure 12: Plot for contrast ratio vs event detection on HUD symbology & outside scene for background luminance of 500cd/m2
0 10 20 30 40 50 60 70 80 90 100
10 100 200 300 400 500 600 700 800 900
[image:5.595.344.534.390.519.2]Symbol Luminance (Cd/m2) Event Detection on HUD Symbology (%) Event Detection on Outside Scene (%)
Figure 13: Plot for symbol luminance vs event detection on HUD symbology & outside scene for background luminance of 100cd/m2
0 10 20 30 40 50 60 70 80 90 100
1.1 2 3 4 5 6 7 8 9 10
Contrast Ratio (CR) Event Detection on HUD Symbology (%) Event Detection on Outside Scene (%)
Figure 14: Plot for contrast ratio vs event detection on HUD symbology & outside scene for background luminance of 100cd/m2
When the CR was made more than 5.0, the outside event detection deteriorated and there was no significant improvement in the event detection on the HUD symbology display.
Further there was no significant difference in the performance by the subjects with the location of display area viewed by them. The abruptly different results were discarded. The results from both the gender were found to be on the same lines.
Day mode with background luminance less than 100cd/m2: During the course of this test, the background luminance was varied between 10cd/m2 to 100cd/m2. For background luminance less than 80cd/m2 the percentage of detection of events on the HUD symbology was between 82% and 98% for CR values 2 and beyond. The event detection from the outside scene deteriorated sharply for CR more than 9 where the outside scene detection was less than 65%. This was due the fact that the display symbology luminance was getting reflected from the BC glasses as the outside scene beyond beam combiners was dark which not only reduced the visibility through BC glasses but also added to the reduction in outside scene event detection.
Figure 15-18 shows the plot for Symbol luminance and Contrast ratio Vs Event Detection on HUD Symbology & Outside Scene for Background Luminance of 40 cd/m2 & 80cd/m2.
0 10 20 30 40 50 60 70 80 90 100
8 80 160 240 320 400 480 560 640 720
Symbol Luminance (Cd/m2)
[image:5.595.76.266.390.522.2]Event Detection on HUD Symbology (%) Event Detection on Outside Scene (%)
Figure 15: Plot for symbol luminance vs event detection on HUD symbology & outside scene for background luminance of 80cd/m2
0 10 20 30 40 50 60 70 80 90 100
1.1 2 3 4 5 6 7 8 9 10
Contrast Ratio (CR) Event Detection on HUD Symbology (%) Event Detection on Outside Scene (%)
[image:5.595.341.534.558.689.2] [image:5.595.76.267.560.692.2]0 10 20 30 40 50 60 70 80 90 100
4 40 80 120 160 200 240 280 320 360
Symbol Luminance (Cd/m2)
[image:6.595.77.267.52.180.2]Event Detection on HUD Symbology (%) Event Detection on Outside Scene (%)
Figure 17: Plot for symbol luminance vs event detection on HUD symbology & outside scene for background luminance of 40cd/m2
0 10 20 30 40 50 60 70 80 90 100
1.1 2 3 4 5 6 7 8 9 10
Contrast Ratio (CR) Event Detection on HUD Symbology (%) Event Detection on Outside Scene (%)
Figure 18: Plot for contrast ratio vs event detection on HUD symbology & outside scene for background luminance of 40cd/m2
When the CR became more than 5.0 the accuracy level in detection of outside events started declining while the event detection on HUD symbology improved. The best performance in this case was observed at CR of 3-4 where the event detection in HUD symbology as well as on the outside scene was more than 90% accurate.
VII. CONCLUSIONS
The above results suggest that the contrast ratio of HUD symbology plays a definite role in attention capture of the users. When the CR is more than 5.0, the user tends to remain glued to the HUD symbology and slightly loses focus on the outside scene. The high display contrast grabs most of his/ her attention preventing optimal distribution of focus on both events. Similarly when the CR is very low, that is, less than 1.5-2, user is again focused on the HUD symbology as he or she is not able to see the display symbology properly against the brighter background and needs more focus. The tunneling due to this attention capture prevents the user to shift his or her attention from the HUD symbology to outside scene and vice-versa.
In the darker background conditions, the reflection from the BC glasses adds to the confusion and further deteriorates the attention capture distribution.
Hence, it could be concluded from the study conducted that the best tradeoff performance is obtained at a contrast ratio of 3-4 producing the optimum attention capture distribution at all the background luminance levels. Further, the absolute luminance level of the HUD symbology and the background luminance also affects the attention capture. More luminance of the HUD symbology may the salience of the indications against the background which in turn could distract the user and capture their attention and, therefore,
increase response times to aircraft events. In another way, a high contrast ratio would benefit symbology event, but not aircraft event, detection compared to low contrast ratio. Therefore, a midlevel contrast ratio of 3-4 gave the best results.
REFERENCES
[1] Pope S, “The Future of Head-Up Display Technology", Aviation International News, 2006.
[2] Tufano D R, “Automotive HUDs: The overlooked safety issues”, Human Factors, 39, 303-309, 1997.
[3] Houten Y A V, “Attentional effects of superimposing flight instrument and tunnel-in-the-sky symbology on the world”, Report: National Aerospace Laboratory, NLR, 1999.
[4] Zheng Y, Brown M, Herdman C M, Bleichman D, “Lane Position Head-Up Displays in Automobiles: Further Evidence for Cognitive Tunneling”, Proceedings of 14th International Symposium on Aviation Psychology, 1-3, 2007.
[5] Calhoun G L, Drapera M H, Abernathyb M F, Delgadoc F, Patzeka M, “Synthetic vision system for improving unmanned aerial vehicle operator situation awareness”, Proceedings of SPIE Enhanced and Synthetic Vision, 5802, 219-230, 2005.
[6] Chen J Y C., Oden R V N, Eifert L, Rodriguez A L, “Effectiveness of Head-Up Display for Driver Performance “, US Army Research Laboratory - Human Research & Engineering Directorate, Orlando, FL.
[7] Crawford J, Neal A, “A Review of the Perceptual and Cognitive Issues Associated with the Use of Head-Up Displays in Commercial Aviation”, International Journal of Aviation Psychology, 16(1), 1-19, 2006.
[8] Foyle D C, McCann R S, Sanford B D, Schwirzke M F J, “Attentional Effects with Superimposed Symbology: Implications for Head-Up Displays (HUD)”, Proceedings of 37th Meeting of Human Factors and
Ergonomics Society, 1340-1344, 1993.
[9] Dowell S R, Foyle D C, Hooey B L, Williams J L, “The effect of visual location on cognitive tunneling with superimposed HUD symbology”, Proceedings of 46th annual meeting of the Human Factors and Ergonomic Society, Santa Monica, CA, 121–125, 2002. [10] Shelden S G, Foyle D C, McCann R S, “Effects of scene-linked
symbology on flight performance”, Proceedings of 41st Annual
Meeting of the Human Factors and Ergonomics Society, Santa Monica, CA, 294-298, 1997
[11] May P A, Wickens C D, “The role of visual attention in head-up displays: Design implications for varying symbol intensity”, Proceedings of Human Factors and Ergonomics Society 39th annual
meeting, Santa Monica, CA, 50–54, 1995.
[12] Verver S P M, Wickens C D, ‘Allocation of attention with head-up displays”, (Tech. Rep. ARL–96–1/FAA–96–1), University of Illinois Institute of Aviation, 1996.
[13] CSIR-CSIO, “Critical Design Review of HUD for LCA”, 2010. [14] Newman R L, “Head-up displays: Designing the way ahead”,
Aldershot, England, Ashgate, 1995.
[15] Newman R L, “HUDs, HMDs, and SDO: A problem or a bad reputation”, Report: Wright-Patterson AFB, OH: Air Force Aerospace Medical Research Laboratory, 2000.
[16] Ververs P M, Wickens C D, “Conformal flight path symbology for head-up displays: Defining the distribution of visual attention in three-dimensional space”, (Tech. Rep. ARL–9–5/FAA–98–1), University of Illinois - Institute of Aviation, 1998.
[17] Lisa C T, “Visual Displays and Cognitive Tunneling: Frames of Reference Effects on Spatial Judgments and Change Detection”, Proceedings of the 45th Annual Meeting of the Human Factors and Ergonomics Society, Santa Monica, CA, 2001.
[18] Prinzel L J, Risser M, “Head-up displays and attention capture (Tech. Rep. NASA/TM-2004-213000). Hampton, VA: NASA – Langley Research Center, 2004
[19] Kenneth W G, Staplin L, “Human Factors Aspects of Using Head UP Displays in Automobiles: A Review of the Literature”, Interim Report: U.S. Department of Transportation, National Highway Traffic Safety Administration, 1995.
[20] Verver S P M, Wickens C D, ‘Allocation of attention with head-up displays”, (Tech. Rep. ARL–96–1/FAA–96–1), University of Illinois Institute of Aviation, 1996.
[image:6.595.75.268.218.351.2]