Simulation Based Plant Maintenance Planning with
Multiple Maintenance Policy and Evaluation of
Production Process Dependability
Evgeny Malamura, Tomohiro Murata
Abstract - In this paper we propose a simulation model combining two processes of different origin (the production process and the information flow of maintenance work-orders) in one model in order to investigate how the interaction between the processes affect the performance of the production system, as well as to define the optimization opportunities.
The proposed approach aims to extend the capabilities of the conventional reliability analysis techniques by focusing on dynamic aspects of the production system and to present a method for representation of technical, operational, maintenance, organizational and economic aspects by simulation modeling concepts.
Index Terms – Plant Maintenance, Simulation, Production process dependability
I. INTRODUCTION
Maintenance can be defined as the combination of all technical and associated administrative actions performed to prevent failure-mode occurrences or to repair failed components. It‟s a fundamental aspect of industrial system
efficiency. Maintenance systems can have a large impact on the profit of a plant and selecting appropriate maintenance policies is vital for each manufacturing company.
Manuscript received December 29, 2011
Evgeny Malamura is a doctorate student in the Graduate school of Information, Production and System, Waseda University (2-7 Hibikino,Wakamatsu-ku, Kitakyushu-shi, Fukuoka, Japan).
Tomohiro Murata is a professor in the Graduate school of Information, Production and System, Waseda University, Japan. (2-7 Hibikino, Wakamatsu-ku, Kitakyushu-shi, Fukuoka, Japan)
Modern manufactures are equipped with complex production lines, which have complex composition of reliability requirements, safety levels, and failure effects. An
evaluation of the performance of such manufacturing systems and effectiveness of the applied policies of
maintenance also become a complex task that requires appropriate analysis methods and tools. Such methods and tools which allow comparing an impact of maintenance on
the production process both in a qualitative and quantitative manner and support determination of efficient maintenance program and plant performance improvement options.
In practice the impact of foreseen maintenance actions is often hard to estimate prior to introduction as well as the
plant operation and dynamic characteristics strongly affect components and plant dependability. Thereby production system performance improvement becomes a non-trivial
optimization problem.
There is a variety of methods of system analysis to tackle this problem in practice of reliability and safety
engineering. These methods are widely used and approved as standards for analyzing hazardous technical systems in the industry (e.g. Fault Tree Analysis, Event Tree Analysis,
Failure Mode and Effect Analysis, Hazard and Operability
Study), as well as many of them are included into more general engineering frameworks (e.g. Reliability Centered
views, and tend to stand isolated in determining individual dependability attributes.
Therefore, an approach to extend the capabilities of the
conventional analysis techniques including multiple maintenance policies is taken by focusing on dynamic
aspects of the production system and representation of technical, operational, maintenance, organizational and economic aspects by simulation modeling concepts.
II. PRODUCTION PERFORMANCE AND MAINTENANCE EFFECTIVENESS ANALYSIS
SIMULATIONS
Simulation is one of the most widely used Operations
Research and management-science techniques. It allows for any arbitrary model complexity and circumvents analytically intractable models. Application of performance analysis and simulation can save money in a production
company (not only of the process industry), avoiding potentially costly “trial-and-error” experiments with the real
plant.
There are various classical simulation modeling concepts of assessment system performance suitable for evaluation and optimization of maintenance process; such as discrete
Markov chain model, stochastic Petri nets and Monte Carlo
simulations which offer a powerful modeling tools for
system dependability studies that allows the description of: random phenomena, such as failure occurrence; deterministic phenomena, such as maintenance
action realization;
discrete phenomena, such as event occurrence; continuous phenomena, such as degradation
mechanism evolution
However, lately there are also plenty of software
computer packages for discrete event systems simulations which allow creating a visual model of the system under investigation easily, taking into account real life constraints,
capacities, failure rates, shift patterns, and other factors affecting the total performance and efficiency of production. Through this kind of model it is possible to test real
scenarios in a virtual environment, simulate planned function and load of the system, change parameters affecting system performance, carry out extreme-load tests, verify by
experiments the proposed solutions and select the optimal solution. As well as the visual simulation model is usually
much more illustrative even for those who has no background knowledge about other classical concepts rest upon mathematical modeling symbolism.
According to the purpose of a simulation model, the differentiations between instances of process in a production system have to be studied by looking at various aspects,
either the interrelations between the instances must be investigated. The objects of the production system
simulation modeling include:
Physical topology of the plant (type of component
arrangements, plant parameters as throughput rates and resulting bottle-neck locations, etc.);
Component types and parameters (throughput
capacity, working conditions);
Component and plant failure behavior (intensity
of component degradation over time, wear and failure mechanisms, etc.);
Maintenance strategy and parameters (e.g.
intervals of periodic actions, time between major line revisions, availability of resources);
Organizational aspects of production, supporting
services and information work-flow;
Financial aspects of operation and downtimes;
Aspects of ecological, social and legislative
environment
Due to the nature of these instances of the process may be
different (e.g. the physical topology of the production line and the information flow of maintenance orders considered
in this research), there may be several groups of output indicators collected in order to evaluate the effectiveness of the system from different point of views.
reliability and availability of a production line,
throughput yield, loading and efficiency. These measures are often combined in the Overall equipment effectiveness (OEE) and Total Effective Equipment Performance (TEEP) metrics which are commonly used as a key
performance indicator of how effectively a manufacturing operation is utilized:
(1) 𝑂𝐸𝐸 = 𝐴𝑣𝑎𝑖𝑙𝑎𝑏𝑖𝑙𝑖𝑡𝑦 ∗ 𝑃𝑒𝑟𝑓𝑜𝑟𝑚𝑎𝑛𝑐𝑒 𝐸𝑓𝑓𝑖𝑐𝑖𝑒𝑛𝑐𝑦 ∗ 𝑇𝑟𝑜𝑢𝑔𝑝𝑢𝑡 𝑌𝑖𝑒𝑙𝑑
(2) 𝑇𝐸𝐸𝑃 = 𝑂𝐸𝐸 ∗ 𝐿𝑜𝑎𝑑𝑖𝑛𝑔
The other group of indicators belongs to the evaluation of
maintenance efforts and includes:
Maintenance effectiveness - a measure of the amount of
maintenance downtime required to keep equipment (or plant) operating:
(3) 𝑀𝑎𝑖𝑛𝑡. 𝐸𝑓𝑓𝑒𝑐𝑡𝑖𝑣𝑒𝑛𝑒𝑠𝑠 = 𝑂𝑝𝑒𝑟𝑎𝑡𝑖𝑛𝑔 𝑇𝑖𝑚𝑒
𝑂𝑝𝑒𝑟𝑎𝑡𝑖𝑛𝑔 𝑇𝑖𝑚𝑒 +𝐷𝑜𝑤𝑛𝑇𝑖𝑚𝑒
Maintenance efficiency - a measure of the maintenance effort required to deliver required performance levels from
equipment (or plant):
(4) 𝑀𝑎𝑖𝑛𝑡𝑒𝑛𝑎𝑛𝑐𝑒 𝐸𝑓𝑓𝑖𝑐𝑖𝑒𝑛𝑐𝑦 =𝑀𝑎𝑖𝑛𝑡𝑒𝑛𝑎𝑛𝑐𝑒 𝑑𝑎𝑦𝑠
𝑂𝑝𝑒𝑟𝑎𝑡𝑖𝑛𝑔 𝑇𝑖𝑚𝑒
Ratio of preventive maintenance work to repair - a measure of planning and scheduling process effectiveness
and its influence on breakdown maintenance: (5) 𝑅𝑎𝑡𝑖𝑜 𝑜𝑓 𝑃𝑟𝑒𝑣. 𝑡𝑜 𝑅𝑒𝑝𝑎𝑖𝑟 = 𝑃𝑟𝑒𝑣𝑒𝑛𝑡 .𝑊𝑜𝑟𝑘
𝐵𝑟𝑒𝑎𝑘𝑑𝑜𝑤𝑛 𝑊𝑜𝑟𝑘
The trade-off relationships which can be investigated in respect of assessment of the effectiveness of an applied maintenance program ultimately implies a trade-off between
the cost of performing preventive maintenance and the cost to run the equipment to failure.
III. SIMULATION DESIGN CONCEPT
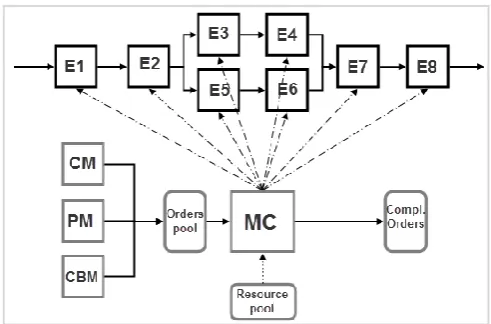
The general idea of the simulation approach is to combine two processes of different origin (the continuous production
process and the information flow of maintenance work-orders) in one model to investigate how the interaction
between the processes affect the performance of the production system, as well as to define the optimization
[image:3.595.304.550.124.286.2]opportunities. Thus a production system that contains numerous components is simulated as an integrated model of two interacting modules.
Fig. 1 Simulation design concept
Maintenance process flow simulation, if designed carefully, may replicate the flow of maintenance work
orders in an information system of a company. The module represents the application of maintenance policies and composed of the following components:
Corrective Maintenance (CM) orders issued to the system are requests for equipment repair. When such a work
order is issued, the respective machine is already stopped due to an unexpected failure and awaiting for repair activities. These orders are executed as soon as possible by
the maintenance coordination workcenter, to bring the failed equipment back to operation.
Preventive Maintenance (PM) orders entry point
contains a predefined plan (schedule) of maintenance actions for different machines and issues orders in fixed times as per the schedule. The orders are also executed by
the maintenance workcenter, which stop the respective machine and change its condition parameters back to initial values after a specific period of time defined in the order.
Condition-Based Maintenance (CBM) orders entry point represents a relatively new concept of maintenance policy, when issuing an order depends on a condition of a
Maintenance Coordinator (MC) workcentre halts respective machines (if not halted yet due to a breakdown) when pick up raised work orders and process the orders in
accordance to maintenance parameters described in them.
The MC work center is linked to the Resource Pool; therefore a maintenance action is postponed when there is a lack of resources.
Complete Orders point collect the output data about the
performed maintenance work including types of executed work orders, times of repair etc, which allows calculating Maintenance KPI and evaluation of maintenance
effectiveness.
Production Line module represents the arrangement and
topology of the system components, the process of production within declared capacities, behavior of the components degradation and failure phenomena.
Each machine in the production line has its own function, production capacity, degradation pattern and a rate of a potential failure.
Failure rate is the frequency with which an engineered system or component fails, expressed for example in failures per hour. The failure rate of a system usually depends on time, with the rate varying over the life cycle of the machine.
Equipment failure pattern is defined by the rate of a potential failure.
P(t) = 1-exp { - (t- t'/ ŋ) }, where t’ - the threshold time-to-failure, or guaranteed life; ŋ - the characteristic life. Preventive or breakdown maintenance actions restore the
maintained equipment to the initial state of the decreasing or constant failure rate.
IV. CASE STUDY
The selected tool for designing the simulation model is
SIMUL8 software package for discrete event systems simulations. A model using SIMUL8 is developed to simulate the behavior of LNG train with an expected annual
production output of 2600000 ton of LNG (2600 units in the model), which is an average rate of one LNG train in the industry. The input flow is set to 300 ton/hour (7.2 units
daily) that will load equipment up to 70 percent of capacity. The components of a simplified LNG process train and the respective Maintenance process flow are modeled in
[image:4.595.304.559.149.340.2]Simul8 for the purpose of the research as shown on the following figure.
Fig. 2 Visual structure of the simulation in Simul8
The simulation model described above is run four times
in order to collect results of various simulation scenarios as follow:
Scenario#1: Breakdown strategy Scenario#2: Preventive strategy
Scenario#3: Condition-based strategy Scenario#4: Combined PM/CBM strategy
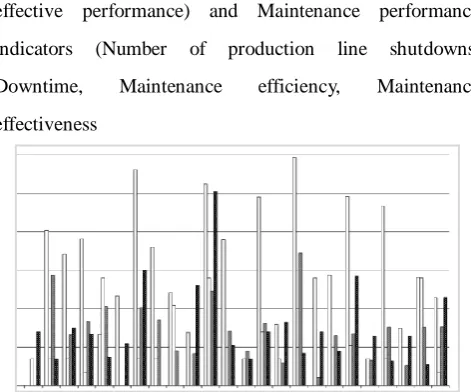
The result coefficients are grouped into two categories: Equipment and overall performance indicators (Production
output, Overall equipment effectiveness, Total equipment effective performance) and Maintenance performance indicators (Number of production line shutdowns,
Downtime, Maintenance efficiency, Maintenance effectiveness
Fig. 3 Production line downtime in different simulation
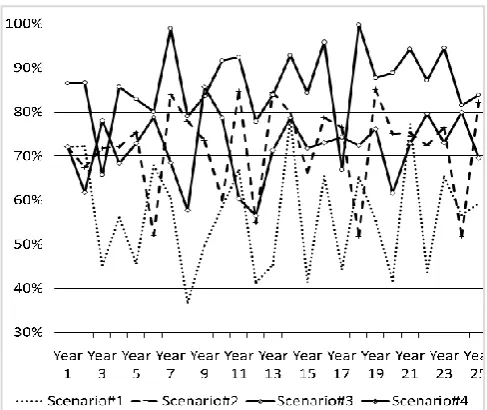
[image:4.595.308.544.559.755.2]Fig. 4 Total equipment effective performance (TEEP)
Fig. 5 Maintenance effectiveness
The scenario#1 is considered as a worst-case simulation.
All units are maintained in the Corrective manner, in spite of real requirements demanded by the case. Taking into account its„ general cost ineffectiveness and huge negative
safety and environmental impact in case of this scenario is implemented in real life, however the collected data will be the basic point of reference for the results comparison.
However the generally accepted manner of performing maintenance activities in the industry is the planned
campaigns of annual maintenance shutdowns of the production line. The scenario#2 simulates this strategy applied to the case study. This scenario also takes a
possibility of random equipment failures into account, yet
the schedule of shutdowns composed for the purpose of preventing all possible failures at heavy cost of over-maintenance if necessary, therefore there is no
corrective work expected to occur.
The scenario#3 simulates the Condition-based
maintenance strategy implemented to perform the routine maintenance activities. This strategy is expected to reduce the over-maintenance work, therefore increase production
rate and equipment performance indicators.
The Scenario#4 represents a combined strategy of mixed Preventive and Condition-Based maintenance actions. The
schedule of preventive tasks is adjusted to avoid over-maintenance in this case, thus the maintenance
downtime is reduced and the overall performance of the production line increases
V. CONCLUSIONS
The proposed approach aims to leverage the conventional techniques of production system analysis to introduce an open and extensible framework of methods for investigating
different maintenance strategies and plant modification options.
The results of experiments show that combined strategies
customized according to the requirements of the different plant segments devote more attention critical components
while avoiding costly over-care where not appropriate. The research does not aim to answer all the questions of increasing plant performance indicators by better
maintenance or deliver a new concept of applicable maintenance strategies and fault monitoring schemes, but it provides a demonstration of a way to enhance conventional
analysis methods and generate new models which improve the production system performance analysis.
The designed simulation model describes a behavior of a simplified production system, which can be extended in future to obtain more realistic values of maintenance and
[image:5.595.50.288.312.489.2]maintenance resources, which are highly critical for estimating the real costs of maintenance strategies.
REFERENCES
[1] J. Ashayeri, A. Teelen: “A Production and Maintenance planning
model for the Process Industry”, Department of Econometrics Tilburg
University, The Netherlands 1996
[2] J.H. Bullock: “Maintenance Planning and Control”, National
Association of Accountants, New York, NY. 1979
[3] R.E.M. Deenen, C.E. van Daalen, E.G.C. Koene: “Maintenance
performance improvement with System Dynamics”, Delft University
of Technology, Netherlands, 1999
[4] R. Dekker: “Applications of maintenance optimization models: a
review and analysis”, Erasmus University, Rotterdam, The
Netherlands 1996
[5] S. Fabricius: “Modeling and Simulation for Plant Performability
Assessment with Application to Maintenance in the Process Industry”,
Swiss Federal Institute of Technology, 2003
[6] B. R. Haverkort, I. Niemegeers: “Performability modeling tools and
techniques”, University of Twente, Netherlands 1996
[7] “Reliability Centered Maintenance Guide for Facilities and Collateral
Equipment”, Aeronautics and Space Administration, Washington, D.C.,
2000
[8] N. Rezga; X. Xiea; Y. Matia: ”Joint optimization of preventive
maintenance and inventory control in a production line using
simulation”, Université de Metz, France, 2001
[9] J. Shalliker, C. Ricketts: “An Introduction to SIMUL8 Release Nine”,
School of Mathematics & Statistics, University of Plymouth, 2002
[10]L. Swanson: “Linking maintenance strategies to performance”,
Department of Management, Southern Illinois University
Edwardsville, Edwardsville, 2000
[11]Takafumi: “Advanced maintenance system of LNG receiving terminal
for low cost operation and high reliability by RBM and RBQC”, 23rd