Churn Analysis of Online Social Network Users
Using Data Mining Techniques
Xi Long
†, Wenjing Yin, Le An, Haiying Ni, Lixian Huang, Qi Luo, and Yan Chen
Abstract—A churn is defined as the loss of a user in an online social network (OSN). Detecting and analyzing user churn at an early stage helps to provide timely delivery of retention solutions (e.g., interventions, customized services, and better user interfaces) that are useful for preventing users from churning. In this paper we develop a prediction model based on a clustering scheme to analyze the potential churn of users. In the experiment, we test our approach on a real-name OSN which contains data from 77,448 users. A set of 24 attributes is extracted from the data. A decision tree classifier is used to predict churn and non-churn users of the future month. In addition, k-means algorithm is employed to cluster the actual churn users into different groups with different online social networking behaviors. Results show that the churn and non-churn prediction accuracies of∼65% and∼77% are achieved respectively. Furthermore, the actual churn users are grouped into five clusters with distinguished OSN activities and some suggestions of retaining these users are provided.
Index Terms—Online social network, churn prediction, user clustering, retention solution.
I. INTRODUCTION
W
ED-BASED online social network (OSN) sites have large beneficial effects on people’s social communi-cations through internet [1], [2]. Many OSNs (e.g., Facebook, LinkedIn, and MySpace), which provide various services to meet different user needs, are emerging and growing rapidly with easier and better interactive experience [3]. A large number of netizens register their personal accounts at OSN sites with social communities in order to extend their social relationships in local, national or worldwide ranges by connecting with others. Such connections between individuals are usually based on their manifest or latent relationships fashioned by their self-disclosed information such as personal profiles, locations, and interests [4]. Up to now, more than a hundred OSNs have been launched and many of them focus on providing local services to users in their own countries with mother-tongue-only in-terfaces by means of their inherent advantages in the as-pects of local culture, daily lifestyle, online/offline behav-ior, communication habit, and so on [5]. For example, inManuscript received December 08, 2011. This work was supported by Customer Research and User Experience Design Center (CDC), Tencent Inc., China.
†X. Long was a User Researcher in CDC, Tencent Inc., High-Tech Park,
Shenzhen, 518057, China. He is now a PhD candidate in the Dept. of Electrical Engineering, Eindhoven University of Technology, Eindhoven, 5600 MB, the Netherlands (e-mail: [email protected]).
W. Yin1, H. Ni2, L. Huang3, and Q. Luo4 are Senior User Researchers
in CDC, Tencent Inc., High-Tech Park, Shenzhen, 518057, China (e-mail:
{1viviyin,2amieeni,3henryhuang,4sybil}@tencent.com).
L. An is a PhD candidate in the Dept. of Electrical Engineering, University of California, Riverside, CA92521, USA (e-mail: [email protected]).
Y. Chen is a Director in CDC, Tencent Inc., High-Tech Park, Shenzhen, 518057, China (e-mail: [email protected]).
China, the most widely-used Chinese OSNs are: Renren (renren.com), Qzone (qzone.qq.com), Weibo (weibo.com), Kaixin001 (kaixin001.com), and Pengyou (pengyou.com), who share the majority of China’s OSN market, traffic, and users [5], [6].
Many studies based on OSN users with different purposes have been achieved by using data mining techniques [7]-[9]. For an OSN service provider, the sustainable development of the OSN site mainly depends on whether it has mass users and how active they are [4]. Unfortunately, a problem has been observed that many existing users behave inactively on an OSN site or they completely leave the site. In other words, the OSN site loses users. In this paper, the loss of a user is defined as a churn. The analysis of user churn problem has been studied in many different industries such as telecommunications [10], [11], healthcare [12], financial service [13], and banking [14]. For OSN service providers, it has become increasingly important because user churn of OSN sites causes direct revenue loss [15]. Besides, recruiting a new user may cost higher than retaining an existing one in internet industry [2], [15]. Therefore, it is important for an OSN service provider to: (1) precisely and early locate the users who are at high risk of churn in the near future (i.e., the future month in this case); (2) timely prevent these users from churning by using appropriate retention solutions such as providing interventions through email, offering better services, recommending interesting contents, etc.
classifier [18] is adopted to predict the class membership. After locating the churn users, it is important to group these users into different clusters based on their different online activities so that the appropriate retention solutions can be delivered to them. For this purpose, unsupervised learning is recommended. From the practical point of view, ak-means and a hierarchical clustering algorithm are consid-ered due to the wide employment and the ease of implemen-tation. However, a hierarchical algorithm requires a quadratic computation complexity of O(N2) which is very intensive to be applied on an internet dataset with a large number of observations, while k-means algorithm only requires a computation complexity of O(N) [19]. So a k-means clus-tering algorithm is employed in this study for grouping the churn users. Furthermore, after clustering process, a “second-step” classifier can be determined based on the clustering results that serve as the “ground-truth”. This classifier aims at classifying an incoming user, who has been predicted as a churn, into one of the defined clusters. Then the most appropriate retention solution can be precisely delivered to this user. This way is more effective to motivate churn users to keep on using an OSN site because providing all registered users a similar solution fails to consider that they usually have different needs, intentions, and interests on the site.
The main contributions of this paper include: first, a large real-world dataset is collected to study the churn pattern in real application; second, a framework of churn prediction is developed; third, we cluster the churn users based on their online activities; fourth, different solutions of preventing users from churning are suggested to different clusters.
II. DATA
Pengyou (formerly Xiaoyou), literally ”friend”, is one of the famous OSN sites of China. It has been reported that Pengyou has more than a hundred million registered users [20]. Pengyou is a derivative product of an instant messag-ing (IM) client of Tencent Inc., generally referred as QQ (imqq.com), which is the most widely-used and popular IM software in China with more than a billion registered users [21]. In fact, a ”QQ-connection strategy” allows Pengyou users logging in the site using their emails or QQ accounts. It means that it allows a user automatically adding all QQ contacts in Pengyou as friends. Thus, Pengyou shares a large portion of the population of QQ users, which indicates that a user is able to access both services with a unique registered account. In addition, Pengyou has a function of so-called ”QQ synchronization”. For instance, some new feeds in Pengyou (e.g., messages, comments, statuses, and friend invitations) are allowed to, after being chosen yes to synchronize, be exported to a user via his/her QQ in the form of reminder without any delay and obstacle, and vice versa. In our experiment, the online activity data within a period of one month (i.e., October, 2008) were collected from the users on Pengyou. They were annotated to be churn or non-churn by examining login activities to the site in the future month (i.e., November, 2008). In other words, churn is the case that there is no login activity to Pengyou in the future month whereas there still is login activity in the current month. The users in such case are labeled as ”churn” while the others are labeled as “non-churn”. In this study, the online activity data from 100,000 users (i.e., instances) were
collected in anonymity (in honor of user privacy and under certain regulations) such as number of friends, total online time, login times, active days, number of blogs written, number of pictures shared, number of messages in guestbook, login times in QQ, etc. Then a large dataset was built in which various attributes (e.g., users’ statuses and login ac-tivities) can be extracted. Note that all the data are monthly-based. For instance, the number of monthly login times is computed by summing the number of daily login times of all the days in this month. Details of the attributes will be given in Section III. Here the demographic information of users like gender and age are excluded because such information may be untrue or incompletely provided by users due to their consideration of security and privacy.
In addition, after reviewing the dataset, some values of the data perform very high or low comparing with others. These outliers might be due to the system mistake when data were collected. In particular, a small portion of the values of some attributes (e.g., the number of playing online games on Pengyou) are extremely high. It is because some online game addicts used hack tools for cheating on games on this OSN site. Since including these erroneous data seriously contaminates the population and may give invalid results, the original dataset should be cleaned up. The hacker-generated outliers can be identified and then be discarded based on the rules of hacker data detection. For the rest un-hacked data, the threshold of detecting outliers is different for each attribute. A conventional three-sigma test [22] can remove the outliers lying outside the three times standard deviations of the mean of an attribute’s values. This empirical test assumes that the data under test should be normally distributed, which is suggested by using a Q-Q plot method. Thus, a clean dataset with 77,448 instances without outliers is used for training and testing of a classifier. A portion of the clean dataset with 25,170 churn instances (∼32%) is used for building a clustering model.
III. ATTRIBUTEEXTRACTION
In total, 24 attributes are extracted from the data within a month and are divided into five groups. They are in the aspects of 1) status, 2) login activity, 3) basic operation activity, 4) App (application) operation activity, and 5) IM activity. Note that the values of each attribute are normalized. A brief description of the five groups follows and the attributes are listed in Table I.
1) Status Attribute - the number of friends of a user on the OSN site indicates to what extent a user is connecting with others.
TABLE I LIST OFATTRIBUTES
Group Attribute
Status attribute number of friends number of login times number of login days
Login attributes number of active times number of active days number of total online time number of blogs written number of videos shared number of pictures uploaded
Basic operation attribute number of friend invitations sent/received number of messages in guestbook number of times of status updated number of times of events updated number of times of privacy settings edited number of times of profile updated total number of basic operations number of times of playing game 1
App operation attribute number of times of playing game 2 number of times of playing game 3 total number of App operations number of login times
IM attributes number of login days number of messages membership level
3) Basic Operation Attribute - exploring the operations of playing basic functions of the OSN site provides more details in understanding to what extent a user is attracted by these functions. Attributes can be extracted based on the operations such as number of blogs written, number of videos shared, number of pictures uploaded, number of friend invitations sent and received, number of messages in guestbook, number of times of status updated, number of times of events updated, number of privacy settings edited, number of times of personal profile updated, and the total number of these basic operations.
4) App Operation Attribute - rather than basic operation attributes, applications seem more attractive to many users due to their fun of playing. Currently, releasing application programming interfaces (APIs) to the third parties provides opportunities to a social network platform on building a more active and enjoyable environment on the site. Therefore, such applications often imply how active an OSN is. Here the number of times of playing an online game application is considered and three featured games are involved, which means three attributes are extracted. Besides, the total num-ber of times of playing these three games is also included.
5) IM Attribute - as explained in Section II, a user is allowed to log in the OSN site (i.e., Pengyou) and the IM client (i.e., QQ) by using the same username and password. So such connection and synchronization of these two plat-forms indicate that the activity of using the OSN site may highly correlate to that of using the IM client, which thus is worthwhile to be investigated. Therefore, the number of login times and the number of login days on QQ are extracted. Number of messages includes the total number of messages sent and received in that month. And membership level is proportional to the total time and activity of using QQ.
IV. TECHNICALAPPROACH
In order to provide timely and effective retention solutions to prevent users from churning in the future month, the users should be first detected before they actually churn.
A. Prediction
A DT-based classifier is adopted in this study to predict churn and non-churn users. It is a simple yet powerful method for deriving classification rules from a set of labeled instances [18]. Over many other classifiers, a DT-based classifier has advantages that, first, it can be extended to non-numeric domains where the attributes are categorical data rather than numerical data; second, a decision made from the node to the final labeling is easy to follow and interpret. It helps to understand attributes that perform as better indicators in predicting churn instances. This delivers a useful message of making a proper retention solution to prevent users from churning. However, tuning parameters of the tree such as the numbers of leaves and nodes should be careful in order to avoid over-fitting (or under-fitting) the data. A DT-based classifier is achieved by making a sequence of decisions along a path of the nodes of a constructed tree trained by the attributes of training set. In the training phase, at each node of the tree, a decision rule splits the instances into two or more partitions and new nodes are then generated. Splitting criterion is adopted according to which the best split from the set of candidates is chosen. The stopping criterion controls the growth of the tree and a node is considered to be terminal or a leaf node. Once a tree is built after training, new instances are able to be classified via making a sequence of decisions on their corresponding attributes. More details of the DT-based method can be found in [18] and [23]. Usually, overall accuracy, which is computed through dividing the number of instances by those correctly predicted, is used to measure the performance of classification. This agrees with the assumption that, during the decision making step, the same misclassification costs are assigned to all classes. However, such overall accuracy may not be a perfect criterion for classification, especially for the situation of unbalanced class distribution. For the binary classification problem in this study, a well refinement was achieved by means of receiver operating characteristic (ROC) analysis, which can adjust the global decision making threshold to be optimal [24]. It is biased to search the optimal threshold by maximizing the sum of sensitivity and specificity in plotted ROC curve, which is one of the most commonly used criteria, known as Youden’s criterion [25]. For any given threshold T, the Youden’s index is
Y = arg max
T (SE(T) +SP(T)−1) (1)
whereSE is sensitivity (i.e., true positive rate) and SP is specificity (i.e., true negative rate) in a2×2confusion matrix in a binary-class problem (see Table II).
B. Clustering
TABLE II
CONFUSIONMATRIX OF ATWO-CLASSPROBLEM
Predicted churn Predicted non-churn Actually churn True Positive False Negative Actually non-churn False Positive True Negative
are rejected in the learning process because including these misclassified instances may lead to bad performance of a clustering model.
In this study, a k-means clustering algorithm [26] is used. The main purpose of k-means algorithm is to define
k centroids, one for each cluster. The number of clusters
k is known a priori and the centroids are estimated by means of iterative refinement process. In the beginning, k
points are randomly chosen as the initial points to create k
clusters, which are partitioned by associating those points with nearest means in the corresponding clusters. Then the cluster means become the new centroids. Such processes are repeated until dynamic centroids reach convergence, which means the locations of thekcentroids have no more changes. The final centroids of thekclusters are then determined. Here given a set of observations x1, x2, . . . , xn, where each of
them is a user’s attribute vector withmdimensions. Herenis the number of instances in the dataset andmis the number of extracted attributes. The k-means algorithm partitions then
instances intokgroupsG=G1, G2, . . . , Gk by minimizing
the following function within clusters:
J = arg min k X
j=1 n X
i=1
kx(ij)−cjk2. (2)
where cj is the mean of points in cluster j denoted as the
cluster center,kx(ij)−cjk2is the square of Euclidean distance
between a data point and the cluster centercj.
Once the centroids of clusters are defined, a new incoming user is classified by selecting the minimal Euclidean distance between this sample and the previously defined centroids. The question then is that how to select the number of clusters
k (0 ≤ k ≤ n). Here we use a selection method based on clustering results [27], where an objective evaluation measure is employed to select the number of k. The measure is calculated as a distortion function DF(k) that converges to a constant value whenkincreases. The minimum ofDF(k)
is suggested where k should be regarded as the number of clusters. The distortion function DF(k)is given by:
DF(k) =
1, if k= 1 Dk
αkDk−1, if Dk−16= 0,∀k >1
1, if Dk−1= 0,∀k >1
(3)
wherek is the number of clusters,Dk is called the sum of
all distortions. The distortion of clusterj is the square sum of all the distances between within-cluster data points and the cluster center in this cluster.Dk is computed as follow:
Dk = k X
j=1 nj
X
l=1
hxj,l, cji2 (4)
where hxj,l, cji2 is the distance between the lth data point
xj,l and the center cj of cluster j, and nj means the
number of data points within cluster j. Besides, αk is a
weight factor that equals to 1−0.75d when k = 2 and
αk−1+ (1−αk−1)/6 whenk >2, heredis the number of
attribute dimensions in the dataset. The evaluation function aims at selecting optimalkby minimizing the sum of within-cluster distortions.
V. RESULTS ANDDISCUSSION
As observed from the annotation obtained in the future month, the number of churn users takes∼32% in the clean dataset. A 10-fold cross validation was used in the experi-ments. Fig. 1 shows the ROC space of the prediction perfor-mance by using a DT classifier, where the optimal searched result is marked based on the sweep of a decision making threshold in terms of Youden’s criterion. By applying ROC optimization in the classification, the Youden’s index reached 0.42 with an obvious improvement of ∼0.06 compared to the original result. Table III shows an increase of 16.6% in sensitivity (i.e., churn prediction accuracy) and a comparably less decrease of 10.8% in specificity (i.e., non-churn predic-tion accuracy), even there is a slightly decrease in overall accuracy. Among all the extracted attributes, the one number of friends achieved the strongest capability in discriminating with churn and non-churn users on Pengyou. Some other classifiers (e.g.,k-nearest-neighbors, na¨ıve Bayes) have also been examined, but they offered no significant improvement compared with a DT-based classifier.
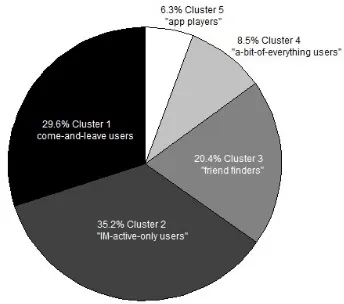
As discussed in Section II, 25,170 users’ data in the clean dataset were taken into account for building a clustering model. Fig. 2 shows that the number of the clusterskis pre-selected to be 5 as the best one based on the clustering perfor-mances by sweeping thekfrom 1 to 20. In practice, selecting a larger k makes no sense that is considered to be over-fitting the clustering model. It also complicates interpreting the reasons of user churn and delivering retention solutions to more than 20 clusters. Fig. 3 indicates the distribution of the five distinguished churn clusters. In terms of the OSN activities of the churn users on Pengyou in the past month, some details of the five clusters are given in the Table IV, where five most representative attributes are visualized for comparison between the average of all the churn users and the average of the churn users belonging to a specific cluster. Hence, relative difference ratio (RDR) is measured for such comparison. Followings are the explanations the five churn clusters with different online activities.
• Cluster 1 (“come-and-leave users”) - Approximately 30% of the churn users are observed in this cluster who generally behaved inactively. They did not have many friends in the community. They were with less logins both on Pengyou and QQ and were below average in both basic and App operations in the past month. A reason might be that such users registered Pengyou accounts by accident but they could not find any interesting things before they left. Thus this cluster of users can be named by “come-and-leave users”.
Fig. 1. Prediction performance using a DT classifier in the ROC space. The optimal result, represented by the circle marker, is searched based on Youden’s criterion. The dotted line represents the classes with no discrimination as a random guess.
TABLE III
COMPARISON OFPREDICTIONPERFORMANCE
Original Results Optimal Result (without ROC) (with ROC)
Sensitivity 48.5% 65.1%
Specificity 87.6% 76.8%
Overall accuracy 74.9% 73.0%
Youden’index 0.36 0.42
•Cluster 3 (“friend finders”) - Friend finders usually focus on seeking their old friends or making new friends through an open social network. They can realize that an OSN site offers them a more convenient approach where they are able to connect with others for socializing on internet. However, they churned eventually even they have many friends at hand and are interested in interacting with their friends. It might be due to that their friends were not the ones as expected or these friends were not active on the site. Another explanation is that these users only collected friends rather to communicate with them. “friend finders” takes ∼20% of the total churn users.
• Cluster 4 (“a-bit-of-everything users”) - It is noticed that a cluster of churn users (∼9%) behaved active in basic operations as well as in logging in Pengyou. They did not often play OSN Apps or games, but preferred to use around the typical OSN functions such as sharing contents, writing blogs, updating status, uploading pictures, and etc. However, this cluster of users left the site after all, which might result from that the basic functions were not sufficient to make them stay in the network for a longer time. In other words, they could only realize this is a “website” rather than a “network”. • Cluster 5 (“App players”) - There are around 6% of the churn users who were only fascinated in playing OSN-based game applications. They were completely attracted by games rather than any other functions or social activities. Hence, these users might leave the site in case of feeling jaded or bored of a game because of the “life-cycle limit” of an online game/App for players.
[image:5.595.344.516.241.393.2]The OSN activities are qualitatively summarized in Table V with the denoted levels of “high”, “moderate”, and “low”. Actually, in the clustering process, the attributes can be weighted. The weights usually depend on the preferences
Fig. 2. Evaluation ofDF(k)by sweepingkfrom 1 to 20 forkselection.
Fig. 3. Distribution of the five churn clusters.
[image:5.595.68.266.302.365.2]TABLE IV
THERELATIVEDIFFERENCERATIOS(RDRS)OF THEFIVEREPRESENTATIVEATTRIBUTES OF THECHURNUSERS IN THEFIVECLUSTERS
Number of Number of Total number of Total number of Number of friends OSN login times basic operations App operations IM login times
Cluster 1 (“come-and-leave users”) -0.5 -0.4 -0.3 -0.5 -0.6
Cluster 2 (“IM-active-only users”) -0.5 -0.2 -0.3 -0.7 0.6
Cluster 3 (“friend finders”) 1.5 -0.5 0.0 -0.8 -0.2
Cluster 4 (“a-bit-of-everything users”) 0.1 0.6 2.0 -0.4 -0.1
Cluster 5 (“App players”) -0.2 4.6 0.1 10.2 0.2
TABLE V
QUALITATIVESUMMARY OFCHURNUSERS’ OSN ACTIVITIES WITHDENOTEDLEVELS“HIGH”, “MODERATE”,AND“LOW”
Status Login Basic operation App operation IM (nr. of friends) activity activity activity activity Cluster 1 (“come-and-leave users”) Low Low Moderate Low Low Cluster 2 (“IM-active-only users”) Low Moderate Moderate Low High Cluster 3 (“friend finders”) High Low Moderate Low Moderate Cluster 4 (“a-bit-of-everything users”) Moderate High High Low Moderate Cluster 5 (“App players”) Moderate High Moderate High Moderate
VI. CONCLUSION
In this paper, we propose an approach to reveal the churn pattern of the OSN users using data mining techniques. We collected a large clean dataset of 77,448 users from one of the largest OSN sites in China, called Pengyou. A DT-based and ak-means algorithms allow us to process large amount of data in a timely manner. The experiment shows that ∼77% non-churn users and∼65% churn users are correctly predicted in terms of Youden’s criterion rather than overall accuracy. In addition, a clustering model is built based on the 25,170 actual churn users, which are grouped into five clusters by using ak-means clustering algorithm. The churn users of each cluster are analyzed and some suggestions of retention solutions are provided to prevent them from churning. In other words, by analyzing the known online activities of users in the current month, they are first detected to be churn or non-churn users of the future month and then are classified into one of the five clusters if they are likely to churn. Consequently the most appropriate retention actions can reach them in an early stage.
REFERENCES
[1] D. M. Boyd and N. B. Ellison, “Social network sites: definition, his-tory, and scholarship,”Journal of Computer-Mediated Communication, vol. 13, no. 1, pp. 1-19, 2007.
[2] E. Hargittai, “Whose space? Differences among users and non-users of social network sites,”Journal of Computer-Mediated Communication, vol. 13, no. 1, pp. 276-297, 2007.
[3] W. Duan, “Special issue on online communities and social network: an editorial introduction,”Decision Support Systems, vol. 47, pp. 167-168, 2007.
[4] Y. Jia, Y. Zhao, and Y. Lin, “Effects of system characteristics on users’ self-disclosure in social networking sites,” in: 7th Int. Conf. Information Technology, 2010, pp. 529-533.
[5] Alexa Web Information Company. Available: http://www.alexa.com. [6] K. Lukoff, “China’s top 15 social networks,”TechRice, 2011.
Avail-able: http://techrice.com/2011/03/08/chinas-top-15-social-networks. [7] L. Guo,et al., “Analyzing patterns of user Content generation in online
social networks,” in:Proc. 15th Int. Conf. ACM SIGKDD, 2009, pp. 369-378.
[8] D. Jensen and J. Neville,Data mining in social networks - Dynamic Social Network Modelling and Analysis: Workshop Summary and Papers, National Academy of Science Press, pp. 289-302, 2003. [9] R. Baden,et al., “Persona: an online social network with user-defined
privacy,” in:Proc. ACM SIGCOMM, 2009.
[10] J. Lu, “Predicting customer churn in the telecommunications industry - an application of survival analysis modeling using SAS?,” in:Online Int. Proc. of SAS User Group, 2002, paper 114-27.
[11] S. Y. Hung, D. C. Yen, and H. Y. Wang, “Applying data mining to telecom churn management,”Expert Systems with Applications, vol. 31, no. 3, pp. 515-524, 2006.
[12] M. Pijl, et al., “Prediction of successful participation in a lifestyle activity program using data mining techniques,” in:21st Benelux Conf. Artificial Intelligence,, 2009.
[13] J. Burez and D. Van den Poel, “Separating financial from commercial customer churn: A modeling step towards resolving the conflict between the sales and credit department,”Expert Systems with Ap-plications, vol. 35, no. 1-2, pp. 497-514, 2008.
[14] Y. Xie,et al., “Customer churn prediction using improved balanced random forests,”Expert Systems with Applications, vol. 36, no. 3, pp. 5445-5449, 2009.
[15] M. Karnstedt,et al., “Part I: Social media analysis and organization -churn in social networks,” it Handbook of Social Network Technolo-gies and Applications, Springer, pp. 185-222, 2010.
[16] J. Ferreira, et al., “Data mining techniques on the evaluation of wireless churn,” in: European Sym. Artificial Neural Networks, pp. 483-488, 2004.
[17] W. H. Au, K. C. C. Chan, and X. Yao, “A novel evolutionary data mining algorithm with applications to churn prediction,”IEEE Trans. Evolutionary Computation, vol. 7, no. 6, pp. 532-545, 2003. [18] J. R. Quinlan, “Induction of decision trees,”Machine Learning, vol.
1, pp. 81-106, 1986.
[19] E. Keogh and J. Lin, “Clustering of time-series subsequences is mean-ingless: implications for previous and future research,”Knowledge and Information Systems, vol. 8, no. 2, pp. 154-177, 2005.
[20] S. Ye, “Pengyou: Tencent’s latest real name social network,”
TechRice, 2011. Available: http://techrice.com/2011/01/05/Pengyou-tencents-latest-real-name-social-network.
[21] Tencent Inc. official website. Available: http://www.tencent.com/en-us/at/roadmap.shtml.
[22] D. Ruan, G. Chen, E. E. Kerre, and G. Wets (eds.), “Intelligent data mining: techniques and applications,”Studies in Computational Intelligence, Springer, vol. 5, pp. 318, 2005.
[23] S. Theodoridis and K. Koutroumbas.Pattern Recognition(2nd ed.), Elsevier Academic Press, 2003.
[24] J. Huang and C. X. Ling, “Using AUC and accuracy in evaluating learning algorithms,”IEEE Trans. Knowledge and Data Engineering, vol. 17, pp. 299-310, 2005.
[25] W. J. Youden, “Index for rating diagnostic tests,”Cancer, vol. 3, pp. 32-35, 1950.
[26] J. B. MacQueen, “Some methods for classification and analysis of multivariate observations,” in:Proc. 5th Berkeley Sym. Mathematical Statistics and Probability, University of California Press, vol. 1, pp. 281-297, 1967.