Effect of Irregularity on the Response Reduction
Factor for RC Building
Shreyas Barad1, Akash Jivani 2
1
MTech-Structure Student, 2Asst professor, Department of Civil engineering, DIET, Gujarat Technological University, Gujarat, India
Abstract: Most current seismic design includes the nonlinear response of a structure through a response reduction factor (R). This allows the designer to use a linear elastic force-based approach while accounting for nonlinear behavior. In fact, the response reduction factor is used in modern seismic codes to scale down the elastic response of a structure. This study focuses on estimating the actual ‘R’ value for reinforced concrete (RC) buildings. The ductility and over strength of representative RC buildings are investigated. Nonlinear pushover analysis is performed on structural models in order to evaluate the seismic performance of buildings. Different irregular building with variety of characteristics are selected and studied. Furthermore, the effects of over strength on the ductility factor is examined. Finally, the results obtained in form of Time period, base shear, displacement, drift etc. are further analyzed and compared with different structural parameters of the buildings.
Keywords: Static Nonlinear Pushover Analysis, Regular and Irregular Structure, Elevation Irregularity.
I. INTRODUCTION
In reality, many existing buildings contain irregularity, and some of them have been designed initially to be irregular to fulfil different functions e.g. basements for commercial purposes created by eliminating central columns. Also, reduction of the size of beams and columns in the upper storeys to fulfil functional requirements and for other commercial purposes like storing heavy mechanical appliances, etc. This difference in usage of a specific floor with respect to the adjacent floors results in irregular distributions of mass, stiffness, and strength along with the building height. In addition, many other buildings are accidentally rendered irregular due to a variety of reasons like non-uniformity in construction practices and material used. The building can have irregular distributions of mass, strength, and stiffness along with the plan also. In such a case it can be said that the building has a horizontal irregularity
Encounters during past seismic occasions have exhibited that common customary techniques for building structure and development need creating protection from parallel powers when all is said in done and quake powers specifically. That is the reason the idea of quake safe plan approached to improve the conduct of structure during horizontal burdens. The essential methodology of tremor safe plan ought to be to expand the sidelong quality, deformability and pliability limit of structure with restricted harm however no breakdown (Agarwal et al., 2010). This can be accomplished by planning and enumerating structure to get satisfactory durability and flexibility. This will prompt withstand the seismic tremor of any estimate and type, which is probably going to understanding during its lifetime.
II. MATERIALS AND METHODS A. Computational Model
In the present study, finite element method-based software SAP2000 has been used to model reinforced concrete ductile frames. The frame is designed as per provision of I.S 456:2000, I.S 875:1987, I.S:1893(Part 1) and I.S 13920:1993. The building frame is with 5 bays each direction and 6 storey and 9 storey with storey height 3 m and bay width 4 m located in seismic zone V in India on medium soil type. The analysis is done in two different story of 6 story and 9 story building. Mainly ten models are created for particular each building. Among them, one is a symmetrical model with no irregularity in elevation and the other nine models are created having different irregularities in elevation. A total of twenty models are taken for the study. Models are named as T0 for the model without any irregularity and irregular models are named T1, T2, T3, T4, T5, T6, T7, T8, and T9.
Two types of irregularity are considered in this study.
One is sudden irregularity: T1- 20%, T2- 40%, T5- 26.6%, T7- 50%, T8- 53.3%
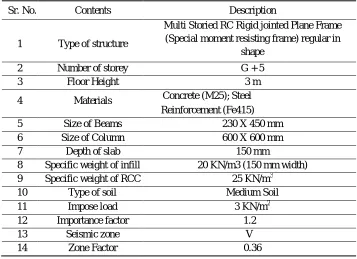
[image:2.612.127.484.268.527.2]Second is gradual irregularity: T3- 23%, T4- 43%, T6- 46.6%, T9- 56.6% and preliminary design consideration is tabulated in Table 1.
Table 1. Description of the modelled building used for the study
Sr. No. Contents Description
1 Type of structure
Multi Storied RC Rigid jointed Plane Frame (Special moment resisting frame) regular in
shape
2 Number of storey G + 5
3 Floor Height 3 m
4 Materials Concrete (M25); Steel Reinforcement (Fe415)
5 Size of Beams 230 X 450 mm
6 Size of Column 600 X 600 mm
7 Depth of slab 150 mm
8 Specific weight of infill 20 KN/m3 (150 mm width) 9 Specific weight of RCC 25 KN/m3
10 Type of soil Medium Soil
11 Impose load 3 KN/m2
12 Importance factor 1.2
13 Seismic zone V
14 Zone Factor 0.36
The examination thinks about two sorts of casing models; Irregular structures and ordinary structure. To approve the product created consequences of customary structure outline, those are contrasted and that of ordinary structure as given in IS 1893(Part 1). According to IS 1893 (Part 1). A structure is characterized to be sporadic if the proportion of one of the amounts (such as mass, stiffness or strength) between adjacent stories exceeds a minimum prescribed value. However, in the recent version of IS 1893 (Part 1) irregular configuration of buildings has been defined explicitly. Five kinds of vertical abnormality have been recorded. They are: vertical geometric abnormality, re-participant corner inconsistency, firmness anomaly (delicate story), in-plane intermittence in parallel power opposing vertical components, and brokenness in limit. In this investigation we center around vertical anomalies. A normal building is the one which have four traits like: straightforward and ordinary setup, sufficient parallel quality, firmness and flexibility. Structures having basic ordinary geometry and consistently dispersed mass and firmness in design just as in height, endure substantially less harm than structures with sporadic setups (FEMA, 1995; FEMA, 2004). The model casings on which the investigations made may include: normal strengthened bond solid structure, vertically unpredictable structure.
B. 6 Storey models
6T0 6T1 6T2
6T3 6T4
6T5 6T6 6T7
6T8 6T9
C. 9 Storey Models
9T3 9T4
9T5 9T6 9T7
9T8 9T9
D. Pushover Analysis
The idea of a sucker examination can be used for evaluating the dynamic needs forced on a structure by seismic tremor ground movements and the likely areas of the disappointment zones in a structure can be discovered by watching the sort of pivot arrangements. The quality limit of the feeble zones in the post-flexible range would then be able to be expanded by retrofitting. Nonlinear static weakling examinations of the three study outlines are performed. For this investigation nonlinear plastic pivots have been relegated to the entirety of the essential components. First-minute pivots (M3-pivots) have been appointed to pillar components and afterward hub minute 2-moment3 pivots (PMM-pivots) have been doled out to segment components.
In the examination, the range from the base to Center of gravity of holder is 18m and henceforth the objective dislodging is set to 72 mm. The relocation is applied bit by bit to the structure in a gradual way. The base shear and rooftop uprooting are recorded at each progression. Because of the arrangement evenness of the structure, the weakling investigation is completed in X bearing as it were. Henceforth, quake heaps of tank full conditions are provided in X-guidance as it were.
E. Performance-based Analysis
The cutting-edge approach of execution-based building offers a balanced plan structure for settling on plan choices by surveying the suitable dangers and meeting different execution targets of the built offices that are exposed to normal perils. Execution based seismic plan and appraisal rules for new structures and different structures have been proposed by a few FEMA programs (FEMA-350; FEMA-P695; FEMA-P752). With the scale and multifaceted nature of current tall structures, the seismic presentation-based plan requires broad computational assets and exertion. Execution based structure advancement is a mix of cutting edge.
F. Analytical Calculation of Design base Shear
The concept of a push over-analysis can be utilized for estimating the dynamic needs imposed on a structure by earthquake ground motions and the probable locations of the failure zones in a building can be ascertained by observing the type of hinge formations. The strength capacity of the weak zones in the post-elastic range can then be increased by retrofitting. Being the basic step of pushover analysis, the base shear is calculated as per the codal provisions and compared it with software values for regular RCC building. Further base shear for rest irregular buildings is obtained. The total design lateral force or design base shear along any principal direction shall be determined by the following equation 1, Clause 7.5 of IS 1893(Par1):2002
Vb = Ah W [1]
W = Seismic weight of building Z = Zone factor
I = Importance factor
R= Response Reduction Factor
G. Response Reduction Factor
Response reduction is used to scale down the elastic response of the structure. This factor is unique and different for a different type of structures and materials used.
The structure is allowed to be damaged in case of severe shaking. Hence, the structure is designed for seismic force much less than what is expected under strong shaking if the structure were to remain linearly elastic.
As stated earlier, the Response reduction factor is the most important factor for the seismic design of the structure. The response reduction factor takes into account the nonlinearity of structure and reduces the elastic response of the structure. As per global standard codes such as ATC-40, FEMA 273 this factor has been defined as a function of ductility factor, Strength factor, redundancy factor, and damping factor.
R = Rs * Rμ * RR …………. (1.1) Where, Rs is strength factor, Rμ is ductility factor and RR is Redundancy Factor. Rs Strength factor:
The maximum lateral strength of building (Vu) will generally exceed the design lateral strength (Vd) of the building because the members or elements are designed with capacities substantially greater than design actions and material strength also exceed specified nominal strengths. Thus, the strength factor or over-strength factor is defined as the ratio of ultimate base shear to design base shear.
Rs = vu/vd
H. Ductility Factor(Rμ)
The ductility factor is a measure of global Nonlinear (whole structure) response of the framing system and not the component of that system. It is measured as the ratio of ultimate or maximum base shear to base shear corresponding to yield (Ve). The ductility factor
shows the response of the structure in terms of its plastic deformation capacity. It depends upon the ductility level (μ) and the time
period of the system.
I. Redundancy Factor (RR)
The redundancy factor RR is a measure of redundancy in a lateral load resisting system. In RC structures, the moment-resisting frames, shear walls or their combinations are the most preferred lateral load resisting systems. Sometimes, the central frames are only designed for gravity loads and the perimeter frames are designed as the lateral load resisting systems.
J. Analysis of Result
Storey drift of ten models of 6 storey Storey drift of ten models of 9 storey
K. Final R Calculation
Model V0 Vd delta
Y
6 T0 8839.46 2485.89 51.25
6 T1 8460.46 2115.11 44.26
6 T2 6633.49 1559.10 63.91
6 T3 8431.34 2341.90 55.05
6 T4 6749.24 2045.15 59.48
6 T5 8460.46 2473.6 55.20
6 T6 6640.94 2200.2 54.98
6 T7 5437.34 1327.55 91.20
6 T8 5485.32 1250.36 84.45
6 T9 5404.29 1173.18 78.39
Time period
Rs Ru R
1.4 3.56 1.40 4.9
1.3 4.00 1.20 4.8
1.3 4.25 1.10 4.6
1.2 3.60 1.30 4.7
1.2 3.30 1.20 3.9
1.3 3.42 1.30 4.7
1.2 3.02 1.40 4.2
1.3 4.10 0.72 2.9
1.2 4.39 0.79 3
1.2 4.61 0.87 3.6
0 1 2 3 4 5 6 7
0 0.001 0.002 0.003 0.004
St
o
ry
Displacement
6 Stoery
6 T0 6 T1 6 T2 6 T3 6 T4
6 T5 6 T6 6 T7 6 T8 6 T9
0 1 2 3 4 5 6 7 8 9 10
0 0.001 0.002 0.003 0.004
St
o
ry
Displacement
9 storey
9 T0 9 T1 9 T2 9 T3 9 T4
III. CONCLUSION
The 9 storey models (height – 27mt) show significant relation between irregularity and response reduction factor and are inversely proportional. The results indicate that, the R factor is also dependent on the abruptness of the irregularity, but no clear
proportionality can be concluded. This is shown by comparison of models (9T1, 9T3 and 9T5) and (9T2, 9T4 and 9T6) However, the same is not true for the 6 storey models, where no clear proportion can be observed.
It can be concluded that the strength of the structure (height 27mt and above) goes on decrease as increase in height of the structure when more than 40% irregularity is induced in the structure which is abrupt nature and is not gradual.
REFERENCES
Books and Codes
[1] ATC-40, “Seismic evaluation and retrofit concrete buildings”, Vol. 1 & 2, Report No. SSC 96-01, Seismic Safety Commission, Redwood City, CA 1996. [2] FEMA 356-2000, “Pre-standard and Commentary for the Seismic Rehabilitation of Buildings, Federal Emergency Management Agency”, Washington D.C. [3] IS: 1893(Part I) - 2002, “Criteria for Earthquake Resistant Design of Structure, General Provisions and Buildings”, Bureau of Indian Standard, New Delhi. [4] CSI, SAP2000, integrated finite element analysis and design of structures basic analysis reference manual. Berkeley (ca, USA): computers and structures mc,
2006.
[5] IS 456 (2000): Plain and Reinforced Concrete - Code of Practice
Research Paper
[1] Performance based evolution of response reduction factor of ductile structure [2] Apurva Mondal a, Siddhartha Ghosh, G.R. Reddy (sept2013)
[3] C.V.R. Murty, Rupen Goswami, A.R. Vijay Narayan, Vipul V. Mehta, Some Concepts in Earthquake Behavior of Buildings Gujarat State Disaster Management Authority September 2012
[4] Evaluation and comparison of response reduction factor (R-Value) by pushover analysis and response spectrum analysis of irregular buildings. L.R. Wankhede1, Prateek Nikose2 (April 2018)
[5] A study on the effect of mass irregularity on seismic response of RC structures, Mr. Chandrakanth Rama Naik, Mr. R.S Chikkangoudar (August 2018) [6] Performance based evolution of response reduction factor of ductile structure
[7] Apurva Mondal a, Siddhartha Ghosh, G.R. Reddy (sept2013)Murty, Rupen Goswami, A.R. Vijay Narayan,Vipul V. [8] Mehta, Some Concepts in Earthquake Behavior of Buildings Gujarat State Disaster Management Authority September 2012
[9] Evaluation and comparison of response reduction factor (R-Value) by pushover analysis and response spectrum analysis of irregular buildings. L.R. Wankhede1, Prateek Nikose2 (April 2018)
[10] A study on the effect of mass irregularity on seismic response of RC structures, Mr. Chandrakanth Rama Naik, Mr. R.S Chikkangoudar (August 2018) [11] Provisions for Seismic Regulations for New Buildings, Washington, DC.
[12] Lai SP and Biggs JM (1980). Inelastic Response Spectra for Aseismic Building Design. Journal of Structural Engineering. 106: 1295-1310.
[13] MagarPatil HR and Jangid RS (2015a). Numerical study of seismic performance of steel moment resisting frame with buckling restrained brace and viscous fluid damper. IES Journal Part A: Civil and Structural Engineering, 8: 165-174.
[14] MagarPatil H R and Jangid RS (2015b). Development and analysis of passive energy dissipation system for steel moment resisting frame. International Journal of Civil and Structural Engineering, 5: 339-352.
DECLARATIONS Author’s contribution
Mr. Shreyas barad has done a complete analysis and drawn conclusions according to the results. He wrote the manuscript submitted to this journal.
Model V0 Vd
9 T0 10038.61 3137.06 9 T1 8824.11 2999.39 9 T2 6801.90 2304.75 9 T3 9853.26 2936.20 9 T4 7754.01 2241.55 9 T5 9867.85 2859.02 9 T6 6864.18 2164.37 9 T7 4940.15 1841.65 9 T8 5431.16 1778.46 9 T9 4934.08 1701.27
delta Y Time period
Rs Ru R
94.6 2.3 3.20 1.30 4.3 85.92 2.1 2.94 1.30 3.5 119.51 2.1 2.95 0.90 2.6 94.59 1.9 3.36 1.10 3.6 111.54 2.0 3.46 0.97 3.0 92.9 1.9 3.45 1.17 3.7 102.54 1.9 3.17 1.05 3.2 141.79 2.2 2.68 0.74 2.1 117.95 2.1 3.05