Abstract—The influence of cutter geometry and cutting
parameters during end milling on the surface texture of aluminium (Al) alloy 5083 was experimentally investigated. Eighteen pockets were manufactured having different combination of parameters values according to Taguchi L18 standard orthogonal array. Surface texture parameters (Ra, Ry, and Rz) were measured on three different passes on side surface of pockets and analyzed using statistical techniques. The results reveal that the cutting speed, the peripheral 2nd relief angle, and the core diameter have significant effect in surface texture parameters. In order to establish a relationship between the performance measures and the process parameters, a set of additive models was produced. Finally, an evaluation (verification) experiment was performed. The acquired experimental values were found to be inside the confidence intervals provided by the additive models. These results confirm the accuracy of the proposed modeling approach.
Index Terms—End mill cutters, process optimization,
surface roughness
I. INTRODUCTION
L alloy 5083 has excellent resistance to corrosion and it is used in the manufacture of unfired, welded pressure vessels, marine, auto aircraft cryogenics, drilling rigs, TV towers, transportation equipment, and in missile components. Although no specific machinability data were existed the Al alloy 5083 is machinable by conventional means (turning, milling, drilling and grinding).
The machinability of an engineering material denotes its adaptability to machining processes in view of factors such as cutting forces, tool wear and surface roughness. Specifically, surface roughness plays an important role on the product quality and it is a parameter of great importance in the evaluation of machining accuracy [1, 2]. The surface roughness of parts produced by material removal processes
Manuscript received March 4, 2011; revised April 6, 2011.
J. D. Kechagias is with the Department of Mechanical Engineering, Technological Educational Institute of Larissa, Larissa, 41110 Greece (phone: 0030-2410-684322; fax: 0030-2410-684322; e-mail:
C. K. Ziogas is with the Department of Mechanical Engineering, Technological Educational Institute of Larissa, Larissa, 41110 Greece (e-mail: [email protected]).
M. K. Pappas is with the Department of Mechanical Engineering, Technological Educational Institute of Larissa, Larissa, 41110 Greece (e-mail: [email protected]).
I. E. Ntziantzias is with the Department of Mechanical Engineering, University of Thessaly, Volos, 38334 Greece (e-mail: [email protected]).
is affected by various factors such as material properties, tool geometry, and cutting parameters [3]. Thus parameter design for a material is useful in order to have best performance and consequently decrease the quality loss of a process [4].
A number of attempts, which study surface quality during end milling, have been reported in the literature, e.g. [5-7]. Most of these studies refer to specific cutting conditions (tool-workpiece material, and cutting tool geometry).
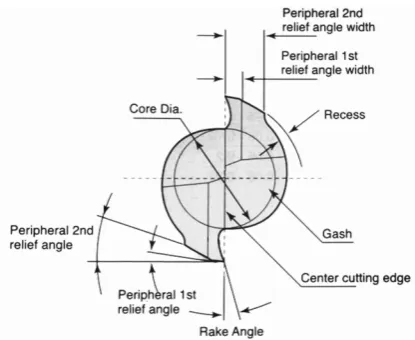
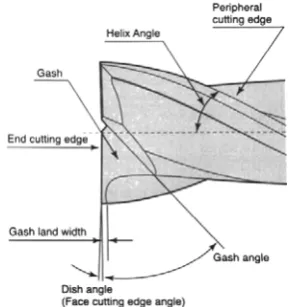
The current research work investigates the effects of the process parameters during end milling of Al alloy 5083 on the surface texture parameters (arithmetical mean roughness, Ra; maximum peak, Ry; and ten-point mean roughness, Rz). The proposed approach combines the Taguchi design of experiments and statistical analysis of the results. Two-flute end cutters were used (Fig. 1-2). The process parameters tested are: A, core diameter (%); B, flute angle (o); C, rake angle (o); D, peripheral 1st relief angle (o); E, peripheral 2nd relief angle (o); F, depth of cut (mm); G, cutting speed (rpm); and H, tool feed (mm/flute). Finally, optimal values of the process parameters were derived inside the experimental region, and the optimum end cutter was manufactured and tested using a validation experiment.
Parameter Optimization during Finish End
Milling of Al Alloy 5083 using Robust Design
John D. Kechagias, Christos K. Ziogas, Menelaos K. Pappas, Ioannis E. Ntziatzias
[image:1.595.323.531.481.651.2]A
II. DESIGN OF EXPERIMENT
End milling pockets were performed on a DECKEL MAHO DMU 50V-monoBLOCK 5-axis universal machining center. Max power of the machine tool is 18.9KW, and max spindle speed is 14,000rpm.
The two flute carbide end mill cutters were manufactured using the five axis Hawemat 2001 grinding machine (Fig. 3).
According to the number of the selected parameters and their levels, the standard orthogonal array L18 (21x37) [4] was used (Table I). In this method, the main parameters, which are assumed to have an influence on process results, are located at different rows in a designed orthogonal array, and the results can be analyzed using analysis of means and analysis of variances in a similar way as a full factorial design was conducted [8].
The geometry parameters values of each one of the eighteen two-flute end mill cutters are shown in the columns A to E of Table I. All of the eighteen carbide cutters have diameter of 8mm. The cutting parameters values during eighteen pockets are shown in the columns F to H of Table I.
Based on robust design, the standard orthogonal array L18 (21x37) has been selected in order to perform the matrix experiment. The core diameter (A), which is measured as a percentage of the end mill cutter diameter, was selected to have two values, while the others (B-H) were selected to have tree values each (Table I). According to the L18 orthogonal array 18 experiments were performed with each
experiment producing a pocket which was tested for side surface roughness (Fig. 4).
The surface texture parameters studied in the present work are: the arithmetic mean roughness Ra (μm), the maximum peak Ry (μm), and ten point mean roughness Rz (μm). For these parameters lower values are desirable. These S/N ratios in the Taguchi method are called as the smaller-the-better characteristics and are defined as follows (η, dB):
) ( log
10 10 i
i R
(1)
Each one of the eighteen end mill cutters cut a pocket of 100x64mm and 15mm in depth upon the two faces of an aluminium 5083 plate of 500x280mm and 60mm in depth. The cutting parameters values for each pocket are depicted in the columns F, G, and H of Table I.
Finally, surface roughness (Ra, Ry, and Rz) were measured vertically on the face of the pockets using a RUGOserf tester (Fig. 4).
TABLE I
PARAMETERS DESIGN ACCORDING TO L18 (21X37) ORTHOGONAL ARRAY AND PERFORMANCE MEASURES
ID A B C D E F G H 1 48 38 18 20 25 0.5 5000 0.05 2 48 38 20 22 28 1 6000 0.08 3 48 38 22 25 30 1.5 7000 0.1 4 48 45 18 20 28 1 7000 0.1 5 48 45 20 22 30 1.5 5000 0.05 6 48 45 22 25 25 0.5 6000 0.08 7 48 50 18 22 25 1.5 6000 0.1 8 48 50 20 25 28 0.5 7000 0.05 9 48 50 22 20 30 1 5000 0.08 10 50 38 18 25 30 1 6000 0.05 11 50 38 20 20 25 1.5 7000 0.08 12 50 38 22 22 28 0.5 5000 0.1 13 50 45 18 22 30 0.5 7000 0.08 14 50 45 20 25 25 1 5000 0.1 15 50 45 22 20 28 1.5 6000 0.05 16 50 50 18 25 28 1.5 5000 0.08 17 50 50 20 20 30 0.5 6000 0.1 18 50 50 22 22 25 1 7000 0.05
TABLE I [CONTINUE]
PARAMETERS DESIGN ACCORDING TO L18 (21X37) ORTHOGONAL ARRAY AND PERFORMANCE MEASURES
ID Ra (μm) η(Ra) Ry (μm) η(Ry) Rz (μm) η(Rz)
1 0.08 10.79 0.93 0.30 0.73 1.35
2 0.17 7.70 1.27 -1.03 1.17 -0.67
3 0.18 7.53 1.30 -1.14 1.07 -0.28
4 1.66 -2.20 5.73 -7.58 6.83 -8.35 5 0.12 9.33 1.47 -1.66 0.90 0.46
6 0.19 7.29 2.10 -3.22 1.13 -0.54
7 0.22 6.58 1.80 -2.55 1.27 -1.03
8 1.33 -1.23 12.13 -10.84 7.10 -8.51
9 0.19 7.21 1.27 -1.03 1.27 -1.03
[image:2.595.96.242.51.205.2]10 0.13 8.97 1.20 -0.79 0.93 0.30 11 0.19 7.29 1.47 -1.66 1.23 -0.91 12 0.17 7.70 1.27 -1.03 1.10 -0.41 13 0.11 9.46 1.03 -0.14 1.10 -0.41 14 0.13 8.86 1.27 -1.03 1.03 -0.14 15 0.14 8.54 0.77 1.15 0.70 1.55 16 0.22 6.58 1.37 -1.36 1.10 -0.41 17 0.15 8.14 1.20 -0.79 0.97 0.15 18 0.16 7.87 1.37 -1.36 0.90 0.46 Mean 0.307 7.02 2.163 -1.99 1.696 -1.02 Fig. 3. Grinding process.
[image:2.595.67.269.358.513.2]III. ANALYSIS OF RESULTS
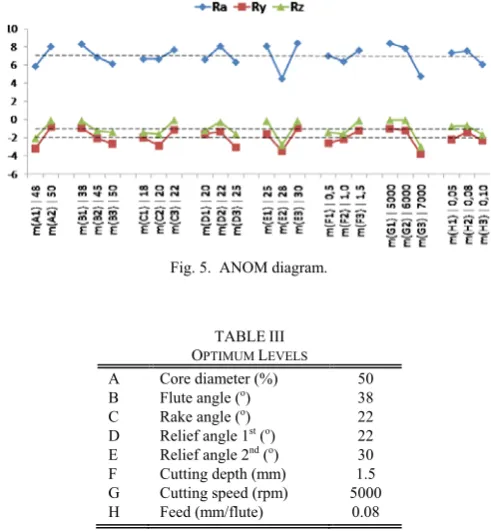
For each process parameter A to H (Table I, [4]), the average surface roughness was calculated (Ra, Ry, and Rz; Table II). Based on these average values, one can have Analysis of Means (ANOM) diagrams (Fig. 5) indicating the impact of each factor level on the side surface roughness is produced. Thus, based on the ANOM, one can derive the optimum combination of process variables, with respect to surface roughness. The optimum level for a factor is the level that gives the higher value of the objective function ηRi inside the experimental region. Table III shows the optimum levels of the process parameters.
According to robust design, the interaction between two or more parameters can be classified as: (i) no interaction, (ii) synergistic interaction, and (iii) antisynergistic interaction. Fig. 6 shows the interaction type between the cutting speed and peripheral relief angle 2nd. It can be seen that when the peripheral relief angle 2nd is increased from 25 to 28 or 30 (o) the corresponding response of R
[image:3.595.48.287.51.229.2]a varies in relation to the level of cutting speed (rpm). Thus, it can be concluded that there is an “antisynergistic interaction” between the two parameters. The same conclusions can be obtained from Fig. 7 and 8 about the interaction type between the cutting speed and core diameter, as well as between the peripheral relief angle 2nd and core diameter.
Fig. 6. Interaction charts between cutting speed and relief angle 2nd. TABLE III
OPTIMUM LEVELS A Core diameter (%) 50
B Flute angle (o) 38
C Rake angle (o) 22
D Relief angle 1st (o) 22 E Relief angle 2nd (o) 30 F Cutting depth (mm) 1.5
G Cutting speed (rpm) 5000
[image:3.595.302.548.52.318.2]H Feed (mm/flute) 0.08
Fig. 5. ANOM diagram.
TABLE II [CONTINUE] MEANS OF PARAMETER LEVELS
Rz
Level 1 2 3 mAi A -2.07 -0.09 mBi B -0.10 -1.24 -1.37 mCi C -1.43 -1.61 -0.04 mDi D -1.21 -0.27 -1.60 mEi E -0.14 -2.80 -0.14 mFi F -1.40 -1.57 -0.10 mGi G -0.03 -0.04 -3.00 mHi H -0.73 -0.66 -1.68
TABLE II
MEANS OF PARAMETER LEVELS
Ra Ry
Level 1 2 3 1 2 3
mAi A 5.89 8.06 -3.20 -0.80
mBi B 8.33 6.88 6.17 -0.89 -2.08 -2.66 mCi C 6.70 6.68 7.69 -2.02 -2.84 -1.10 mDi D 6.63 8.10 6.33 -1.60 -1.29 -3.06 mEi E 8.11 4.51 8.44 -1.59 -3.45 -0.93 mFi F 7.02 6.40 7.64 -2.62 -2.14 -1.20 mGi G 8.41 7.87 4.79 -0.97 -1.21 -3.79 mHi H 7.38 7.59 6.10 -2.20 -1.41 -2.35
[image:3.595.310.553.510.668.2]Also, using analysis of variances approach (Table IV, [4], [8]), the impact factor of each process parameter onto the surface texture parameters revealed.
According to the statistical analysis; Ra, Ry, and Rz are affected significantly by the cutting speed (G, 23.9; 21.2; and 26.5 percent), peripheral 2nd relief angle (E, 29.7; 14.8; and 21.4 percent), and core diameter (A, 11.1; 18.6, and 13.3 percent). The effect of the other process parameters can be attributed to error as they have a negligible impact on the quality indicators inside the experimental region; F factors are less than one [4, 9].
The variance of the effect of each factor level for this case is [4]:
16 . 4 49 . 12 3 1 ) ( 3
1
a e R
(2)
75 . 2 27 . 8 3 1 ) ( 3
1
y e R
(3)
78 . 2 35 . 8 3 1 ) ( 3 1
e Rz (4)
Thus, the width of the two standard deviation confidence intervals, which is approximately 95% of the confidence interval for each estimated effect, is:
1 . 4 16 . 4 2 )
(Ra
e (5)
22 . 3 75 . 2 2 )
(Ry
e (6)
34 . 3 78 . 2 2 )
(Rz
e (7)
In order to establish a relationship between the performance measure (η) and the process parameters, one can derive the additive model of the form:
) ( ) ( ) ( ) ( ) ( ) ( ) ( ) ( ) ( ) ( ) ( ) ( a a a a a a a a a R R R Gq R R Ej R R Ai R R e m m m m m m m
(8)
[image:4.595.47.297.49.211.2]) ( ) ( ) ( ) ( ) ( ) ( ) ( ) ( ) ( ) ( ) ( ) ( y y y y y y y y y R R R Gq R R Ej R R Ai R R e m m m m m m m (9) ) ( ) ( ) ( ) ( ) ( ) ( ) ( ) ( ) ( ) ( ) ( ) ( z z z z z z z z z R R R Gq R R Ej R R Ai R R e m m m m m m m (10) whereas:
[image:4.595.50.296.234.394.2]Fig. 8. Interaction charts between relief angle 2nd and core diameter. Fig. 7. Interaction charts between cutting speed and core diameter.
TABLE IV [CONTINUE] ANOVA ANALYSIS
Rz
DOF SS MS F %
A 1 17.7 17.
7 2.
1 13.
3
B 2 6.1 3.0 0.3 4.6
C 2 8.8 4.4 0.5 6.6
D 2 5.6 2.8 0.3 4.2
E 2 28.4 14.2 1.7 21.4
F 2 7.7 3.8 0.4 5.8
G 2 35.1 17.6 2.1 26.5
H 2 3.8 1.9 0.2 2.9
Total 17 132. 3 Pulle
d error 12
[image:4.595.41.283.466.673.2]100. 2 8.35
TABLE IV ANOVA ANALYSIS
Ra Ry
DOF SS MS F % SS MS F % A 1 21.3 21.3 1.7 11.1 25.7 25.7 3.1 18.6
B 2 14.7 7.4 0.5 7.7 10.0 5.0 0.6 7.2
C 2 4.0 2.0 0.
1 2.1 9.0 4.5
0. 5 6.5
D 2 10.8 5.4 0.4 5.6 10.7 5.3 0.6 7.7
E 2 56.7 28.5 2.2 29.7 20.5 10.2 1.2 14.8
F 2 4.6 2.3 0.
1 2.4 6.2 3.1
0. 3 4.5 G 2 45.9 22.9 1.8 23.9 29.4 14.7 1.7 21.2
H 2 7.8 3.9 0.3 4.1 3.1 1.5 0.1 2.2
Total 17 191.8 138.3
Pulled error 12
149. 9
12.4
9 99.3
8.2 7
η(Ra), η(Ry), η(Rz): is the Objective Function (OF) corresponds to Ra, Ry and Rz
m: is the overall mean
mAi: is the mean of the OF where factor A (Core diameter) having the level i (i=1,2)
mBi: is the mean of the OF where factor E (Relief angle 2nd) having the level j (j=1,2,3)
mGq: is the mean of the OF where factor G (Cutting speed) having the level q (q=1,2,3) For example the prediction of the performance of the combination [(A2, E3, G3) = (350, 30, 7000)] is:
dB e m m m m m m m a a a a a a a a a a R R R R G R R E R R A R R 1 . 4 24 . 7 1 . 4 ) 02 . 7 79 . 4 ( ) 02 . 7 44 . 8 ( ) 02 . 7 06 . 8 ( 02 . 7 ) ( ) ( ) ( ) ( 3 , 3 , 2 ) ( ) ( ) ( 3 ) ( ) ( 3 ) ( ) ( 2 ) ( ) ( 3 , 3 , 2 (11) dB e m m m m m m m y y y y y y y y y y R R R R G R R E R R A R R 22 . 3 54 . 1 22 . 3 ) 99 . 1 79 . 3 ( ) 99 . 1 93 . 0 ( ) 99 . 1 80 . 0 ( 99 . 1 ) ( ) ( ) ( ) ( 3 , 3 , 2 ) ( ) ( ) ( 3 ) ( ) ( 3 ) ( ) ( 2 ) ( ) ( 3 , 3 , 2 (12) dB e m m m m m m m z z z z z z z z z z R R R R G R R E R R A R R 34 . 3 17 . 1 34 . 3 ) 02 . 1 00 . 3 ( ) 02 . 1 14 . 0 ( ) 02 . 1 09 . 0 ( 02 . 1 ) ( ) ( ) ( ) ( 3 , 3 , 2 ) ( ) ( ) ( 3 ) ( ) ( 3 ) ( ) ( 2 ) ( ) ( 3 , 3 , 2 (13)
An evaluation (verification) experiment was performed (Ra=0.3, Ry=3.4, Rz=2.1) and the experimental values of
η2,3,3(Ra), η2,3,3(Ry), η2,3,3(Rz) were found to be as follows: η2,3,3(Ra) = 5.22,η2,3,3(Ry) = -3.97 andη2,3,3(Rz) = -3.22 These experimental values are inside the confidence intervals of the results occurred by the additive models (11), (12) and (13). These results confirm the accuracy of the proposed modeling approach.
IV. CONCLUSION
The arithmetical mean roughness (Ra), maximum peak (Ry), and ten-point mean roughness (Rz) have been selected as quality indicators for end milling of Al 5083 multi-parameter investigation using design of experiments and statistical analysis. The experimental limits were designed in order for all the combinations suggested in the orthogonal array to be able to be conducted. This means that if a combination could not be conducted the orthogonality would be lost and the conclusions would be unbalanced.
The experimental results show that the cutting speed (rpm), the peripheral relief angle 2nd (o), and the core diameters (%) are the most important parameters that affect the surface texture indicators, having F factors close to or higher than 2. All the rest process parameters used in this study had a negligible effect (i.e. F <0.6) on the surface texture parameters, making them less significant [4].
In addition, the trend lines of the surface roughness indicators (Ra, Ry and Rz) have similar directions when process parameters values change from one level to another (ANOM diagram, Fig. 5). This result shows a correlation
between these indicators. Another conclusion that is coming out from this study is that the surface texture parameters are increased while the cutting speed is increased. However, this conclusion is not in accordance with the machining theory [10, 11].
On the other hand, Fig. 6 shows that once the relief angle 2nd takes its optimum value (30o) the surface roughness decreases while the cutting speed increases. The same happens once the core diameter takes its optimum value (50%, Fig. 7). These results are in accordance with the cutting theory.
Finally, multi-parameter investigation of the process according to other quality indicators such as tool wear, cutting forces, dimensional accuracy, surface residual stresses, and machined surface hardness will be studied and analyzed in future work.
ACKNOWLEDGMENT
The Authors are grateful to Konstantinos Tsoupos and Stergios Maropoulos for their help with experiment preparation and the SPACESONIC Greek Firm which provided the equipment and the material.
REFERENCES
[1] F. Mata, G. Petropoulos and J. P. Davim, “A surface roughness analysis in turning of polyamide PA-6 using statistical techniques,”
International Journal of Materials & Product Technology, vol. 37,
no. 1/2, 2010, pp. 173–187.
[2] J. Kechagias, G. Petropoulos, V. Iakovakis, S. Maropoulos, “An investigation of surface texture parameters during turning of a reinforced polymer composite using design of experiments and analysis,” Int. J. Experimental Design and Process Optimisation, vol. 1, no.2/3, 2009, pp. 164–177.
[3] M. Pappas, J. Kechagias, V. Iakovakis, S. Maropoulos, “Surface roughness modelling and optimization in CNC end milling using Taguchi design and Neural Networks,” in Proc. 3rd International
Conference on Agents and Artificial Intelligence (ICAART 2011),
Rome, Italy, Jan. 2011, pp. 595–598.
[4] M. S. Phadke, Quality Engineering using Robust Design, Prentice-Hall, Englewood Cliffs, NJ., 1989.
[5] N. S. K. Reddy, S. Kwang-Sup, and M. Yang, “Experimental study of surface integrity during end milling of Al/SiC particulate metal– matrix composites,” J. Mater. Process. Tech., vol. 201, 2008, pp. 574–579.
[6] A. R. Alao, and M. Konneh, “A response surface methodology based approach to machining processes: modelling and quality of the models,” Int. J. Experimental Design and Process Optimisation, vol. 1 no. 2/3, 2009, pp. 240–261.
[7] Z. T. Tang, Z. Q. Liu, Y. Z. Pan, Y. Wan, and X. Ai, “The influence of tool flank wear on residual stresses induced by milling aluminum alloy,” J. Mater. Process. Tech., vol. 209, 2009, pp. 4502–4508. [8] G. E. P. Box, W. G. Hunter, J. S. Hunter, Statistics for Experimenters,
Wiley, New York, NY, 1978.
[9] J. Kechagias, M. Billis, and S. Maropoulos, “A parameter design of CNC plasma-arc cutting process using robust design,” Int. J.
Experimental Design and Process Optimisation, vol. 1, no. 4, 2010,
pp.315–326.
[10] P. G. Benardos, G. C. Vosniakos, “Prediction of surface roughness in CNC face milling using neural networks and Taguchi's design of experiments,” Robotics and Computer-Integrated Manufacturing, vol. 18, no. 5-6, 2002, pp.343-354.
[11] P. Munoz-Escalona, P. Maropoulos, “Integrated optimisation of surface roughness and tool performance when face milling 416 SS,”
International Journal of Computer Integrated Manufacturing, vol. 23,
![TABLE IV [CONTINUE]](https://thumb-us.123doks.com/thumbv2/123dok_us/1288909.657898/4.595.41.283.466.673/table-iv-continue.webp)