Abstract— A hybrid gas sensor based on infrared absorption has been developed for indoor air quality monitoring. The sensor is used to measure the concentration of carbon dioxide (CO2) and
carbon monoxide (CO) to 1 part per million (ppm) level in indoor environment. Photoresistor PbSe was used as a sensor in order to measure two gases at the spectrum absorption band of 4.3 µm and 4.6 µm due to CO2 and CO molecules in the air respectively.
The infrared lights are emitted by two light emitting diodes (LEDs). These light sources are much smaller, high speed, with low power consumption and does not need optical filters. The design of the prototype sensor system and results are presented in this work.
Index Terms—Gas sensor, infrared absorption, IAQ, LED, photodetector.
I. INTRODUCTION
ndoor air is the air that we breathe in indoor environment such as at homes, offices, hospitals, etc. Based on a study, people spend most 90% of their time indoors where they are exposed to far greater air pollution risks than at the outdoors [1]. The importance of indoor air quality (IAQ) in Malaysia is recognized by the Department of occupational safety and health (DOSH), who released a revised set of a Code of practice on Indoor Air Quality in July 2005, through the Ministry of Human Resources Malaysia [2]. In recent years, there has been an increasing interest in developing IAQ monitoring system for detecting and measuring indoor air pollutants based on infrared absorption in mid infrared region. However, most of the developed system can only measure one type of gas concentration [3, 4]. The previous developed systems employed thermal source as an infrared emitter [5-7] and there are disadvantages of using this type of source [8, 9]. It also employed detector which need an optical filters in order to achieve selective detection of the target gases [6, 10]. This
Marianah Masrie and Ramli Adnan are with the Department of Instrumentation & Control Faculty of Electrical Engineering, Universiti Teknologi MARA, Malaysia (corresponding author to provide phone: 603-55436073; fax: 603-55435077; e-mail: marianah@ salam.uitm.edu.my).
Anuar Ahmad is with the Faculty of Engineering, Universiti Industri Selangor, Malaysia. (e-mail: dranuar@unisel.edu.my).
system utilizes mid infrared LED which provides light source emitted at 4.3 µm and 4.6 µm due to CO2 and CO molecules
in the air. This light source is much smaller, high speed, with low power consumption and does not need optical filters [11]. A photoresistor is used to measure CO2 and CO, while a
photodiode is used to provide a reference measurement. Apart from that, the system can measure relative humidity and temperature.
[image:1.595.306.549.336.488.2]II.SYSTEM ARCHITECTURE
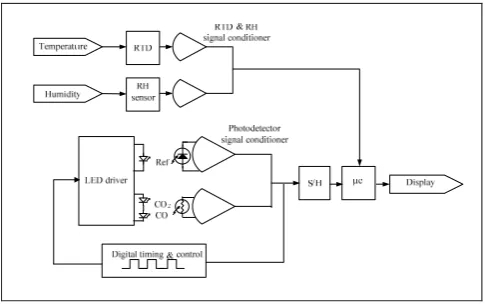
Fig. 1. Overview of hardware development and software integration
Fig. 1 shows the overview of hardware development and software integration of hybrid gas sensor system for indoor air quality. It consists of mid infrared LEDs as infrared light source which was driven by LED driver. The digital timing and control circuit generates three quasi continuous wave signals (quasi-CW) in three sequences to control the LED driver. It also generates three wave signals in quarter phase of the signals driven the LEDs to be fed to the sample and hold circuitry. The light signals emitted from the LEDs with modulation frequency of 1 kHz are travelled along in a chamber in which the infrared light interacts with gas molecules; CO2 and CO in the air. The infrared lights
absorbed by the gas molecules are detected by two photodetectors. The signals are conditioned before being fed to the sample and hold. Apart from that, a humidity sensor
A Hybrid Gas Sensor based on Infrared Absorption
for Indoor Air Quality Monitoring
Marianah Masrie, Ramli Adnan and Anuar Ahmad
(RH) with integrated precision resistance temperature detector (RTD) is also included for humidity and temperature measurement in the system. PIC16F877A is used as a microcontroller for the data acquisition and provides liquid crystal display (LCD) control functions to operate the display.
A. Infrared Light Emitter
The LED driver circuit of Fig. 1 employed three mid-infrared LEDs: LED 38 (LED reference); LED 43 (CO2) and
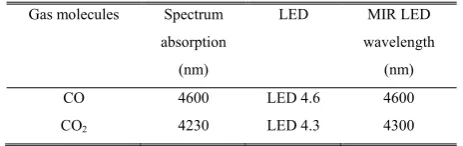
[image:2.595.52.284.289.362.2]LED 46 (CO) as the light sources. Table I shows the gas molecules spectrum absorption band in mid infrared region and the respective LEDs.
TABLE 1
GASMOLECULESANDITSEQUIVALENTSPECTRUMABSORPTION
WAVELENGTH
Gas molecules Spectrum
absorption (nm)
LED MIR LED
wavelength (nm)
CO 4600 LED 4.6 4600
CO2 4230 LED 4.3 4300
The LED driver was designed to operate the LEDs with 150 mA DC current. The 150 mA DC current was obtained using LM358 op-amp 2N2222A bipolar junction transistor (BJT) with the quasi-CW from the digital timing and control as the input voltage. The modulation frequency of 1 kHz was chosen and therefore, LED 43 and 46 were pulsed ON for 250 µs at duty cycle 25 % while LED 38 for 125 µs at duty cycle 12.5%. The LEDs were pulsed OFF for 125 µs at duty cycle 12.5%.
A.Photodetector Signal Conditioner
The emitted infrared light from the LEDs were detected by two photodetectors: infrared light emitted from LED 38 was detected by photodiode PD 36 with wavelength of 3.6 µm; while the infrared light from LED 43 and LED 46 were detected by photoresistor PR 43 with peak wavelength of 4.3 µm. The signal conditioning circuit was designed to convert the detected light from the photodetectors to voltages. This voltage is proportional to the intensity of the received light. The signal conditioning circuit for the photodiode is divided into three stages: pre-amplification; amplification; and zero and span. The photoresistor has two stages: pre-amplification; and zero and span. The pre-amplification for the photodiode is current to voltage converter while for the photoresistor is voltage to voltage converter.
The circuits were also designed to reject noise at the pre-amp stage that associated with op-pre-amps and photodetector itself. The noise that normally interfered with the signals are zero frequency (DC) component due to sources like sunlight, 120 Hz due to ambient light such as incandescent lamp and flicker noise, f1 . The technique to reject zero frequency components is by measuring the signal of the background level when all LEDs are pulsed OFF. The background signal was subtracted from the measured signal when LED was pulsed ON, therefore, the difference signal value enhanced the spectrum absorption. The 120 Hz ambient light can be removed by employing high-pass filter in the signal conditioner circuit and low-pass filter was used to attenuate any high frequency noise picked up in the amplifier. The flicker noise, f1 was appeared below frequencies of few Hz in this sensor due to imperfection in manufacturing process of the component. In order to reduce this noise, the sensor was shielded with grounded metal plate. This method prevents the electromagnetic radiation from inducing noise into the internal circuitry. The design of the analog filtering was based on simulation results that were done using MATLAB Simulink. From the simulation, the values of resistors and capacitors of the filters can be selected based on the optimum gain obtained from the simulation results.
B. Software Integration
The microcontroller was operated as it programmed by capturing analog data from signal conditioner, performing analog to digital conversion, data processing and displaying the results through display panel. Two algorithms were designed for the microcontroller in order to acquire the analog data from the gas sensor and relative humidity sensor. Both of the programs consist of main program which has subroutines for each of the analog output of the sensors. The analog outputs are, CO2, CO, background, reference signals which is
captured from photodetector signal conditioner. The other analog outputs are from relative humidity signal conditioner. To enhance the spectrum absorption, the background signal is subtracted from the signals of CO2, CO and reference. The
Bg f Re
Bg Meas ion Concentrat Gas
(1)
C. Humidity Sensors
HIH-3602-C sensor from Honeywell has internally two independent circuits to measure humidity and temperature [12]. The humidity sensor has integrated signal conditioning with the output voltage typically spans from 0.8V to 3.9V for the 0% and 100% relative humidity (RH) range at 25C. However, the signals are conditioned from 0V to 2.5V for PIC input signals requirement. The temperature sensor comprise with 1000 Ω platinum resistor (RTD), and is mounted in a Wheatstone bridge with three 1K resistors. T he signal output of the bridge is amplified with gain of 11dB.
III. RESULTS AND DISCUSSION
A. LED Response
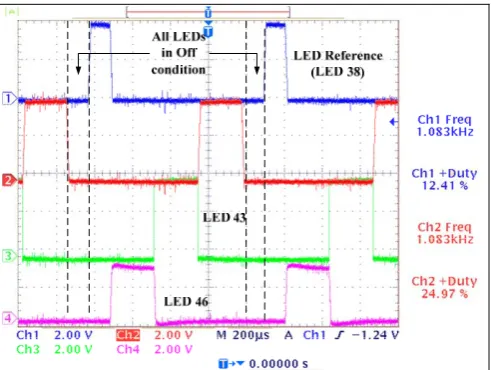
[image:3.595.307.554.372.476.2]The LED reference (LED 38) was designed to have an ON time of 125 µs and OFF time of 875 µs with 12.5% duty cycle. The quasi-CW for the LED reference at channel 1 is 1.083 kHz and duty cycle of 12.41% as shown in Fig. 2. The quasi-CW at channel 1 was divided into half for all LEDs in Off condition to provide background measurement as highlighted in Fig. 2. LED 43 and LED 46 were designed to operate with ON time of 250 µs and OFF time of 750 µs with 25 % duty cycle. As can be observed from Fig. 2 the quasi-CW at 3 and 4 are assigned for, LED 43 and LED 46. The frequency is 1.083 kHz and the duty cycle is 24.97 %.
Fig. 2 Frequency and timing diagram
B. Prototype Sensor Response
The performances of the developed system were evaluated using gas chamber with normal ambient air. The sensor was tested using CO2 Water Plant Disposable Can for CO2
evaluation and exposing the sensor to cigarette smoke for CO evaluation. In the experiment, the suction fan is used to draw the gas into the chamber and the remaining gas in the chamber is cleared up using exhaust fan.
Fig. 3 shows the experimental results on CO2 voltage
variation from sample and hold. The voltage variation between the ambient air and the presence of CO2 gas is given
in Fig. 3(a). It can be seen that the output voltage is approximately constant until the chamber is filled up with CO2
gas. Once the gas was trapped in the chamber, the molecules absorbed the respective infrared light based on the spectrum absorption wavelength. Strong evidence of CO2 concentration
exist as the outputs voltage decreased. The voltage received by photoresistor PR 43 is inversely proportional to the gas concentration in the chamber. As the CO2 concentration
increases, the intensity of light reaching the detector decreases due to gas absorption. The voltage reduction can be seen clearly in Fig. 3(b).
0.00 0.50 1.00 1.50 2.00 2.50 3.00 3.50
1002 1005 1006 1011 1017 1020 1030 1033 1040 1046 1050 1104 1116 1123 1127 1131 1134 1537 Time (Hr)
Vo
(
V) CO2
ref bg
(a) Voltage variation between ambient air and CO2 gas presence
0.00 0.50 1.00 1.50 2.00 2.50 3.00 3.50
1002 1003 1004 1005 1005 1005 1006 1007 1009 1011
Time (Hour:Minute)
Vo
(
V) CO2
ref bg
[image:3.595.46.292.477.662.2](b) Decreasing voltage due to increasing in CO2 concentration
Fig. 3 Experimental results on CO2 voltage response from sample and hold
[image:3.595.303.552.504.602.2]done with the chamber exposed to cigarette smoke. The output voltages were decreased with higher concentration of CO which can be seen in Fig. 4(b). This result gives strong evidence for the presence of higher CO concentrations.
0.00 0.20 0.40 0.60 0.80 1.00 1.20 1.40 1.60 1.80 2.00
1002 1005 1006 1011 1017 1020 1030 1033 1040 1046 1050 1104 1116 1123 1127 1131 1134 1537 Time (Hr)
Vo
(
V) CO
ref bg
(a) Voltage variation between ambient air and CO gas presence
0.00 0.50 1.00 1.50 2.00
1130 1131 1132 1133 1134 1135 1534 1537 1538 1545
Time (Hour:Minute)
Vo
(V
) CO
ref bg
Vo is decreased
due to cigarette smoke injected in the chamber
(b) Decreasing voltage due to increasing in CO concentration
Fig .4 Experimental results on CO voltage response from sample and hold
The reference (Ref) output voltage shown in the given figures remained constant since CO2, and CO molecules are
not absorbing infrared light at these wavelengths.
C.Prototype sensor performance
In order for the prototype sensor system to have correct measurement of the tested gases, calibration was done by comparing the prototype sensor to those commercial standards CO2 and CO gas detector. The developed software is able to
convert the gas concentration ratio that given by (1) to digital values. These values are free from noise since the measurement values had been subtracted from the background value of 200 mV. The calibration was done at ambient air at 23 ºC for all type of gas measurements.
Table II and III show the comparative measurements between the prototype sensor and the commercial detectors for CO2 and CO concentration. The concentration range of CO2
was approximately from 260 to 275 ppm at 23ºC as given in Table II. The maximum accuracy is 0.05 ppm and the minimum accuracy is 0 ppm. For CO measurement, constant values were obtained which measured by the prototype sensor
as the reference sensor measurement values are not constant. The comparative measurements can be seen in Table III. However, these values are in the range of measurement that is made by standard instruments. The maximum and minimum accuracy for CO are 0.71 and 0 ppm.
TABLE II CO2 CONCENTRATION
Prototype (ppm) Reference (ppm) Accuracy (ppm)
263 250 0.05
263 251 0.05
263 252 0.04
273 261 0.05
273 262 0.04
263 262 0.00
263 263 0.00
263 265 0.01
273 266 0.03
263 267 0.01
273 273 0.00
273 274 0.00
TABLE III CO CONCENTRATION
Prototype (ppm) Reference (ppm) Accuracy (ppm)
0.2 0.2 0.00
0.2 0.7 0.71
0.2 0.2 0.00
0.2 0.7 0.71
0.2 0.2 0.00
0.2 0.2 0.00
0.2 0.2 0.00
0.2 0.2 0.00
0.2 0.2 0.00
0.2 0.2 0.00
IV. CONCLUSION
measurement based on infrared absorption for measuring CO2 and CO has developed and tested. The output of the
sensor has shown some convincing response to the relative CO2 and CO concentration. A low-cost microcontroller
was employed; it was able to manipulate the gas concentration by converting the signal into a digital display reading. This prototype stage of integrated IAQ measurement system has demonstrated that it can measure the concentration of CO2 and CO gas with a very high
resolution due to the high signal amplification used.
ACKNOWLEDGMENT
The authors acknowledge Intensification of Research in Prioruty Areas (IRPA) grant (project code:50043) for the funding, RMI and Faculty of Electrical Engineering, Universiti Teknologi MARA where the research was conducted.
REFERENCES
[1] K. Hess-Kosa, Indoor Air Quality - Sampling Methodologies: Lewis Publishers, 2002.
[2] "Code of Practice on Indoor Air Quality," Department of Occupational Safety and Health - Ministry of Human Resources Malaysia, 2005. [3] Christer P. Helenelund, "New type of CO2 sensor for ecological
measurements " presented at 26th Conference on Agricultural and Forest Meteorology, 2004.
[4] S.-J. C. Joel A. Silver, "Carbon Monoxide Sensor for Combustion Feedback Control," presented at 44th AIAA Aerospace Sciences Meeting and Exhibit, 2006.
[5] H. E. Ingo Siebera, Karl-Heinz Suphanb, Oliver N¨ussenc, "Optical modeling of the analytical chamber of an IR gas sensor," Proc.SPIE, vol. 4408, pp. 272-282, 2001.
[6] W. Yanfeng, M. Nakayama, M. Yagi, M. Nishikawa, M. Fukunaga, and K. Watanabe, "The NDIR CO2 monitor with smart interface for global
networking," Instrumentation and Measurement, IEEE Transactions on, vol. 54, pp. 1634-1639, 2005.
[7] Y. P. SeungHwan Yi, SeungOh Han, NamKi Min, EunSok Kim, TaeHwan Ahn, "Novel NDIR CO2 sensor for indoor air quality
monitoring," Solid-State Sensors, Actuators and Microsystems, 2005.
Digest of Technical Papers. TRANSDUCERS, 2005, pp. 1211- 1214
[8] S. D. Smith, A. Vass, P. Bramley, J. G. Crowder, and C. H. Wang, "Comparison of IR LED gas sensors with thermal source products,"
Optoelectronics, IEE Proceedings-, vol. 144, pp. 266-270, 1997.
[9] F. J. Bryant, "Infrared absorption measurements in the field using LED sources," 1990.
[10] J. S. Goldmeer, "A Rugged LED-Based Sensor for Fire Detection," presented at AUBE '01 12th International Conference on Automatic Fire Detection, 2001.
[11] IBSG, "Application of Mid-Infrared LED and Photodiodes in Gas Sensors
": http://www.ibsg-st-petersburg.com/About_Us/applicat.htm, March 2007.