3990
©IJRASET: All Rights are Reserved
To Display Candlesticks by Using Qt Framework
Yogesh Pareek
1, Richtie Mathew
2, Nisha Balani
31,2,3,4Department of Computer Science Engineering, Jhulelal Institute of Technology, Nagpur, India
Abstract -- Advances in data mining techniques are now making it possible to analyze a large amount of stock data for predicting future price trends. The candlestick charting is one of the most popular techniques used to predict short-term stock price trends, i.e., bullish, bearish, continuation. While the charting technique is popular among traders and has long history, there is still no consistent conclusion for the predictability of the technique. The trend of stock prices often continues after intervals of several days because stock prices tend to fluctuate according to announcements of important economic indicators, economic and political news, etc. To cope with this kind of stock price characteristics, this paper focuses on a dynamic programming algorithm for retrieving similar numerical sequences.
The proposed algorithm also handles a relative position among a stock price, 5-day moving average, and 25-day moving average to take into account where the price occurs in price zones. Experimental results on the daily data of the Nikkei stock average show that the proposed algorithm is effective to forecast short-term trends of stock prices. Candlesticks are especially popular because they give investors a very clear visual image of a stock’s progress. They provide deeper insight into the direction of the market as compared to other types of charts. Most investors feel that candlestick charts are more visually informative and appealing; therefore it is easier to draw inferences from them.
A candlestick provides an encapsulated picture of the stock movement so investors can easily compare the opening and closing prices, as well as the high and low. The candlestick charting technique probably began sometime after 1850. Despite of its long history and popularity, mixed results are obtained in the studies on candlestick charting. Negative conclusions to the predictability of candlesticks are reported, while positive evidences are provided for several candlestick chart patterns in experiments using the U.S. and the Asian stock markets. It is also pointed out that candlestick chart pattern recognition is subjective. The candlestick chart patterns are often qualitatively described using words and illustrations.
Keywords: Market Efficiency, Candlestick Technical ,Analysis Charting
I. INTRODUCTION
Stock market prediction techniques play a crucial role to bring more people into market and encourage markets as a whole. Fundamental analysis and technical analysis are two popular approaches to successful stock trading. Fundamental analysis combines economic, industry, and company analysis to derive a stock’s current fair value and forecast future value. Traders apply this approach over a long period of time, e.g., months, quarters. Because of this analyzing processes, most investors believe that fundamental analysis is mainly suitable for long-term prediction. Technical analysis is a study of market action, primarily through the use of charts for the purpose of forecasting future price trends. Technical analysis is based on the following three premises:
Market action discounts everything: a stock’s price reflects all relevant information such as economic, fundamental and news events,
Prices move in trends: prices trend keep directionally, i.e., up, down, or sideways, for a certain period,
History repeats itself: the repetitive nature of price movements is mainly attributed to market emotions like fear or excitement that often repeat themselves.
One of the important types of technical analysis is candlestick chart patterns. The candlestick chart patterns provide short-term predictions for traders to make buy or sell decisions. While most of techniques use statistics of stock prices, the candlestick charting technique focuses on patterns among several days of candlesticks formulated by opening, high, low, and closing prices within a specific time frame, such as minute, hour, day or week. Dozens of candlestick chart patterns are identified to be signals of bullish/bearish reversals and continuations. These patterns consist of a single candlestick or a combination of multiple candlesticks. In fact, the technique acts as a leading indicator with its capability to provide trading signals earlier than other technical indicators based on statistics. It is also used by some real time technical service providers to provide quick signals for market’s sentiments.
3991
©IJRASET: All Rights are Reserved
change in the underlying codebase, while still being a native application with native capabilities and speed. Qt is currently being developed both by The Qt Company, a publicly listed company, and the Qt Project under open-source governance, involving individual developers and firms working to advance Qt. Qt is available under both commercial licenses and open source GPL2.0, GPL 3.0, and LGPL 3.0 licenses.
II. RELATED WORK
Marshall, Young, and Rose-There is no general consensus on the effectiveness of candlestick charting in the literature. Marshall, Young, and Rose (2006) propose an empirical framework for predictive power of candlesticks. They employ the bootstrap methodology to retest the results, and find that candlestick technical analysis cannot help investors make a profit. Marshall, Young, and Cahan (2008) use a similar approach in analyzing the Japanese stock market by dividing 100 stocks listed on the Tokyo Stock Exchange into three ten‐year sub‐periods. They find that candlesticks have no value for traders in the Japan stock market. Horton (2009) observes nine candlestick patterns for 349 stocks listed in the S&P 500 index and finds that the use of Stars, Crows, or Doji in trading individual stocks is not recommended.
Prechter, Robert R., Jr., and Wayne D. Parker- We analyze all U.S. presidential election bids. We find a positive, significant relationship between the incumbent’s vote margin and the prior net percentage change in the stock market. This relationship does not extend to the incumbent’s party when the incumbent does not run for re-election. We find no significant relationships between the incumbent’s vote margin and inflation or unemployment. GDP is a significant predictor of the incumbent’s popular vote margin in simple regression but is rendered insignificant when combined with the stock market in multiple regression. Hypotheses of economic voting fail to account for the findings. The results are consistent with socionomic voting theory, which includes the hypotheses that (1) social mood as reflected by the stock market is a more powerful regulator of re-election outcomes than economic variables such as GDP, inflation and unemployment and (2) voters unconsciously credit or blame the leader for their mood.
III. PROBLEM STATEMENT
A. Basic Issue
Every day individual investors come across many issues for the investment activities and fail to find a tool to understand prices patterns of stocks for estimation of returns for prescribed time period and the right time to invest.
B. Present Situation
There is no evidence of any study that has taken place supporting that candlestick charts definite role in predicting the behavior of share price and also to see the extent of utility and validity (how far reliable) of technical tools in Indian stock market.
C. Solution
With the help of this project people facing these problems will get a solution as displaying candlesticks will be easier and more understandable to normal layman. The tool will not be as complicated as it was till now. The present study will focus on the different types of technical charts that help in analyzing the price behavior and study broadly the long-term and short-term price behavior of the select stocks in Indian scenario and further it will also examine the validity of the Technical analysis with special reference to candlesticks and the individual investors awareness level, perception and expertise in using the candlesticks for the evaluation of their investments interest.
IV. PROPOSED PLAN
The basic idea behind this project is to use Qt framework as a base and displaying candlesticks using this base in advanced software i.e. C++ 11.
C++ 11 is basically a version designed to maintain stability and compatibility with basic versions of software. With this plan we tend to increase performance of candlesticks and the ability to work directly with hardware. The basic features of C++ 11 which are used in this project are – auto, range based for loops, smart pointers. Qt framework is used for developing GUI’s that run on all major platforms.
Qt supports various compilers including C++ which helps the native looking interface to look advanced and where Qt is classified as widget toolkit.
3992
©IJRASET: All Rights are Reserved
Complete abstraction of GUI Signals and slots
Meta object compiler Language bindings.
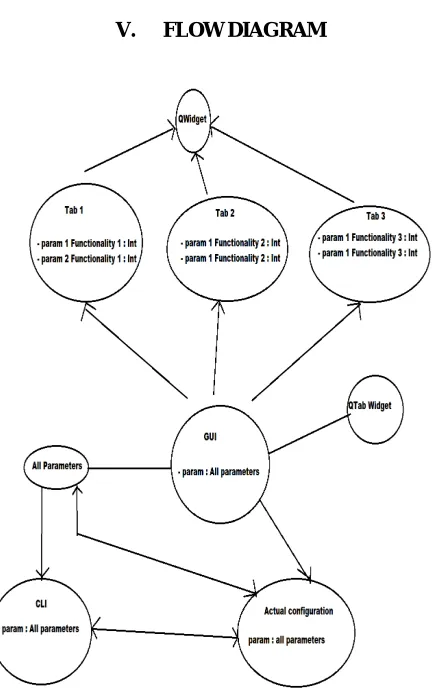
[image:3.595.181.398.189.538.2]V. FLOW DIAGRAM
Fig. Flow Diagram of Candlestick Chart
It is like a combination of line-chart and a bar-chart: each bar represents all four important pieces of information for that day: The open, the close, the high and the low. Being densely packed with information, they tend to represent trading patterns over short periods of time, often a few days or a few trading sessions.
VI. CONCLUSION AND FUTURE ENHANCEMENT
A. Conclusion
Candlesticks can be powerful trading tools, but they are not best used in isolation. Combine them with simple pieces of technical analysis and they will give you clear signals that the market is ripe for you to open your trade or close out a position. Use them alone, and you may find that you are too “close” to the price picture to see what’s really going on. At this point, you have a great start to using candles. Now, it’s up to you to work with the material and make it yours.You should be able to analyze candle patterns objectively and make intelligent trading decisions. Defining an opportunity, where the odds are in your favor, then having the discipline to follow your trading and money management rules is all that you can do.
3993
©IJRASET: All Rights are Reserved
It aims to develop cross application development and framework to work on all platforms, to develop window application it takes six months again to use same logic it takes four months similarly if we go in this way it takes years to develop same solution on this platform individually that’s why QT comes to the picture to develop single development of platform in less time
REFERENCES
[1] “C++ GUI programming with Qt4 by Jasmin Blanchette, Maek Summerfield” for getting the link between C++ and Qt. [2] www.qt.io for understanding candlestick related information.
[3] www.researchgate.net for candlestick technical trading strategies
[4] www.quora.com for the basic advantages and disadvantages related to technical issues of Qt framework. [5] www.cppdepend.com for information related to C++.
[6] www.codeproject.com for the features of C++ and Qt. [7] www.sourceforge.net for Qt GUI module
[8] www.advsofteng.com for understanding C++ graph and chart [9] www.wiki.qt.io for basic architecture and model of Qt framework.
[10] www.ionos.com for information relating to GUI and application of framework in C++ [11] www.digitalmars.com for C++ language implementation
3994
©IJRASET: All Rights are Reserved
3