VOL. VII, No. 3 JULY 1930
THE RELATION BETWEEN BODY WEIGHT
AND ARTERIAL CROSS-SECTION
BY R. M. MURRAY LYON.
(From the Department of Pharmacology, University of Edinburgh.)
(Received 6th December, 1929.)
(With Six Text-figures.)
THE writer has measured the cross-sections of the aorta and of the coronary arteries in a series of animals varying in size from the rat to the horse, for the pur-pose of determining how variations in body weight influence the cross-sections of these arteries.
METHODS.
Much of the evidence available regarding the diameter of arteries is unsatisfactory. Some writers have made direct measurements with calipers after death, without taking into account the effects of pressure. Such measurements are fallacious, for Fuchs (1) showed that the diameter of an empty artery was only half the diameter of an artery distended with moderate pressure. Fuchs measured the aortae of dogs with calipers during life, and post-mortem after distension with physiological saline at a pressure equal to the blood-pressure, and found that the difference between the two measurements was less than 6 per cent. A considerable number of writers have distended arteries with quick setting material and have measured.the casts. Thome (a) used a mixture of plaster of Paris and oatmeal, and measured the diameter of numerous arteries in the dog. Cruickshank and Rau (3) found that casts produced by injections of paraffin and gelatin were inaccurate owing to the change in size of the artery produced by the changes in temperature involved in this procedure.
I found that the method of obtaining celloidin casts as used by Krassuskaja(4), Huber(5) and Hinmanw did not give accurate enough results owing to the con-traction that occurred when the casts set.
Several workers have photographed the coronary arteries with X-rays after injecting opaque materials. Unfortunately the substances employed were such as would produce a considerable action on the muscle of the arteries, e.g. salts of heavy metals as used by Crainicianu (7) and Pace (8).
I examined the method of injection of lipiodol as carried out by Rouslacroix (9) and Nagaokaoo) for possible fallacies. The effect of lipiodol was tried on the cat's ca^ttid. The diameter of the carotid was measured with calipers in the anaesthetised c J B i d then the artery was excised and filled with lipiodol at a temperature of
2 2 2 R. M. MURRAY L Y O N
370 C. One end of the vessel was tied off and the other was connected
under a pressure of ioo mm. mercury, and the diameter measured. This was^Red in several animals and the readings obtained from the vessels in situ and after filling with lipiodol were found not to differ more than 5 per cent.
The injection of lipiodol appears to be free from any serious error. Lipiodol is inert and does not affect the vessel wall, temperature and pressure can be ad-justed to normal, and there is no handling and consequent traumatism of the actual arteries examined. The injection of lipiodol was carried out with the apparatus shown in Fig. 1.
This apparatus allowed Ringer, oxygen or lipiodol to be driven through the coronaries at any pressure desired, for the pressure could be adjusted by the graduated mercury pressure valve. This method proved to be quite satisfactory in
Fig. 1. A. Clamp. B. Heart in Ringer's solution. C. X-ray tube. D. Ringer's solution. E. Ad-justable pressure valve. F. Oxygen supply.
most cases, but occasionally the aortic valves proved incompetent. In such cases the ventricle filled with lipiodol, and it was impossible to get clear photographs of the coronary arteries.
The technique varied slightly in different cases but was always similar. The hearts were removed from the body either as soon as possible after death, or when possible whilst the animals were still under anaesthesia; the last method was employed in the preliminary experiments.
The Relation between Body Weight and Arterial Cross-Section 223
Ringer's fluid was cut off and oxygen was driven through to blow it out. ssure was then cut off and lipiodol was injected into the cannula at a temperature of 370 C. The amount of lipiodol used depended on the size of the heart. The pressure was then turned on at 50 mm. mercury and the heart was screened. Whilst being screened the clamp was adjusted until both coronaries were shown at their origin from the aorta. It was found that in order to get clear defini-tion 6f the vessels in the radiograph the heart had to be at a distance of about 30 in. from the tube. The heart was first examined close to the tube and was adjusted so that a clear view of the origin of the coronary arteries was obtained. Then the heart was moved 30 in. away from the tube, and a radiograph was taken at 50 mm. mercury pressure. The pressure was then increased to 100 mm. mercury or to the normal systolic pressure of the animal whose heart was being examined and a second picture was taken. Finally the pressure was cut off, the tubing opened, and a picture was taken at zero pressure.
In the experiments made to determine the effects of temperature one exposure was taken at 370 C. and then the heart was cooled down to room temperature of 200 C. and a second picture was taken.
Post-mortem contraction was measured by first taking a radiograph of the fresh heart at 100 mm. mercury. The pressure was then cut off and the heart left for 24 hours. Pressure was then put on again and a second radiograph taken.
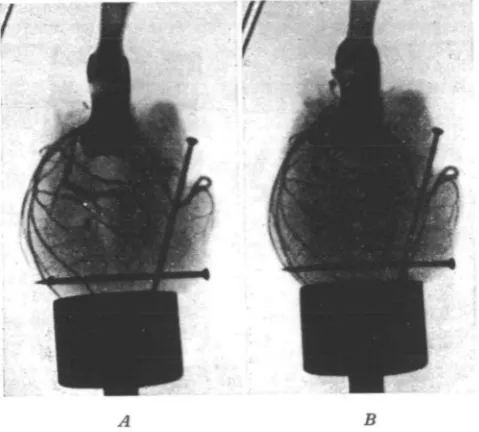
For the actual measurement of the vessels prints were developed from the negatives. Figs. 2 and 3 show examples of the radiographs obtained. The measuring was done with a reading microscope with a graduated scale reading to 0*02 mm. The diameter of the pins was measured, the magnification of the print was thus estimated, and the measurements of the arteries were corrected to obtain their natural size.
In all cases the coronary vessels were measured at their origin from the aorta and their cross-section at this point was calculated. The aorta was measured just distal to the origin of the coronaries. The aortic cross-section in the case of the rat, rabbit and cat was calculated from the X-ray photographs. In order to measure the aorta in the larger animals a piece of aorta was taken, one end was closed by a cork and the other end was attached to the oxygen supply and a suitable pressure was applied. The outside diameter was measured by calipers and the total cross-section was calculated. The actual internal cross-cross-section was obtained by subtraction of the area of thickness of the aortic wall from the total cross-section.
EXPERIMENTAL ERRORS.
The diameter of arteries is affected by variations in pressure and temperature and by post-mortem contraction. The effect of pressure on the aorta and coronary arteries of the cat is illustrated in Fig. 2. The diameter of these arteries was nearly d o l l e d and the cross-section was increased three-fold by a change from zero
^ R to a pressure of 100 mm. mercury.
224 R. M. MURRAY L Y O N
I found that fresh arteries responded differently to arteries 24 hours after dMth. In the fresh artery a change of pressure from zero to 50 mm. mercury produlRl a much greater effect than did a subsequent change of pressure from 50 to 100 mm. mercury. The arteries 24 hours after death were more rigid and the chief distension did not occur until the pressure rose above 50 mm. mercury. This confirms the results of previous workers, namely RoydO, who worked on arteries 24 hours after death, Fuchs(i) who used fresh arteries, and Mac William («a) who pointed out the difference between fresh and stale arteries.
Cruickshank and Rauo) showed that a change from room temperature (200 C.) to body temperature caused a dilatation of the systemic arteries and a contraction of coronary arteries. My measurements confirmed this result. The extent of these changes is shown in Table I.
Fig. 2. Radiographs of aorta and coronaries of cat. A. No pressure. B. Pressure of 50 mm. Hg.
C. Pressure of 100 mm. Hg.
Table I . Influence of temperature on arterial cross-section. Aortic and coronary cross-section in sq. cm. at a pressure of 100 mm. Hg and at temperatures of
200 C. and 370 C.
Antmal
Cat Cat Cat Cat Cat
Aortic cross-section
2O°C.
0-402 0-217 0-390 0283 0149
37° C
0-424 0-226 0-409 0-303 0-157
Average
% difference
5 4 6 5
5
Coronary cross-section in sq. cm.
2O°C.
0-036
O-O32 O-O33 0-031 O-OI5
39° C.
0-031 O-O2O O-O29 O-029 O-0I4
Average
0/la
difference
14
10 12
7 7
The Relation between Body Weight and Arterial Cross-Section 225
[image:5.451.86.326.210.426.2]t
e results in Table II show that both the coronary arteries and the aorta ct during the first 24 hours after death. A comparison of Tables I and II shows that in the case of the coronary arteries the post-mortem shrinkage in the first 24 hours reduces the cross-section by about 9 per cent., whilst lowering the temperature from 370 C. to 200 C. causes an increase of about 10 per cent, in the cross-section. Hence measurements made of the coronary arteries 24 hours after death at room temperature should correspond fairly closely with the measurement of the fresh artery at 370 C. This is important, because in the case of man only post-mortem material is available.Fig. 3. Radiographs of aorta and coronaries of cat. A. At temperature of 37° C. B. At temperature of 200 C.
Table I I . The cross-sections of the aorta and coronary arteries in cats' hearts immediately after death and 24 hours later.
Aortic cross-section in sq. cm.
At death
0 2 2 6 O-377 0-503 0 3 4 6 0-327
24 hours later
0217 0268 0-465 0-321 0299
Average difference
0//o
difference
4
I
3 9 6 4
Total cross-section of coronary arteries in »q. cm.
At death
0-017 0-025 0-042 0039 0039
24 hours later
0016 0-022 0-038 0035 0-036
Average difference
0/
/o
difference
6
12 10 10
8
[image:5.451.49.369.506.631.2]226 R. M. MURRAY L Y O N
i n
The post-mortem contraction continued for some days and specimens cold storage for five days after death showed a coronary cross-section of o the amount of a specimen 24 hours old. Post-mortem material was therefore always used within the first 24 hours after death.
EXPERIMENTAL RESULTS.
Determinations of aortic and coronary cross-section were made in 26 cats. The body weights varied from 1440 to 4270 gm. and the heart weights varied from 6-5 to 2O>5 gm. The figures showed wide individual differences and therefore they were divided into three groups, and averages were taken of each group.
The average values obtained in cats of varying size, which are included in Table III, show that increased body weight is associated with increase in both the aortic cross-section and in the coronary cross-section, but that the variations in the arterial cross-sections are not directly proportional to the variations in the body weight. Similar measurements were made in the rat, rabbit, sheep, man, horse and ox. The averages of the figures obtained are shown in Table III.
Table III. Animal Rat Rabbit Cat Sheep M a n Horse Ox No. of experi-ments 4 5 1 0 9 7 3 5 4 3 Average weight i n Body
2 1 0
2,400 2,010 2,740 3.630 (43,000) (56,000) (604,000) (607,000) gm. Heart
0 9 0
6-6 9 9
12-5 16-5 197
2 8 0
3850
2700
Heart ratio 100 x heart weight
body weight
0-42 0-28 0 4 9 0-46 o-45 0-46 0-50 0-64 o-45 Average cross-section
in sq. cm.
Aorta
0-095 O-397 0-30 0-40 0 4 9
5 0 1
6-io
44-S
3 2 9
Coronaries 00033 0019 0-030 0-032 0-040 0209 0291 2-450 1-146 Animal Rat Rabbit Cat Sheep M a n Horse Ox No. of experi-ments 4 5 1 0 9 7 3 5 4 3 Aortic cross-section per kg.
body weight
0 4 4 0-17 0-15 0-146 o i 3 5
O i l O-II 0 0 7 0 0 6
Coronary cross-section per gm.
heart weight 0-0037 0-0029 0-0030 0-0026 00024 o-ooio O'OOII 0-0006 0-0004 r uise rate
4 2 0 2 0 5 1 3 0
— 75 7 2 36 43 Basal metabolism. Calories per 24 hours 45
1 4 0 2 0 0 — — 1160 1400 9000 14,600
Note. The body weights in the case of the sheep, man, horse and ox were estimated from
weights by means of the heart ratios as given by Clark (14). The figures for the pulse ra basal metabolism are quoted from the same source (15).
irt
The Relation between Body Weight and Arterial Cross-Section zz'j
DISCUSSION.
The values for aortic cross-section given in Table III are greater than those usually accepted. Clark (13) gives figures collected from various sources for the cross-section of the aortae of mammals of varying sizes. In the case of the smaller animals these figures are about one quarter of those obtained by me, whilst in the case of man, horse and ox, they are about half of my values. The reason for these differ-ences is that the measurements obtained by Clark were made on the empty aorta, whereas mine were made on the aorta distended by a pressure equal to the normal blood-pressure of the animal concerned. The distension produced by pressure is greater in the case of small animals than it is in the case of large animals, which have thick and inelastic aortae.
Thome1 (*) measured the diameters of the aorta and coronary arteries of the dog from casts produced from fillings at normal blood-pressure. The averages of his figures are shown in Table IV. His figures for the aorta expressed as cross-section per kg. of body weight are about 1 \ times as great as those obtained by me for the cat. This difference is probably due to the fact that Thome measured the aorta at its origin across the dilatation produced by the sinuses of Valsalva, whereas my measurements were taken just above these sinuses. Thome's measurements of the dog's coronary arteries agree however fairly well with my measurements, for when expressed as cross-section per unit of heart weight his figures are intermediate between my figures for the cat and for the sheep.
Table IV. Cross-sections of aorta and coronary arteries of the dog.
(Averages calculated from figures given by Thome1 (2).)
Animal
Dogs 11,000 and under
Dogs over 11,000
No. of experi-ments
13
14
Body weight in gm.
9.4OO
14,000
Aortic cross-section in sq. cm.
1 92
2-95
Aortic cross-section per kg. body wt.
0-204
O-2I
Weight of ven-tricles in gm.
71
103
Coronary cross-section in sq. cm.
0-085
O-II
Coronary cross-section per gm. ventricle
000120
0-00107
I made measurements of the aortic and coronary cross-sections in animals varying in weight from 0-2 to 600 kg. This is a 3000 fold range of body weight, and thus provides material suitable for the study of the relation between body weight and arterial cross-section. Table III shows the cross-section of the arteries per unit weight of the tissue that they supply (i.e. cross-section of aorta in sq. cm. per kg. of body weight, and cross-section of coronary arteries per gm. of heart weight). These figures decrease as the body weight increases, and the values for the rat are about ten times those for the ox.
228 R. M . M U R R A Y L Y O N
consumption of an animal varies approximately as (body weight)^, and the oxygen consumption per unit of body weight is about ten times as great i rat as in the ox. There is, however, no great variation in the amount of oxygen carried by a unit volume of blood in mammals of different sizes. Hence the minute volume of blood flow must vary almost directly as the oxygen consumption, and hence the volume of blood supplied per minute to a unit weight of tissue must be ten times greater in the rat than in the horse.
A point of special interest is whether the varying requirements of blood supply in animals of different sizes are compensated completely by variations in the diameter of the aorta. The volume of fluid supplied by a pipe equals the velocity of flow multiplied by the section. Hence if the variations in aortic cross-section are parallel to the variations in minute volume of blood flow, then the velocity of blood in the aortae of different animals will be similar, but any deviation between these two sets of figures will indicate a variation in the velocity of blood flow.
There are relatively few direct measurements of the velocity of blood flow available, and hence the aortic cross-section must be compared with the figures for basal metabolism.
THE RELATION BETWEEN AORTIC CROSS-SECTION AND BASAL METABOLISM.
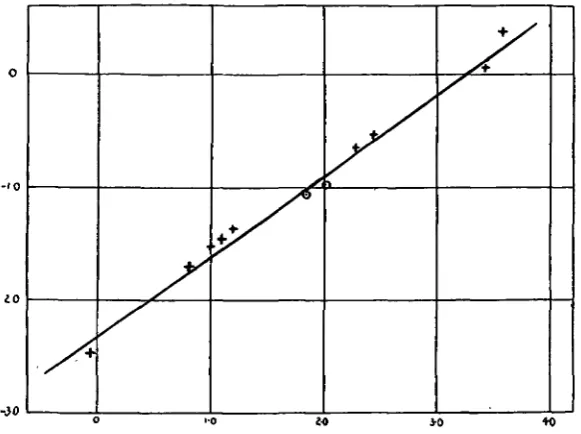
Fig. 4 shows two curves, namely the aortic cross-section plotted against body weight and the basal metabolism plotted against body weight. The great range of body weight considered makes it necessary to plot these figures on a logarithmic scale. Clark(16) has shown that the relation:—metabolism in calories per diem = (body weight in gm.)$, holds approximately for mammals varying in size from 5 gin. to 6oo kg. Curve II in Fig. 4 has been drawn to this formula and fits the values concerned fairly well. The relation between aortic cross-section and body weight cannot however be fitted by this formula. The aortic cross-section varies as some power of the body weight higher than 0 7 and lower than o-8. The values in Fig. 4 are fitted fairly well by the formula :—aortic cross-section varies as (body weight)076. This formula gives for the largest mammals, namely, the whales, the following values which approximate to the observed values collected by Clark (17).
Body weight of whale in 1000 kg. ...
Observed aortic cross-section in sq. cm. (Clark (17)) Calculated aortic cross-section
Dreyer, Ray and Walker(i8) studied the relation between aortic cross-section and body weight in rats and guinea-pigs, and concluded that the aortic cross-section varied as (body weight)0'71. Clark(19) collected figures for the aortic cross-section of mammals of all sizes and concluded that this varied as (body weight)0'72. The figures studied by these authors were, however, subject to the error that they were measurements of empty aortae.
My figures indicate that the aortic cross-section varies as a power of the weight distinctly higher than that found by these authors, and hence that
077
45
40
5
180
158
so
720
The Relation between Body Weight and Arterial Cross-Section 229
[image:9.451.80.378.199.432.2]body weight the aortic cross-section increases more rapidly than does metabolism. This suggests that the average velocity of the blood flow through the aorta must be more rapid in small than in large animals. The blood, however, only flows through the ascending aorta during the period of systolic output of the heart, and hence it is necessary to consider what is the probable velocity of the blood during this period. The period of systolic output constitutes a larger proportion of the cardiac cycle in a small animal with a high pulse rate than it does in a large animal with a slow pulse. Clark (19) quotes the following figures
Fig. 4. Abscissa—log body weight in gm. Ordinates—left, log aortic cross-section in sq. cm.; right, log calories per diem. The curves are fitted by the following formulae: Curve I. Aortic
cross-(body weight in gm.)"1" -—-— .
(
section m sq. cm. = Curve II. Calories per diem = (body weight
for the percentage of the cardiac cycle occupied by the period of systolic output: rat, rabbit and cat about 40 per cent; dog, man and horse from 30 to 20 per cent. I calculated the probable velocity of blood flow in the aorta during systolic output in the case of the seven animals whose aortae I measured. The duration of systolic output was taken as 40 per cent, of the cardiac cycle in the rat and as 25 per cent, in the horse, while intermediate figures were taken for the other animals. The following is an example of the method of calculation adopted.
230 R. M. MURRAY L Y O N
IOO
•
of blood, then the circulation volume per diem is 1812 x 1000 x c.c, an equals 419 c.c. blood per second. The aortic cross-section is 44-5 sq. cm. and hence the average velocity of blood in the aorta is •*—*- cm. per second. The duration of
44'5
systole in the horse is about 25 per cent, of the cardiac cycle and hence the velocity of blood in the aorta during systole is 4 x -±-^ = 37-7 cm. per second.
44'5
Similar calculations in the case of the other animals measured gave the results shown in Table V. This table also shows the corresponding figures calculated by Clark and the figures obtained by direct measurement. My figures, which are calculated from the diameter of the aortae when distended by pressure equal to the normal systolic blood-pressure, agree much better with the. results obtained by direct measurement than do Clark's figures, and are indeed much more probable. The table shows considerable variations in the velocity of the blood in different animals, but this is not consistently greater in the small than in the large animals.
Table V.
Rat Rabbit Cat Dog Sheep Man Horse Ox
Velocity of blood in aorta during systole in cm. per second
Calculated from figures in Tables III
and IV
786 43-S 72-5 31 35-7 33-i 37-7 820
Calculated by Clark (20)
2SS 184 66
108 7i
76, 170
Velocity of blood in carotid in cm. per sec. obtained by
direct measure-ment. Quoted from Clark (21)
34 34-38
35
43 43
It appears therefore that the cross-sections of the aortae of animals of widely varying body weight vary in such a manner that the velocity of the blood during systolic output is approximately constant.
THE RELATION BETWEEN CORONARY CROSS-SECTION, HEART WEIGHT AND PULSE RATE.
The Relation between Body Weight and Arterial Cross-Section 231
«
Tie work of the heart, during bodily rest, however, is represented by volume ut x resistance (in bodily rest the kinetic factor of the heart's work is negligible). It has been shown that the basal metabolism provides a measure of the volume output of the heart per diem and the blood-pressure in the animals studied only increases- slowly with increasing body weight. The systolic blood-pressure of the rat is about 100 mm. mercury and that of the horse about 200 mm. mercury. Therefore the cross-sections of the coronary arteries increase with increasing body weight at about the same rate as does the work done in unit time by the heart. [image:11.451.80.371.207.424.2]-iO
Fig. 5. The values marked as crosses are shown in Table III, and those marked as circles in Table IV. Abscissa—log heart weight. Ordinate—log coronary cross-section in sq. cm. The curve is fitted
by the following formula: Coronary cross-section =(heart weight in gm.)
0
'"8 218 '
This hypothesis can also be tested by comparing the coronary cross-section with the pulse rate. The output per beat of the heart varies as the heart weight, and hence in animals with similar blood-pressures the work of the heart varies as heart weight x pulse rate, and the work of the heart per unit of heart weight varies as heart weight .
. rSj— x pulse rate. heart weight
If the coronary cross-section varies as the work of the heart, then the coronary cross-section per unit of heart weight should vary as the pulse rate.
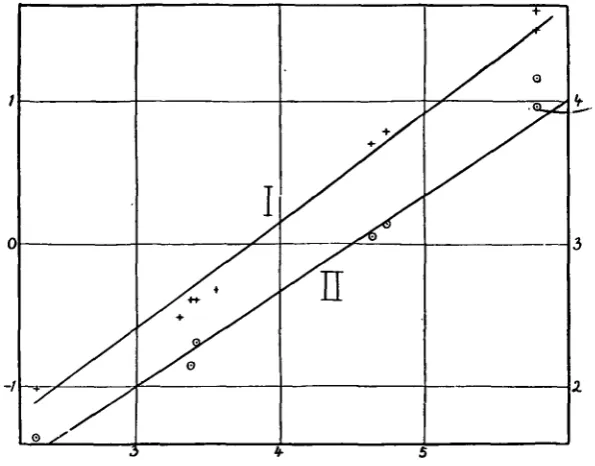
The figures are plotted in Fig. 6, and this shows that with increasing heart size
232 R. M . M U R R A Y L Y O N
THE VELOCITY OF .THE BLOOD FLOW THROUGH THE CORONARY ARTERIES.
Evans and Starling (22) found that the blood flow through the coronary arteries of the dog was 60 c.c. per 100 gm. per minute in a heart-lung preparation in which the conditions resembled those obtaining during bodily rest. Thome's figures show that in a dog's heart weighing 103 gm. the coronary cross-section is o-n sq. cm. Hence the velocity of the blood flow will be 60 x —- x x z6i cm. per minute
J
T<-M1 ( I ' l l J r
or 9-3 cm. per second.
100 O-II
-35
0
+
\I
\ . 0 —
i-S
l-S
-30
-45
Fig. 6. Abscissa—log heart weight in gm. Ordinates—left, log coronary cross-section per gm. heart weight in sq. cm.; right, log cardiac frequency. The curves are fitted by the following
3|6
formulae: Curve I. Cardiac frequency = 7 7 - — = r ; \n (heart weight in gm.)"
, . , . 0-0046
section per em, heart weight in sq. cm. —T, . , . . . . (heart weight)0 ••
Curve II. Coronary
cross-Information concerning the minute volume of. the blood supply to the heart is unfortunately not available in the case of other animals. Anrepta) has shown that the blood flow through the coronary arteries occurs chiefly during diastole, and hence the true velocity of the blood flow in the coronary arteries of the dog is probably about 9-3 x § = 14 cm. per second. This figure is considerably less than the velocity of the blood flow in the aorta of the dog during systole, which is 31 cm. per second. The low velocity of the blood flow in the coronary arteries is due in part to the fact that their cross-section is large in proportion to the weight of the organ supplied.
The Relation between Body Weight and Arterial Cross-Section 233
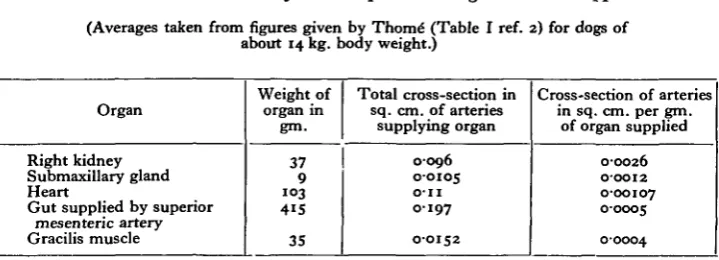
[image:13.451.48.408.157.287.2]1. These figures, which are given in Table VI, show that the arteries supplying tKe%eart are smaller in proportion to the weight of the organ than are the kidney arteries, but much larger than are the arteries to skeletal muscle or to the gut.
Table VI. Cross-section of arteries per unit weight of tissue supplied.
(Averages taken from figures given by Thom6 (Table I ref. 2) for dogs of about 14 kg. body weight.)
Organ
Right kidney Submaxillary gland Heart
Gut supplied by superior mesenteric artery Gracilis muscle
Weight of
organ in gm.
37 9
1 0 3
4 1 5
35
Total cross-section in sq. cm. of arteries
supplying organ
0-096 0-0105
O-II
0197
0-0152
Cross-section of arteries in sq. cm. per gm.
of organ supplied
0-0026 0-0012 0-00107 0-0005
00004
CONCLUSIONS.
1. Radiography of hearts into which lipiodol has been injected under a pressure equal to the normal systolic blood-pressure, provides a method for measuring the diameter, and consequently the cross-section of the aorta and coronary arteries.
2. The errors due to pressure, temperature and post-mortem changes have been investigated and the necessary compensations have been estimated.
3. Measurements of the aortic and coronary cross-sections have been made on the rat, rabbit, cat, sheep, man, horse and ox.
4. The relation between aortic cross-section and body weight differs slightly from the relation between basal metabolism and body weight in this series of animals from rat to ox.
5. The figures obtained indicate that the velocity of blood in the aorta during systolic output is similar in the animals investigated, and is not larger in small than in large animals.
6. The coronary cross-section per unit of heart weight is about ten times greater in the rat than in the ox. This difference is of a similar order to the difference between the work done in unit time by unit weight of the heart of these animals.
The expenses of this research were defrayed by a grant from the Moray Fund of this University.
234 R- M. MURRAY L Y O N
REFERENCES.
(1) FUCHS, R. F. (1900). Arch. f. (Anat. u.) Phy siol. i.02. (2) THOME, R. (1900). Pfluger's Arch. 82, 474.
(3) CRUICKSHANK, E. W. H. and RAU, A. S. (1927). Journ. 0} Phy siol. 64, 65. (4) KRASSUSKAJA, A. (1903). Ergebn. d. Anat. u. Entwickl. 13, 521.
(5) HUBER, G. C. (1906-7). Amer. Journ. Anat. 6, 391.
(6) HINMAN, F., MORRISON, D. M. and LEE BROWN, R. K. (1923). Journ. Amer. Med. Ass. 81, 177. (7) CRAINICIANU, AL. (1922). Virchow's Arch. 238, 1.
(8) PACE, D. (1925). Arch. ltd. di Anat. e di Embriol. 22, 247. (9) ROUSLACROIX (1925). Compt. rend, de la Soc. de Biol. 93, 1446. (10) NAGAOKA, H. (1928). Journ. Orient. Med. 9, 63.
(11) ROY, C. S. (1881). Journ. of Phy siol. 3 , 125. (12) MACWILLIAM, J. A. (1902). Proc. Roy. Soc. 70, 109.
(13) CLARK, A. J. (1927). Comparative Physiology of Heart. Cambridge. Appendices 11 and m . (14) (1927). Comparative Physiology of Heart. Appendix n .
(15) (1927). Comparative Physiology of Heart. Appendix I. (16) (1927). Comparative Physiology of Heart, p. 88, Fig. 13. (17) (1927). Comparative Physiology of Heart. Appendix m .
(18) DREYER, G., RAY, W. and WALKER, A. (1912). Journ. of Phy siol. 44, Proc. xiv. (19) CLARK, A. J. (1927). Comparative Physiology of Heart, p. 116.
(20) (1927). Comparative Physiology of Heart, p. 1 IT. (21) (1927). Comparative Physiology of Heart, p. 114.