ORIGINAL RESEARCH
BRAIN
Comparison of 10 TTP and Tmax Estimation Techniques for MR
Perfusion-Diffusion Mismatch Quantification in Acute Stroke
N.D. Forkert, P. Kaesemann, A. Treszl, S. Siemonsen, B. Cheng, H. Handels, J. Fiehler, and G. Thomalla
ABSTRACT
BACKGROUND AND PURPOSE: The mismatch between lesions identified in perfusion- and diffusion-weighted MR imaging is typically used to identify tissue at risk of infarction in acute stroke. The purpose of this study was to analyze the variability of mismatch volumes resulting from different time-to-peak or time-to-maximum estimation techniques used for hypoperfused tissue definition.
MATERIALS AND METHODS: Data of 50 patients with middle cerebral artery stroke and intracranial vessel occlusion imaged within 6 hours of symptom onset were analyzed. Therefore, 10 different TTP/Tmax techniques and delay thresholds between⫹2 and⫹12 seconds were used for calculation of perfusion lesions. Diffusion lesions were semiautomatically segmented and used for mismatch quantification after registration.
RESULTS: Mean volumetric differences up to 40 and 100 mL in individual patients were found between the mismatch volumes calculated by the 10 TTP/Tmax estimation techniques for typically used delay thresholds. The application of typical criteria for the identification of patients with a clinically relevant mismatch volume resulted in different mismatch classifications inⱕ24% of all cases, depending on the TTP/Tmax estimation method used.
CONCLUSIONS: High variations of tissue-at-risk volumes have to be expected when using different TTP/Tmax estimation techniques. An adaption of different techniques by using correction formulas may enable more comparable study results until a standard has been established by agreement.
ABBREVIATIONS:GVM⫽␥-variate model; LDRWM⫽local density random walk model; LNM⫽log-normal model; RLCFM⫽reference-based linear curve fit model; Tmax⫽time-to-maximum
M
ultiparametric MR imaging is currently widely established for diagnosis of patients with acute stroke,1whereas diffu-sion-weighted and time-resolved perfudiffu-sion-weighted MR imag-ing datasets are especially relevant for today’s clinical routine. DWI can display ischemic brain tissue with decreased diffusion within minutes from onset. A lesion that is visible in the DWI image sequence is typically assumed to represent the core of anischemic lesion that is unlikely to recover from therapy. PWI al-lows identifying hypoperfused tissue resulting from a present vas-cular occlusion. It has been hypothesized that the volumetric dif-ference between these 2 lesions, the so-called PWI-DWI mismatch, allows a quantitative definition of potentially salvage-able brain tissue at risk, which reflects the ischemic penumbra.2-4 It is further assumed that a quantification of this mismatch vol-ume allows identifying patients who are likely to benefit from thrombolysis, even in an extended time window after symptom onset.5,6The definition and quantification of the ischemic pen-umbra is, therefore, increasingly performed for patient selection in randomized controlled trials with treatment beyond the time window that is approved for thrombolytic therapy.7-9
Although a Tmax (see below) bolus delay of⬎6 seconds has become an accepted threshold for the definition of a relevant hy-poperfusion in recent stroke thrombolysis trials, no official guide-lines have been established on how the PWI-DWI mismatch should be calculated. While the identification of acute ischemic lesions on DWI is quite straightforward, the interpretation of PWI is rather challenging. One reason is that several parameters
Received July 11, 2012; accepted after revision November 11.
From the Departments of Computational Neuroscience (N.D.F., P.K.), Medical Biometry and Epidemiology (A.T.), Diagnostic and Interventional Neuroradiology (S.S., J.F.), Neurology (B.C., G.T.), and Institute of Medical Informatics (H.H.), Univer-sity of L¨ubeck, Hamburg, Germany.
The research for this paper was funded by the German Research Foundation (grant # DFG, HA 2355/10-1).
Please address correspondence to Nils Daniel Forkert, MSc, Department of Com-putational Neuroscience, University Medical Center Hamburg-Eppendorf, Martin-istraße 52, 20246 Hamburg, Germany; e-mail: [email protected]
can be used for perfusion map calculation. Examples of these parameters comprise the cerebral blood volume, cerebral blood flow, mean transit time, time-to-peak, and time-to-maximum. Several studies have been performed in the past to evaluate the performance of these parameters regarding the ability to predict the final infarct volume, with contradictory outcomes.10,11 How-ever, recent trials mainly focus on the peak and time-to-maximum parameter for PWI-DWI mismatch quantification. For quantitative analyses, the perfusion lesion is typically defined by TTP⬎TTP⫹or Tmax⬎, where TTP describes a mean value within healthy tissue in the contralateral hemisphere and, a given temporal delay threshold.
Several studies have been conducted to identify the optimal delay thresholdfor tissue outcome prediction. However, the findings of these studies are ambiguous, with identified optimal delay thresholds ranging from 4 to 6 seconds, depending on the applied methods and validations.4,12,13Secondary analyses of data from the Echoplanar Imaging Thrombolytic Evaluation Trial
(EPITHET) have resulted in a similar refinement of the relevant mismatch criterion by a Tmax delay of⬎6 seconds, which was used in the EXtending the Time for Thrombolysis in Emergency Neurological Deficits (EXTEND) trial.9
Several factors may influence the PWI analysis, such as the use and localization of the arterial input function.14,15Apart from this, there is another important aspect of PWI analysis that has not attracted much attention; that is the method for computation of TTP or Tmax parameter maps. Consequently, the method selec-tion may influence the quantitative perfusion lesion definiselec-tion and subsequent treatment decisions.
The aim of this work was to analyze the impact of different TTP/Tmax estimation techniques on tissue-at-risk quantification at different delay thresholds. It was hypothesized that different hemodynamic models result in relevant differences of tissue-at-risk volumes, with a noticeable effect on the number of patients labeled as exhibiting a relevant PWI-DWI mismatch according to currently used definitions.
METHODS AND MATERIALS
Patients and Imaging Protocol
Fifty nonconsecutive datasets of patients with an acute ischemic stroke in the MCA territory admitted to our hospital since 2004 were analyzed in this study. The selection criterion was a sufficient image quality without movement artifacts so that biased results due to suboptimal image quality could be neglected. Moreover, only patients with an intracranial vessel occlusion identified on time-of-flight MRA were included in this study. The site of vessel occlusion predicts the extent of acute ischemia.16Thus, to include perfusion lesions over the entire distribution range, we selected patients with 4 different occlusion types: carotid-T occlusion; “tandem-occlusion” combining extra- or intracranial ICA with MCA mainstem occlusion (MCA⫹ICA); MCA mainstem occlu-sion; and MCA branch occlusion.
All MR imaging measurements were performed on a 1.5T So-nata scanner (Siemens, Erlangen, Germany). The PWI datasets were acquired after application of contrast agent (approximately 15 mL of gadopentetate dimeglumine [Magnevist; Bayer Health-Care Pharmaceuticals, Wayne, New Jersey]) by using a TR⫽1500
ms, TE⫽37 ms, and flip angle ⫽90°; image in-plane image resolution⫽0.94 mm2; and 24 sections with 5-mm section thick-ness. Each acquired PWI dataset contained forty 3D datasets. The DWI sequences were acquired by applying diffusion gradients in 3 directions with strong diffusion-weighting (b⫽1000 s/mm2, TR⫽3500 ms, TE⫽89 ms, flip angle⫽90°; image in-plane image resolution⫽0.94 mm2; and 24 sections with 5-mm section thickness).
Informed consent was obtained from all patients. The study was approved by the local ethics committee.
TTP and Tmax Estimation Techniques
The TTP of a given tissue concentration curve, which can be ex-tracted from each voxel of the PWI dataset, is defined as the time point at which the curve achieves its signal peak. One possibility to calculate this parameter is to determine it directly from the tissue-concentration curves by using the discrete sample points. How-ever, there are 2 main drawbacks when extracting the TTP param-eter model independently by using the raw PWI concentration curves: noise artifacts and limited temporal resolution due to the discrete representation.
Thus, hemodynamic model curves are typically used to over-come these limitations. These model curves are fitted to the tis-sue-concentration curves before TTP estimation. After they are fitted, the adapted model functions can be used for TTP estima-tion with supposed higher precision.
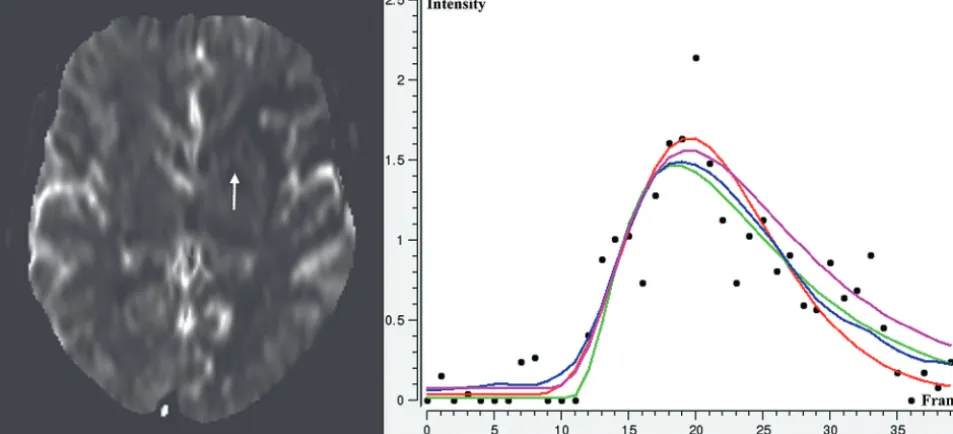
The following 4 hemodynamic models (Fig 1) have been im-plemented and used for this study: the simplified ␥-variate model,17the local density random walk model,18the modified log-normal model, 19 and the reference-based linear curve fit model.20
The TTP estimation does not account for the shape of the arterial-indicator dilution curves.21 Therefore, deconvolution-based Tmax estimation, which is deconvolution-based on the indicator-dilution theory,22has been proposed as a more precise alternative to direct TTP estimation. The Tmax parameter is defined as the time point at which the residue functionR共t兲reaches its maximum. Practi-cally, the residue function can be calculated by using the following relation:
1) CT共t兲⫽CBF⫻R共t兲䊟Ca共t兲,
whereCT共t兲denotes the tissue concentration curve;Ca共t兲, the ar-terial input function;R共t兲, the residue function; CBF, the cerebral blood flow; and V, the convolution parameter. Several ap-proaches have been presented in the past that can be used to solve this equation, whereas the singular-value decomposition ap-proach23has been found to achieve good results.
Image Processing
4D PWI datasets display the passage of the paramagnetic contrast agent, which results in a shortening of the T2 and T2* relaxation times and therefore in a reduction of signal intensities. For this reason, the signal functionsS共t兲need to be converted to concen-tration curvesC共t兲to enable an application of the aforementioned TTP/Tmax estimation techniques by using the following formula:
2) C共t兲⫽ ⫺ k
TEIn
冉
S共t兲 S0
冊
,
whereS0denotes the baseline MR signal intensity; TE, the echo time; andk, a proportionality constant.
After conversion, TTP/Tmax perfusion maps were calculated in a voxel wise manner for each PWI dataset by using the men-tioned 10 different TTP/Tmax estimation methods (model-inde-pendent TTP estimation by using the raw curves, GVM, LDRWM, LNM, and RLCFM as well as model-independent Tmax estimation by using the raw curves, GVM, LDRWM, LNM, and RLCFM).
The arterial input function, required for Tmax estimation, was selected in all datasets from the contralateral middle cerebral artery. The deconvolution, re-quired for Tmax estimation, was per-formed by using the standard singular value decomposition and a truncation threshold of 0.2.
For quantification of the PWI-DWI mismatch volume, we manually encir-cled the visible lesions, including a safety margin at each affected section in the DWI dataset. A second healthy volume of interest was then placed in the con-tralateral unaffected hemisphere in the corresponding brain tissue, so that the resulting defined volume represented an approximation of the mirrored lesion volume. This healthy vol-ume of interest was then used for calculation of the meanand SDof the DWI signal intensities, which were then applied for a refinement of the defined coarse DWI lesion volume of interest. Here, all voxels with a signal intensityI共x兲 ⬎ ⫹2are re-tained, while all other voxels are rejected from the final lesion definition.
After this process, the first PWI dataset was registered to the DWI dataset for each patient by using rigid-transformation, lin-ear interpolation, and maximization of the mutual information. The resulting transformation was then used to align the corre-sponding calculated 10 TTP/Tmax maps of a patient to the DWI dataset by using a linear interpolation.
After registration, the healthy volume of interest as used for the DWI lesion was also used for determination of the mean TTP or Tmax values for each calculated parameter map, which were used for bolus-delay correction of the TTP and Tmax values. The
FIG 1. Selected section from a PWI dataset (left) and concentration time curve (black dotted) for a location within the perfusion lesion (arrow) with fitted hemodynamic model curves:␥-variate model (red), local density random walk model (green), log-normal model (magenta), and reference-based linear curve fit model (blue).
[image:3.594.54.531.52.269.2] [image:3.594.55.379.318.463.2]normalization of the Tmax maps was required because the stan-dard singular value decomposition used in this work is sensitive to arterial bolus delay.21
These mean values were then applied for automatic PWI le-sion definition by using an automatic segmentation method. Here, all voxels within the DWI lesion were used as seeds for a volume-growing by using lower delay thresholds of⫽2,3,…,12 seconds. For each volume-growing segmentation result, morpho-logic opening (erosion followed by a dilation) followed by a larg-est connected component analysis was performed for leakage correction.
Finally, the mismatch volumes were calculated for each TTP/ Tmax estimation technique and delay threshold by voxelwise sub-traction of the DWI lesion from the PWI lesion (Fig 2).
All image-processing steps were performed in this study by using the in-house-developed software tool AnToNIa,25which was especially extended to enable all described image-based anal-yses. Apart from the DWI lesion definition, all mentioned TTP and Tmax estimation methods are implemented in this tool. Fur-thermore, the registration of the TTP/Tmax maps to the DWI dataset and the subsequent method for PWI-DWI mismatch def-inition are integrated in the software tool.
Statistics
Statistical analysis was performed by using the Pearson correla-tion coefficient to examine the strength of the associacorrela-tion between all TTP/Tmax estimation methods for all delay thresholds applied by using the Statistical Package for the Social Sciences (Version 18.0; SPSS, Chicago, Illinois).
For assessment of intermodel TTP/Tmax correction formulas, the analysis distribution of the data was checked and subsequently log-transformed. Random intercept regression analyses (with pa-tient as a random effect) were performed to model one TTP/Tmax parameter on the basis of another. Model-based estimates with 95% confidence intervals are reported. NominalPvalues⬍.05, two-sided, were considered significant. No multiplicity correc-tion was performed. The regression analyses were performed by using SAS 9.2 (SAS Institute, Cary, North Carolina).
As a result of this analysis, a mismatch volumeVTcalculated by 1 TTP/Tmax estimation technique for a given delay threshold
TTcan be artificially corrected to the corresponding mismatch volume VR as calculated by another TTP/Tmax estimation method at the same delay threshold by using the following formula:
3) VR⫽exp共A⫹log共VT兲⫻B⫹TT⫻C兲,
whereA,B, andCare correction-specific parameters obtained by the random intercept regression analyses.
RESULTS
Patient Characteristics
The mean patient age was 66 years (median: 66 years; range: 37– 88 years), and the mean time from symptom onset to MR imaging was 154 minutes (median: 127 minutes; range: 60 –310 minutes). The infarct was located on the right hemisphere in 22 cases. The median NIHSS score on admission was 15 (range, 3–23).
Ten patients presented a carotid-T occlusion; 10 patients, an ICA⫹MCA occlusion; 20 patients, an MCA mainstem occlusion; and 10 patients, an MCA branch occlusion.
PWI-DWI Mismatch Volumes
The mean DWI lesion volume was 26.4⫾29.39 mL. The median DWI lesion volume was 19.6 mL (interquartile range, 8 – 63 mL) for carotid-T occlusions, 13.7 mL (interquartile range, 10 –16 mL) for MCA⫹ICA occlusions, 16.1 mL (interquartile range, 9 –22 mL) for MCA mainstem occlusions, and 14.1 mL (interquartile range, 8 –19 mL) for MCA branch occlusions.
The results of the PWI-DWI mismatch volumes for the 10 different TTP/Tmax estimation techniques and 11 delay thresh-olds are illustrated in On-line Fig 2, stratified for the different occlusion types. Overall, the results suggest that the mismatch volumes of all TTP/Tmax estimation techniques are highly corre-lated because the curve shapes are very similar. Although the gen-eral shapes of the resulting curves are very similar, differences regarding the magnitude can be observed. More precisely, the mean volumetric PWI-DWI mismatch differences ranged from only 1.7 to 40.7 mL (corresponding to percentage differences up to 70%) among the results of the 10 TTP/Tmax estimation meth-ods for the most widely used delay range between⬎4 and⬎8 seconds. In general, Tmax-based mismatch quantification usually led to smaller mismatch volumes compared with the correspond-ing TTP-based quantification by uscorrespond-ing the same model (Fig 2).
Stratification of the results for occlusion type revealed the larg-est mean mismatch volumes for carotid-T occlusions, compara-bly smaller mismatch volumes for MCA⫹ICA, isolated MCA mainstem occlusions, and the smallest mismatch volumes for MCA branch occlusions. Within the first 3 mentioned occlusion type groups, differences in mean PWI-DWI mismatch volume ranged between 0.47 mL and 53.3 mL for the different estimation methods for delay thresholds between⬎4 and⬎8 seconds. In contrast, MCA branch occlusions presented considerably smaller marked differences, ranging from 0.54 to 25.2 mL between the average mismatch volumes calculated by the different TTP/Tmax estimation methods.
Patient-specific comparison of individual mismatch volumes determined by the 10 TTP/Tmax estimation techniques revealed volumetric differences up to 100 mL for delay thresholds between
⬎4 and⬎8 seconds in single patients. Even the most widely used model-independent and GVM TTP/Tmax estimation techniques led to volumetric differences up to 75 mL within this delay thresh-old range in individual patients.
Number of Patients with “Relevant” Mismatch
In decision-making or image-based inclusion criteria of clinical trials, a mismatch considered “relevant” for identifying patients to be treated or not treated is usually defined by the mismatch ratio rather than the plain mismatch volume. Thus, the mismatch volumes were converted to mismatch ratios in a next step. Over-all, the graphs for the mismatch ratios stratified for the different occlusion types show the same tendencies as the raw mismatch volumes (On-line Fig 1).
inclusion criteria used in the EXTEND trial for each TTP/Tmax estimation method. More precisely, patients exhibiting a PWI-DWI mismatch ratio of⬎20% and a PWI-DWI mismatch vol-ume of⬎10 mL at a temporal delay of⬎6 seconds9were consid-ered as presenting a relevant mismatch volume. The results of this evaluation are shown in On-line Fig 3 (top), which displays the number of patients included by each TTP/Tmax estimation tech-nique stratified for each occlusion type. Noticeable discrepancies regarding the number of patients fulfilling these mismatch criteria can be seen. Over the entire sample, the number of patients clas-sified as presenting “no mismatch” ranged from only 3 (RLCFM TTP) to 15 patients (LDRWM TTP and Tmax), depending on the TTP/Tmax estimation method used.
Correlation Analysis and Correction Formulas
Crosswise correlation analysis of the tissue-at-risk volumes at the different delay thresholds determined by the different TTP/Tmax estimation techniques revealed highly significant strong correla-tion coefficients, ranging from 0.896 to 0.998.
These findings support the assumption that the tissue-at-risk volumes derived from the different TTP/Tmax estimation tech-niques are comparable to some extent and a correction between the models is feasible. Quantitatively, the correction formulas al-lowed an adaptation with a nonlogarithmized mean standard er-ror of 3.64 mL (minimum, 0.84 mL; maximum, 7.46 mL) over all TTP/Tmax estimation techniques and delay thresholds (On-line Table). In general, a conversion from TTP to Tmax or vice versa led to higher standard errors (mean standard error, 4.28 mL) than the conversion between 2 TTP and 2 Tmax estimation methods (mean standard error, 2.96 mL). The correction parameters de-rived from the random intercept regression analyses can be found in the On-line Table.
To investigate a possible clinical benefit associated with these correction formulas, we exemplarily analyzed whether this adap-tation is beneficial in terms of reduced differences regarding the definition of patients with a relevant mismatch volume. There-fore, all tissue-at-risk volumes determined by the different TTP/ Tmax estimation methods were corrected to the corresponding mismatch quantification resulting from the model-independent TTP estimation. The results of this evaluation are illustrated in On-line Fig 3 (bottom). Compared with the identification of pa-tients with a relevant PWI-DWI mismatch by using the model-independent TTP estimation method, differences of up to 7 pa-tients were found for the other TTP/Tmax estimation methods before correction. After correction, maximum differences in pa-tient numbers fulfilling the mismatch criterion decreased to only 2 patients.
DISCUSSION
The main finding of this study is the observation that different TTP and Tmax estimation methods lead to considerable differ-ences of perfusion lesion volumes and calculated perfusion-diffu-sion mismatch volumes. In this sample of 50 patients with acute ischemic stroke with different occlusion types, the mean mis-match volumes differed up to 40 mL among different TTP/Tmax estimation methods. Moreover, for individual patients, the differ-ences in lesion volumes increased up to 100 mL. These findings
are novel because there is no previous systematic comparison of different TTP/Tmax estimation methods in patients with acute ischemic stroke.
The PWI-DWI mismatch definition may be influenced by sev-eral parameters to different extents, which is beyond the focus of this study. Among others, these parameters comprise the injec-tion protocol (injecinjec-tion volume and injecinjec-tion rate), MR imaging parameters, usage and techniques for preprocessing including de-convolution, perfusion parameter selection, arterial input func-tion localizafunc-tion, image registrafunc-tion accuracy, and finally the def-inition of thresholds to define critical hypoperfusion.11,14,15,21 Although several studies have evaluated the impact of 1 or more of these different parameters directly or indirectly, the influence of the TTP/Tmax estimation technique has not gained much atten-tion. So far, only 1 study has been conducted comparing direct TTP and deconvolution-based Tmax estimation.13With PET as a criterion standard, it was concluded that deconvoluted Tmax does not perform significantly better than the direct TTP estima-tion. Moreover, the optimal TTP delay threshold was estimated at 4.2 seconds, while the optimal Tmax threshold was determined at 5.5 seconds in this study. This finding also substantiates the con-clusions of this work that different TTP and Tmax methods lead to volumetric differences of perfusion lesions when applying in-appropriate delay thresholds. However, only model-independent direct TTP and Tmax estimation was evaluated in this PET study,13while the use of hemodynamic model curves was not investigated.
The numerous possible influence factors and the heterogene-ity of techniques and parameters pose a vital challenge to acute stroke perfusion image analysis, making direct comparisons be-tween studies that employed different methods complex, if not impossible.26Stroke researchers have addressed this problem by a consensus statement of an Acute Stroke Research Imaging Road-map.27 Nevertheless, a recent systematic review still identified substantial heterogeneity of perfusion image acquisition and postprocessing as well as considerable under-reporting of meth-odology in scientific publications.26The present study sheds light on an essential part of the postprocessing pipeline that has not been the focus of most stroke imaging researchers until now.
Especially in the setting of multicenter trials, this difference carries the risk of significant inclusion heterogeneity, which, in the end, may even influence the results of the trial. A number of re-analyses of data from the EPITHET have demonstrated that only slight modifications of the definition of mismatch, such as the use of coregistered images to calculate mismatch volume in-stead of simple volume subtraction, may change the trial from a negative to a positive one with respect to the primary end point.28 Thus, especially in a clinical trial or any study involving multiple sites, standardization of image acquisition and processing repre-sents a key factor to assure homogeneous results.
It was not an aim of this study to identify the optimal TTP/ Tmax estimation technique or the best delay threshold. However, the results of this study revealed that the definition of an optimal delay threshold may only be valid for a certain TTP/Tmax estima-tion technique.
This study indicates a way to overcome the problem of heter-ogeneous TTP/Tmax estimation algorithms used in stroke re-search by calculating correction formulas to convert results from one estimation model into another. Although the results of dif-ferent studies will still not be directly comparable, a rough adjust-ment appears possible by using the described correction formulas. However, the correction formulas have only been evaluated ex-emplarily in this work so that no conclusions can be drawn from this regarding a possible general application. It may be possible that the calculated parameters of the correction formulas depend on the contrast agent injection protocol, PWI acquisition param-eters, or localization of the arterial input function. Therefore, fur-ther evaluations of the presented correction formulas are required.
A suboptimal fitting of a hemodynamic model curve to the arterial input function may lead to a systematic error for the whole Tmax map calculation. Thus, special care needs to be taken to ensure optimal fitting to the arterial input function in this case.
Apart from this problem, an occluded vessel may lead to con-siderable perfusion changes so that the concentration curves do not exhibit a typical shape in the worst case. Thus, an optimal model curve fitting may not be possible in certain stroke areas because the underlying assumptions are not valid. The reference-based linear curve fitting approach20recently has been suggested, which differs from the other hemodynamic models in that no explicit assumption about typical concentration curve shape is made, to overcome this problem. The results of this study suggest that this approach leads to bigger mismatch volumes compared with the other TTP/Tmax estimation methods. This finding may be ascribed to better curve fitting in areas that are affected by a severe perfusion disturbance.
Finally, the arterial input function was selected in all datasets from the contralateral middle cerebral artery and was used in a standard singular value decomposition approach for Tmax esti-mation. Therefore, it may be interesting for further studies to evaluate more sophisticated deconvolution techniques21in com-bination with varying global or even local arterial input functions.
CONCLUSIONS
High variations of tissue-at-risk volumes, which may also be clinically relevant, have to be expected when using different
TTP/Tmax estimation techniques. An adaption of different techniques using correction formulas may enable more com-parable study results until a standard has been established by agreement.
Disclosures: Nils Daniel Forkert—RELATED: German Research Foundation (Ha2355/ 10 –1).* Jens Fiehler—Consulting Fee or Honorarium: Siemens,Comments: Congress presentation on acute stroke imaging. *Money paid to the institution.
REFERENCES
1. Muir KW, Buchan A, von Kummer R, et al.Imaging of acute stroke.
Lancet Neurol2006;5:755– 68
2. Butcher KS, Parsons M, MacGregor L, et al.Refining the perfusion-diffusion mismatch hypothesis.Stroke2005;36:1153–59
3. Neumann-Haefelin T, Wittsack HJ, Wenserski F, et al. Diffusion-and perfusion-weighted MRI. The DWI/PWI mismatch region in acute stroke.Stroke1999;30:1591–97
4. Sobesky J, Zaro Weber O, Lehnhardt FG, et al.Which time-to-peak threshold best identifies penumbral flow? A comparison of perfu-sion-weighted magnetic resonance imaging and positron emission tomography in acute ischemic stroke.Stroke2004;35:2843– 47 5. Thomalla G, Schwark C, Sobesky J, et al.Outcome and symptomatic
bleeding complications of intravenous thrombolysis within 6 hours in MRI-selected stroke patients: comparison of a German multicenter study with the pooled data of ATLANTIS, ECASS, and NINDS tPA trials.Stroke2006;37:852–58
6. Schellinger PD, Thomalla G, Fiehler J, et al.MRI-based and CT-based thrombolytic therapy in acute stroke within and beyond es-tablished time windows: an analysis of 1210 patients. Stroke
2007;38:2640 – 45
7. Hacke W, Furlan AJ, Al-Rawi Y, et al.Intravenous desmoteplase in patients with acute ischaemic stroke selected by MRI perfusion-diffusion weighted imaging or perfusion CT (DIAS-2): a prospec-tive, randomised, double-blind, placebo-controlled study.Lancet Neurol2009;8:141–50
8. Davis SM, Donnan GA, Parsons MW, et al.Effects of alteplase be-yond 3 h after stroke in the Echoplanar Imaging Thrombolytic Evaluation Trial (EPITHET): a placebo-controlled randomised trial.Lancet Neurol2008;7:299 –309
9. Ma H, Parsons MW, Christensen S, et al.A multicentre, randomized, double-blinded, placebo-controlled phase III study to investigate EXtending the time for Thrombolysis in Emergency Neurological Deficits (EXTEND).Int J Stroke2012;7:74 – 80
10. Schaefer PW, Hunter GJ, He J, et al.Predicting cerebral ischemic infarct volume with diffusion and perfusion MR imaging.AJNR Am J Neuroradiol2002;23:1785–94
11. Kane I, Carpenter T, Chappell F, et al.Comparison of 10 different magnetic resonance perfusion imaging processing methods in acute ischemic stroke: effect on lesion size, proportion of patients with diffusion/perfusion mismatch, clinical scores, and radiologic outcomes.Stroke2007;38:3158 – 64
12. Olivot JM, Mlynash M, Thijs VN, et al.Optimal Tmax threshold for predicting penumbral tissue in acute stroke.Stroke2009;40:469 –75 13. Zaro-Weber O, Moeller-Hartmann W, Heiss WD, et al.Maps of time to maximum and time to peak for mismatch definition in clinical stroke studies validated with positron emission tomography.Stroke
2010;41:2817–21
14. Ebinger M, Brunecker P, Jungehulsing GJ, et al.Reliable perfusion maps in stroke MRI using arterial input functions derived from distal middle cerebral artery branches.Stroke2010;41:95–101 15. Christensen S, Mouridsen K, Wu O, et al.Comparison of 10
perfu-sion MRI parameters in 97 sub-6-hour stroke patients using voxel-based receiver operating characteristics analysis.Stroke2009;40: 2055– 61
diffu-sion coefficient lediffu-sion to final infarct. AJNR Am J Neuroradiol
2005;26:1056 – 61
17. Madsen MT.A simplified formulation of the gamma variate func-tion.Phys Med Biol1992;37:1597– 600
18. Bogaard JM, Smith SJ, Versprille A, et al.Physiological interpreta-tion of the skewness of indicator-diluinterpreta-tion curves; theoretical con-siderations and a practical application.Basic Res Cardiol1984;79: 479 –93
19. Linton RA, Linton NW, Band DM.A new method of analysing indi-cator dilution curves.Cardiovasc Res1995;30:930 –38
20. Forkert ND, Fiehler J, Ries T, et al.Reference-based linear curve fitting for bolus arrival time estimation in 4D MRA and MR perfu-sion-weighted image sequences.Magn Reson Med2011;65:289 –94 21. Kudo K, Sasaki M, Ostergaard L, et al.Susceptibility of Tmax to
tracer delay on perfusion analysis: quantitative evaluation of vari-ous deconvolution algorithms using digital phantoms.J Cereb Blood Flow Metab2011;31:908 –12
22. Meier P, Zierler KL.On the theory of the indicator-dilution method for measurement of blood flow and volume.J Appl Physiol1954; 6:731– 44
23. Ostergaard L, Weisskoff RM, Chesler DA, et al.High resolution
mea-surement of cerebral blood flow using intravascular tracer bolus passages. Part I. Mathematical approach and statistical analysis.
Magn Reson Med1996;36:715–25
24. Straka M, Albers GW, Bammer R.Real-time diffusion-perfusion mismatch analysis in acute stroke.J Magn Reson Imaging2010; 32:1024 –37
25. Thomalla G, Cheng B, Ebinger M, et al.DWI-FLAIR mismatch for the identification of patients with acute ischaemic stroke within 4.5 h of symptom onset (PRE-FLAIR): a multicentre observational study.Lancet Neurol2011;10:978 – 86
26. Dani KA, Thomas RG, Chappell FM, et al.Systematic review of per-fusion imaging with computed tomography and magnetic reso-nance in acute ischemic stroke: heterogeneity of acquisition and postprocessing parameters: a translational medicine research col-laboration multicentre acute stroke imaging study.Stroke2012; 43:563– 66
27. Wintermark M, Albers GW, Alexandrov AV, et al.Acute stroke im-aging research roadmap.Stroke2008;39:1621–28