Assessment of Vehicle Fire Development
in Road Tunnels for Smoke Control
Ventilation Design
by
Cheong Mun Kit
Supervised by
Dr. Michael Spearpoint
and
Associate Professor Charley Fleischmann
August 2009
A thesis submitted in partial fulfilment of the requirements for the PhD Degree in Fire Engineering
Department of Civil and Natural Resources Engineering University of Canterbury
Abstract
A fire in road tunnel can be dangerous and lead to serious consequences if not addressed appropriately. In a tunnel fire incident, creating a smoke free path for motorist evacuation and facilitating fire fighters to access the fire is critical for fire and rescue operations. A means of achieving this is to use ventilation fans to blow sufficient air down the tunnel ensuring no back-layering of smoke occurs upstream of the fire. The airflow necessary for such operation is known as the critical velocity which is a function of a number of factors includes; heat release rate, tunnel geometry, tunnel gradient etc. Among these parameters, the heat release rate is the most difficult to identify as this value is dependent on the types of vehicles, number of vehicles involved, the type of cargo and the quantity of cargo carried by these vehicles. There are also other factors such as the influence of ventilation condition, tunnel geometry and the use of legislation (to restrict hazardous vehicles entering in tunnel) that could affect the heat release rate in a tunnel fire. The number of possible fire scenarios is numerous.
Based on current practise, fire size selection for most tunnel ventilation design often references various guidelines such as NFPA 502, BD78/99 or the PIARC technical committee report. The heat release rate, particularly for goods vehicle recommended by the guidelines varies from 20 to 30 MW. However, recent fire tests conducted in the Runehamar tunnel experiments indicate a higher heat release rate. These experiments suggest that heat release rate guidelines for goods vehicles might be underestimated. An ideal means to estimate the heat release rate in the tunnel is to use the oxygen consumption calorimetry technique. However, this approach is generally expensive, logistically complicated to perform and it is often not feasible to conduct such tests for a tunnel project at the initial design stage simply because the structure and systems are not ready for such activities.
Dynamics (CDF) modelling is used to establish the heat release rate in the tunnel considering factors such as fuel load, ventilation condition, tunnel geometry and ignition location. The Fire Dynamics Simulator (FDS 4.0.7), a CFD model of fire-driven fluid flow is used for the analysis and an urban road tunnel project in Singapore is used to illustrate this methodology.
Other topic related to this research work includes the reconstruction for the Runehamar tunnel fire test using numerical approach to calibrate the FDS simulation model. The used of Probabilistic Bayesian approach and CFD approach using FDS to estimate the heat release rate in the tunnel is also investigated in this thesis. The effect of vehicle fire spread in road tunnel and numerical simulation of road tunnel fires using parallel processing is presented. Preliminary work in using FDS5 for tunnel simulation work is discussed as part of the research work in this project.
Acknowledgments
I would like to acknowledge the valuable assistance and support of the following people and organisation I have received throughout this research project:
My supervisors, Dr Mike Spearpoint and Associate Professor Charley Fleischmann for their patience, guidance and invaluable advice throughout the development of this project. My employer, the Land Transport Authority (LTA) of Singapore for providing me a scholarship grant to pursue the PhD in Fire Engineering degree.
Mr Leong Kwok Weng and Mr Melvyn Thong for their ongoing encouragement and support on my pursuit of a PhD degree.
My colleagues in the LTA, Eddie Teo and Chun Hui in helping me to gather information I have requested for this project. Boon Hui in providing constructive feedback on my research work.
Major Yeo Geok Kuan from the Singapore Civil Defence Force for providing the vehicle fire statistics data for Singapore.
Computer manager Brandon Hutchison, HPC support consultant Colin John McMurtrie for providing me the technical support and librarian Christine McKee in assisting me to source information related to my research work.
Dr. Haukur Ingason from SP Technical Research Institute of Sweden for providing the test results and photographs for the Runehamar fire experiments.
Chuang Y J from National Taiwan University of Science and Technology for providing information for the 3.49 Ton truck fire test.
The New Zealand Fire Service Commission for their continued support of the Fire Engineering programme at the University of Canterbury.
List of Publications and Tunnel Projects Portfolio
The thesis is based on the following papers:
1) Cheong M K, Thong M, Soh L T, Sng C H, See C S, published as "Keeping Track” in Fire Prevention & Fire Engineers Journal, pp. 14-16, October 2007.
2) Cheong M K, Spearpoint M J, Fleischmann C M, published as “Design Fires for Vehicles in Road Tunnel”, in the 7th International Conference on Performance-Based Codes and Fire Safety Design Methods,Auckland New Zealand,pp. 229 - 240, April 2008.
3) Cheong M K, Spearpoint M J, Fleischmann C M, published as “Using Peak Heat Release Rate to Determine the Fire Risk Level of Road Tunnels” in Journal of Risk and Reliability, Vol 222, number 4, pp.595 – 604, 2008.
4) Cheong M K, Fleischmann C M, Spearpoint M J, published as “Calibrating an FDS Simulation of Goods Vehicle Fire Growth in a Tunnel Using the Runehamar Fire Experiment” in Journal of Fire Protection Engineering, Vol 19 No 3, pp. 177-196, August 2009.
5) Cheong M K, Spearpoint M J, Fleischmann C M, published as “Comparison of Statistical and Numerical Approach to Estimate Heat Release Rate in Road Tunnel Fires”, in Fire Technology, August 2009.
6) Cheong M K, Spearpoint M J, Fleischmann C M and M Thong, published as “The Effect of Road Tunnel Ventilation on the Separation of Vehicles to Minimise Fire Spread”, 13th International Symposium on Aerodynamics and Ventilation of Vehicle Tunnels, New Brunswick, New Jersey, USA, BHR Group Conference, pp. 199 – 210, 13th to 15th May 2009.
In addition to the above papers included in this thesis, others papers the author has been involved in includes:
8) L W Lim and M K Cheong, published as “Single Tunnel Ventilation Shaft for Underground Stations”, in Tunnel International Management Journal, Vol 9 Issue, March 2006.
The road and rail tunnel projects the author has been involved in includes:
i) The Kallang Paya Lebar (KPE) Tunnel in Singapore, a 9 km long dual three lanes road tunnel.
ii) The Fort Canning Tunnel in Singapore, a 350 m long three lanes road tunnel.
iii) The Woodsville Vehicular Interchange in Singapore (Feasibility study), 250 m long (3 tube) two lanes road tunnel.
iv) The Marina Coastal Expressway (MCE) in Singapore (Feasibility study), 3.5 km long dual four lanes road tunnel.
v) The North South Expressway in Singapore, 16 km long dual three lane road tunnel.
vi) The Circle line in Singapore, 33.3 km long with 29 stations and an underground depot, rail project.
vii) The North South Extension Line in Singapore, 1.5 km long rail tunnel with 1 station.
viii)The Down Town Line 2 in Singapore, 16.6 km long rail tunnel with 12 stations and a depot.
Table of Contents
Abstract... I Acknowledgments ... III List of Publication and Tunnel Projects Portfolio...IV Table of Contents ...VI List of Figures ... XIII List of Tables ... XXI Nomenclature ... XXIII
Chapter 1: INTRODUCTION...1
1.1 Background...2
1.2 Initiative for the Research ...4
1.3 Objective of this Research...6
1.4 Limitations of this research ...7
1.5 Structure of Thesis ...8
Chapter 2: TUNNEL VENTILATION SYSTEM AND DESIGN CONCEPTS ... 11
2.1 Tunnel ventilation operation mode ... 12
2.2 Tunnel ventilation system concepts ... 13
2.2.1 Jet-fan-based ventilation system ... 14
2.2.2 Longitudinal ventilation with Saccardo nozzles ... 14
2.2.3 Full transverse ventilation system... 15
2.2.4 Semi transverse supply / exhaust ventilation... 15
2.3 Worldwide road tunnel fire safety standards / guidelines ... 16
2.3.1 Heat release rate recommendation from road tunnel fire safety standards ... 16
2.4 Fire model as an analytical tools for road tunnel design... 17
2.5 Tunnel slope and super-critical velocity ... 20
2.6 Design fire adopted by various road tunnel... 22
3.1 Tunnel fire test experiments– HRR for vehicles ... 26
3.1.1 PWRI Tunnel fire experiments, 1980 (Japan) ... 26
3.1.2 Large-scale fire tests – EUREKA 499 project “Firetun” – 1990 to 1992 (Norway)... 26
3.1.3 Large-scale fire tests in the Second Benelux Tunnel (Netherlands) ... 32
3.1.4 The Memorial Tunnel fire ventilation test program, 1993-1995 (USA)... 34
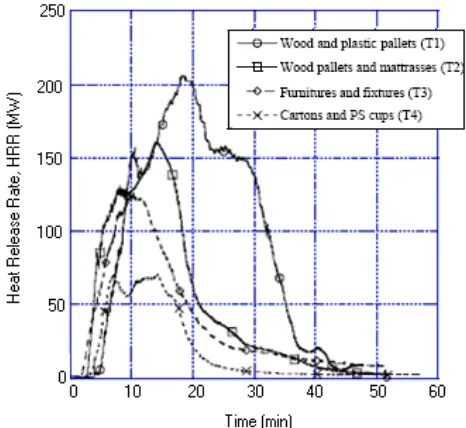
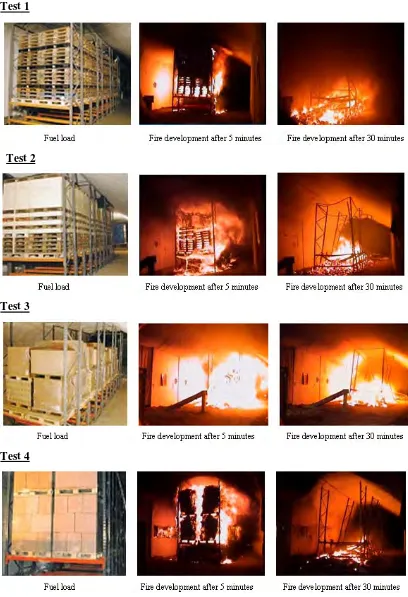
3.1.5 Large scale fire tests in Runehamar Tunnel, 2003 (Norway) ... 37
3.2 Non-tunnel fire test experiments – HRR for vehicles... 42
3.2.1 Fire test involving private cars, 1994 (Finland)... 42
3.2.2 Fire test involving private motor vehicle, 1991 (UK) ... 43
3.2.3 Fire test involving minivan, 1999 (USA) ... 45
3.2.4 Fire test on ignition of post crash vehicle fire (USA) ... 45
3.2.5 Fire test involving motor scooters, 2005 (Taipei)... 54
3.2.6 Fire test involving 3.49 Ton Truck with goods, 2006 (Taiwan)... 55
3.3 Studies relevant to this research project... 57
3.3.1 Tunnel geometry and ventilation condition... 57
3.3.2 Fuel load ... 59
3.4 Conclusion drawn from specific studies ... 61
Chapter 4: STATISTIC ON VEHICLES FIRES IN SINGAPORE AND INTERNATIONAL FIRE INCIDENTS IN ROAD TUNNELS ... 62
4.1 Vehicles Fires ... 63
4.2 Vehicles Fires Statistic in Singapore ... 66
4.3 History of Fire Incident in Road Tunnel ... 69
Chapter 5: TUNNEL ACCESS REGULATION AND HAZMAT TRANSPORT VEHICLE TRACKING SYSTEM IN SINGAPORE ... 71
5.1 Tunnel Restrictions in Singapore... 72
5.2 HazMat Transport Vehicle Tracking System (HTVTS) in Singapore... 74
Chapter 6: THE URBAN ROAD TUNNEL IN SINGAPORE ... 79
6.1 The Urban Road Tunnel in Singapore ... 80
6.2 Tunnel geometry ... 82
6.5 Vehicle access right in Singapore road tunnel ... 88
6.6 Hazmat Tracking System ... 90
Chapter 7: FIRE DYNAMICS SIMULATOR (FDS) ... 91
7.1 Hydrodynamics Model... 92
7.1.1 Conservation of mass ... 92
7.1.2 Conservation of momentum ... 93
7.1.3 Conservation of energy... 93
7.1.4 Equation of state... 94
7.1.5 Conservation of species ... 94
7.2 Combustion model ... 95
7.2.1 Mixture fraction combustion model... 95
7.2.2 Enhancement to the mixture fraction model... 97
7.3 Thermal radiation model ... 99
7.4 Thermal boundary condition ... 101
7.4.1 Convective heat transfer to walls ... 101
7.4.2 Pyrolysis Model ... 101
Chapter 8: FIRE RISK ANALYSIS... 104
8.1 Introduction ... 105
8.2 Fire risk analysis ... 105
8.2.1 Causes of vehicle fire ... 107
8.2.2 Heat release rate of vehicles ... 108
8.3 Application of the risk approach... 110
8.3.1 The urban road tunnel in Singapore ... 110
8.3.2 Vehicle classification ... 112
8.3.3 Singapore vehicle fire and accident statistics ... 113
8.3.4 Selection of vehicle fire growth ... 115
8.3.5 Tunnel fire risk... 117
8.4 Discussion ... 122
8.5 Conclusion... 124
9.2.1 Layout of fuel package ... 128
9.2.2 Fuel package (Wood and Plastic Pallets) ... 128
9.2.3 Hand calculation estimate... 130
9.2.4 Simulation approach... 131
9.3 Sensitivity analysis... 135
9.4 Discussion and Conclusion ... 137
Chapter 10: CALIBRATING AN FDS SIMULATION OF GOODS VEHICLE FIRE GROWTH IN A TUNNEL USING THE RUNEHAMAR FIRE EXPERIMENT ... 138
10.1 Introduction ... 139
10.2 The Runehamar Tunnel Experiment... 140
10.3 Modelling of Fire Experiment T1... 144
Tunnel conditions ... 145
Fuel geometry... 146
10.4 Simulation Results and Comparisons ... 153
10.5 Findings ... 158
10.6 Conclusions ... 160
10.7 Radiation Distribution on Surface ... 161
Chapter 11: NUMERICAL SIMULATION OF A GOODS VEHICLE FIRE IN TUNNEL... 168
11.1 Quantity and type of fuel load ... 169
11.1.1 Establish the commodities and quantity in goods vehicle... 171
11.1.2 Commodities fuel load thickness and surface burning factor used in FDS simulation ... 173
11.1.3 Establish the good vehicle fuel load... 180
11.2 Thermal properties used for the simulations ... 182
11.3 Fire incident respond and traffic management in tunnel... 184
11.4 Tunnel geometry ... 185
11.5 Ventilation condition... 187
11.6 Location of fire ignition ... 188
11.7 LGV and HGV fire simulation model... 189
11.9 Tunnel simulation results ... 194
11.9.1 Simulated heat release rate curve... 196
11.10 Discussions for the simulations ... 206
11.11 Conclusion from simulations analysis ... 209
Chapter 12: THE EFFECT OF ROAD TUNNEL VENTILATION ON THE SEPARATION OF VEHICLES TO MINIMISE FIRE SPREAD... 211
12.1 Introduction ... 212
12.2 Methodologies ... 213
12.3 Simulation results and discussion ... 218
12.4 Conclusion... 223
Chapter 13: A COMPARISON OF BAYESIAN AND FIRE DYNAMICS SIMULATOR APPROACH TO ESTIMATE HEAT RELEASE RATE IN ROAD TUNNEL FIRES ... 224
13.1 Introduction ... 225
13.2 Methodologies ... 227
13.3 Estimatation of HRR in a Road Tunnel ... 230
13.3.1 The 3.49 Ton truck fire experiment ... 231
13.3.2 Calculation methods ... 233
13.3.3 Comparison of results... 238
13.4 Discussion... 239
13.5 Conclusion... 242
Chapter 14: NUMERICAL SIMULATION OF ROAD TUNNEL FIRES USING PARALLEL PROCESSING ... 244
14.1 Parallel processing for CFD simulations... 245
14.2 UCSC Computing Facility ... 246
14.3 Using parallel processing techniques with FDS to estimate HRR ... 249
14.4 Simulation schedule ... 252
14.5 SIMULATION RESULTS... 254
14.5.1 Mesh boundary locations... 254
14.7 Conclusion... 261
Chapter 15: TUNNEL SIMULATION USING FDS 5.0.3 ... 262
15.1 Background... 263
15.2 FDS 5 differs from previous versions ... 264
15.3 Runehamar tunnel fire reconstruction using FDS 5.0.3... 264
15.4 Simulated Results ... 265
15.5 Simplify Cone Curve ... 268
15.6 Conclusion... 269
Chapter 16: CONCLUSION ... 271
16.1 Conclusion... 272
16.2 Recommendation for future work... 277
References... 279
Appendix A: Summary of fire in road tunnels... 298
Appendix B: Vehicles collision configuration for risk analysis approach for Chapter 8.. 304
Appendix C: Statistic data for vehicle fire incident in Singapore, road accident by vehicle type and traffic mix in a urban tunnel in Singapore ... 321
Appendix D: Event Tree – Fire in tunnel due to collision for Chapter 8 ... 331
Appendix E: Simplified event tree – fire in tunnel due to collision for Chapter 8 ... 338
Appendix F: Expose risk level due to vehicle collision for Chapter 8... 341
Appendix G: Calculation of molecular weight and stoichiometry coefficient for wood .. 347
Appendix H: Sample of FDS input file for simulating free burning pallets (FDS 4.0.7) . 349 Appendix I: Calculation to define surface burning factor and thickness of fuel used in the Runehamar tunnel simulation ... 354
Appendix J: Sample of FDS input file for simulating Runehamar tunnel (FDS 4.0.7) .... 361
Appendix K: Calculation to determine surface burning factor and thickness used in simulation (LGV)... 368
Appendix L: Material schedule for vehicles... 375
Appendix N: Sample of FDS input file for simulating a LGV fire in tunnel (FDS 4.0.7) 381 Appendix O: Sample of FDS input file for simulating a HGV fire in tunnel (FDS 4.0.7)390 Appendix P: Sample of FDS data file for simulating Runehamar tunnel using simplify
List of Figures
Figure 2.1: Emergency fan operating mode...12
Figure 2.2: Jet fan longitudinal system (reproduced from (Bendelius A 2003))...14
Figure 2.3: Longitudinal with Saccardo Nozzle (reproduced from (Bendelius A 2003))..14
Figure 2.4: Full transverse system (reproduced from (Bendelius A 2003))...15
Figure 2.5: Semi transverse supply system (reproduced from (Bendelius A 2003))...15
Figure 2.6: Semi transverse exhaust system (reproduced from (Bendelius A 2003))...16
Figure 2.7: Under ventilated fire causing Backlayering...17
Figure 2.8: Sufficiently ventilated to achieve critical velocity...17
Figure 2.9: A schematic diagram showing the airflow and temperature simulated using a one dimensional model (SES)...19
Figure 2.10: A diagram showing the air velocity simulated using a field model (FDS)....19
Figure 2.11: Slope determination...20
Figure 2.12: Predicted critical velocity Vs Heat release rate (reproduced from PIARC 1999)...21
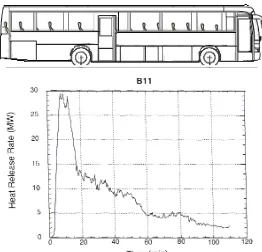
Figure 3.1: HRR for a bus fire (reproduced from (Ingason et al 1994))...27
Figure 3.2: HRR for simulated truck (reproduced from (Ingason et al 1994))...27
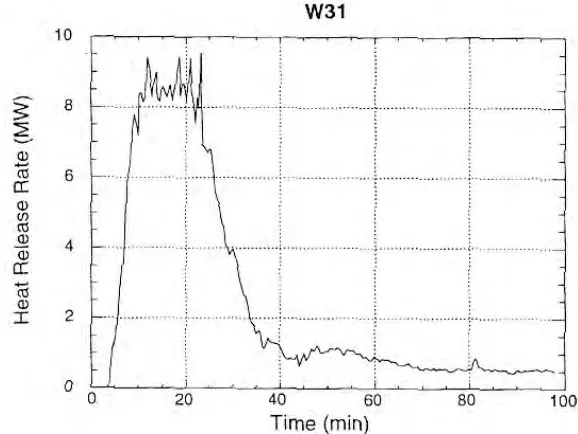
Figure 3.3: HRR for wood crib without forced ventilation ...28
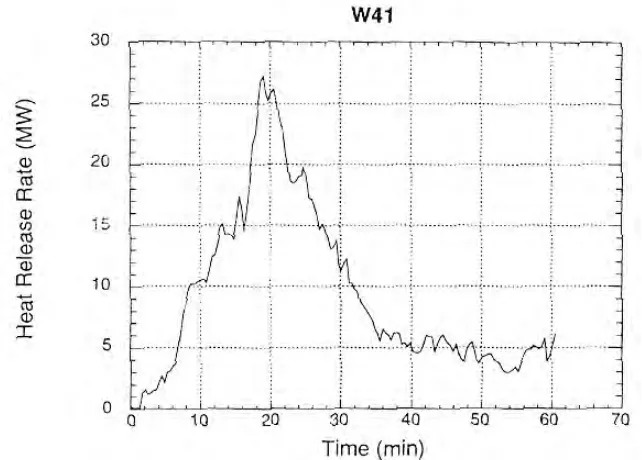
Figure 3.4: HRR for wood crib with forced ventilation ...29
Figure 3.5: A Renault Espace Prime Mover...29
Figure 3.6: HRR for Car fire Prime mover (reproduced from EUREKAl (1995))...30
Figure 3.7: A tractor with a trailer...31
Figure 3.8: Fire test involving a heavy goods vehicle (reproduced from Hack (2002))....31
Figure 3.9: HRR for Heavy goods vehicle (reproduced from EUREKA (1995))...32
Figure 3.10: HRR of a car fire (reproduced from (Lemaire and Kenyon 2006))...33
Figure 3.11: HRR of a small truck fire (reproduced from Lemaire and Kenyon 2006)...33
Figure 3.12: Memorial Tunnel test site (reproduced from (Bechtel and Brinckerhoff 1995)) ...34
Figure 3.13: Tunnel plan showing jet fans arrangement (reproduced from (Bechtel and Brinckerhoff 1995))...35
Figure 3.15: Tunnel Cross section (reproduced from Lönnermark A, and Ingason H 2005)
...37
Figure 3.16: Semi-trailer set-up for T1(reproduced from Lönnermark A and Ingason H 2005)...37
Figure 3.17: Fire test HRR (reproduced from Ingason H and Lonnermark A 2005)...39
Figure 3.18: Photograph of Runheamar Fire Tests ((reproduced from (Promat 2007a)).41 Figure 3.19: HRR Cars (reproduced from (Mangs & Keski-Rahkonen 1994))...43
Figure 3.20: Canopy configuration (reproduced from (Shipp and Spearpoint 1995))...44
Figure 3.21: HRR Cars (reproduced from (Shipp and Spearpoint 1995))...44
Figure 3.22: HRR Minivan (reproduced from (Stroup et al 2001))...45
Figure 3.23: Experimental setup for the fire test (reproduced from (Santrock 2000))...49
Figure 3.24: HRR and photograph for Test Part 3 (reproduced from (Santrock 2000))...50
Figure 3.25: HRR and photograph for Test Part 4 (reproduced from (Santrock 2001))...50
Figure 3.26: HRR and photograph for Test Part 6 (reproduced from (Santrock 2001a)).51 Figure 3.27: HRR and photograph for Test Part 7 (reproduced from (Santrock 2002))...51
Figure 3.28: HRR and photograph for Test Part 9 (reproduced from (Santrock 2002a)).52 Figure 3.29: HRR and photograph for Test Part 10 (reproduced from (Santrock 2002b))52 Figure 3.30: HRR and photograph for Test Part 12 (reproduced from (Santrock 2003)).53 Figure 3.31: HRR and photograph for Test Part 13 (reproduced from (Santrock 2003a)) ...53
Figure 3.32: Scooter used for the fire test (reproduced from (Chen et al. 2005))...54
Figure 3.33: HRR Scooter (reproduced from (Chen et al. 2005))...54
Figure 3.34: Fire test configuration (reproduced from (Chuang et al 2006))...55
Figure 3.35: HRR 3.49Ton Truck with goods (reproduced from (Chuang et al 2006))...56
Figure 3.36: Probability percentile graph for HGV fire in tunnel (Carvel et al 2004a)....57
Figure 3.37: Fire development of a car fire after 10 minutes. (reproduced from (Lemaire and Kenyon 2006))...59
Figure 3.38: Different phases of a compartment fire (reproduced from (Ingason 2005)...60
Figure 4.1: Catalytic converter location in exhaust system (reproduced from (Lee 2001)64 Figure 4.2: Breakdown of genuine fire calls (SCDF 2005a) & (SCDF 2006a)...67
Figure 4.3: Breakdown of vehicle fire incident in Singapore (SCDF 2006b)...68
Figure 5.2: Orange colour vehicle plate (reproduced from (HTVTS 2006))...76
Figure 5.3: Using GPS to monitors HazMat vehicles...76
Figure 5.4: Operation of the immobiliser in Phase 2 HTVTS...78
Figure 6.1: Tunnel layout...80
Figure 6.2: Fire safety feature in tunnel...81
Figure 6.3: Dual three lane main tunnel...82
Figure 6.4: Two lane slip road...82
Figure 6.5: Incident management process in the event of a tunnel fire...84
Figure 6.6: Smoke control and evacuation strategy in tunnel...85
Figure 6.7: Tunnel ventilation fans operation mode (normal to emergency)...86
Figure 6.8: Tunnel ventilation fans operation mode (congestion to emergency) (Information on the time of each event is taken from (Parson 2001))...87
Figure 6.9: Examples of tunnel ventilation fans operating scenarios...88
Figure 6.10: Types of vehicles allowed in tunnel...89
Figure 6.11: Types of vehicles not allowed in tunnel...89
Figure 7.1: State relations for wood (reproduced from (Yun 2006))...97
Figure 7.2: Oxygen-temperature phase space showing combustion is allowed and not allowed to take place (reproduced from (McGratten 2005))...99
Figure 8.1: Approach to estimate fire size in tunnel.... 107
Figure 8.2: Cross section of the tunnel showing the tunnel dividing wall... 111
Figure 8.3: Smoke control and evacuation strategy in tunnel... 111
Figure 8.4: Motor vehicle population by vehicle type (LTA 2006)... 114
Figure 8.5: Number of motor vehicle accidents(Statistic 2006)... 114
Figure 8.6: Vehicle fire incidents in Singapore (SCDF 2006b)... 115
Figure 8.7: HRR curves from fire experiments selected for this tunnel analysis.... 115
Figure 8.8: Heat release rate curve for vehicles fire involving multiple collisions... 117
Figure 8.9: Fault tree logic diagram for fire risk in tunnel... 118
Figure 8.10: Fire risk level in the tunnel for this project... 122
Figure 9.1: Commodities setup (Ingason pers.comm)... 126
Figure 9.2: HRR curve recorded by SP laboratory (Ingason and Lonnermark 2003)... 127
Figure 9.3: Commodities burn during the experiments (Ingason pers.comm)... 127
Figure 9.4: Fuel arrangement setup and fuel quantity (Ingason pers.comm)... 128
Figure 9.7: 1.2 m x 0.8 m plastic pallet (reproduced from (kaiserkraft 2006))... 129
Figure 9.8: Fuel arrangement model using FDS... 131
Figure 9.9: Cone test data for wood and plastic - heat flux generated by cone... 132
Figure 9.10: Grid sensitivity………...……….136
Figure 9.11: Domain sensitivity... 136
Figure 9.12: Different heat flux s/no SP1 & SP2... 136
Figure 9.13: Heat release rate recorded from SP’s Fire Laboratory Vs FDS simulation137 Figure 10.1: Cross section of Runehamar tunnel (Brekelmans & Bosch 2003)... 141
Figure 10.2: Photographs of Runehamar tunnel fire test (Vegvesen 2006)... 141
Figure 10.3: Photograph of fuel load used for the fire tests (Brekelmans & Bosch 2003) ... 142
Figure 10.4: Measurement station used in the Runehamar Tunnel fire experiments... 143
Figure 10.5: HRR recorded for the four Runehamar Tunnel fire experiments (Ingason & Lonnermark 2005)... 143
Figure 10.6: Cross section of the Runehamar tunnel showing the geometry set up for the ... 146
Figure 10.7: HRRPUA for plywood exposed at 50 kW/m2(Thureson 1991).... 148
Figure 10.8: HRRPUA for plastic exposed at 70 kW/m2 (Babrauskas and Grayson 1992) ... 148
Figure 10.9: Pallet fuel load burned in the T1 Runehamar experiment... 149
Figure 10.10: FDS input file extract showing an example of the material property... 150
Figure 10.11: Representation of the fuel load pallets model for the Runehamar experiment ... 152
Figure 10.12: Grid sensitivity………...…156
Figure 10.13: Domain length sensitivity... 156
Figure 10.14: Different fuel arrangement………..…………156
Figure 10.15: Different tunnel airflow... 156
Figure 10.16: Different ignition location... 157
Figure 10.17: Effect of ignition location on fire behaviour... 157
Figure 10.22: Radiation heat flux on fuel surface... 164
Figure 10.23: HRR for 100 and 300 number of radiation angles... 167
Figure 11.1: Risk analysis findings... 169
Figure 11.2: LGV carrying wood and plastic pallets... 172
Figure 11.3: HGV carrying wood and plastic pallets... 172
Figure 11.4: Wood and plastic pallets dimensions... 173
Figure 11.5: Dimension for heavy goods vehicle (HGV)... 174
Figure 11.6: 1.2m by 1m by 0.15m wood pallets... 175
Figure 11.7: 1.2m by 0.8m by 0.15m plastic pallets... 176
Figure 11.8: 1.2m by 1m by 0.15m wood pallets... 177
Figure 11.9: 1.2m by 1m by 0.15m wood pallets... 178
Figure 11.10: 1.2m by 1m by 0.15m wood pallets... 179
Figure 11.11: Main component of a HGV and LGV... 180
Figure 11.12: Material used in a goods vehicle construction (Scania 2005)... 181
Figure 11.13: HRRPUA for PUR………. 183
Figure 11.14: HRRPUA for ABS………….. ... 183
Figure 11.15: HRRPUA for PP………...…..183
Figure 11.16: HRRPUA for PC……….183
Figure 11.17: HRRPUA for EPDM………...………183
Figure 11.18: HRRPUA for PE………..... 183
Figure 11.19: HRRPUA for wood... 184
Figure 11.20: Fire incident respond and traffic management in tunnel... 185
Figure 11.21: Typical Cross-section for Main Tunnel... 186
Figure 11.22: Typical Cross-section for 2-Lane Slip Road... 187
Figure 11.23: Examples of tunnel ventilation fans operating scenarios... 188
Figure 11.24: Location of ignition source... 189
Figure 11.25: Snapshot of LGV in the main tunnel... 1911
Figure 11.26: Snapshot of HGV in the main tunnel... 192
Figure 11.27: LGV fire without goods………...…………197
Figure 11.28: HGV fire without goods... 197
Figure 11.29: Comparing LGV and HGV heat release rate with different fire growth rate ... 197
Figure 11.32: Ignition location s/no 4 & 6………...………….198
Figure 11.33: Different airflow s/no 4, 7... 198
Figure 11.34: Operation mode s/no 4 & 9....…...199
Figure 11.35: Operation mode s/no 7 &10………... 199
Figure 11.36: Grid sensitivity s/no 11&12………..………..199
Figure11.37: Domain sensitivity s/no12&13... 199
Figure 11.38: Ignition location s/no 12 & 14………200
Figure 11.39: Different airflow s/no... 199
Figure 11.40: Operation mode s/no 12 & 17……….200
Figure 11.41: Operation mode s/no 16... 200
Figure 11.42: Comparing LGV heat release rate with different growth rate in a 2 lane tunnel... 201
Figure 11.43: Comparing LGV heat release rate with different growth rate in a 3 lane tunnel... 201
Figure 11.44: Grid sensitivity s/no 20 & 21………..202
Figure 11.45: Domain sensitivity s/no………..... 202
Figure 11.46: Ignition location s/no 21 & 23...202
Figure 11.47: Different airflow s/no... 202
Figure 11.48: Operation mode s/no 21 &……….203
Figure 11.49: Operation mode s/no 25………..... 203
Figure 11.50: Grid sensitivity s/no 28 & 29………..203
Figure 11.51: Domain sensitivity s/no 29 (HGV, ignition: rear, area: 90 m2, & 30 (HGV, ignition: rear, area: 90 m2)... 203
Figure 11.52: Ignition location s/no 29 & 31...203
Figure 11.53: Different airflow s/no 29, (HGV, ignition: varies, area: 90 m2, 32 & 33 (HGV, ignition: rear, area: 90m2)... 203
Figure 11.54: Operation mode s/no 29………...204
Figure 11.55: Operation mode s/no 33………..204
Figure 11.56: Comparing HGV heat release rate with different growth rate in a 2 lane tunnel... 205
Figure 11.59: Varying air velocity (LGV)……….208
Figure 11.60: Varying air velocity (HGV)... 208
Figure 11.61: Time = 162 sec at 2.9 m/s (HGV)... 209
Figure 12.1: Effect of force ventilation on flame spread... 212
Figure 12.2: Simulated LGV and HGV heat release rate using FDS... 215
Figure 12.3: FDS model setup... 216
Figure 12.4a: LGV fire in a 2 lane tunnel heat flux level at receiving surface... 218
Figure 12.5a: LGV fire in a 3 lane tunnel heat flux level at receiving surface... 2198
Figure 12.6a: HGV fire in a 2 lane tunnel heat flux level at receiving surface... 220
Figure 12.7a: HGV fire in 3 lane tunnel heat flux level at receiving surface... 221
Figure 13.1: Probability percentage graph for HGV, medium and large pool fire in tunnel ... 228
Figure 13.2: Comparison of FDS and Runehamar fire experiment.... 230
Figure 13.3: HRR of 3.49 Ton truck with goods reproduced from Chuang et al (2007).. 231
Figure 13.4: Scenarios setup... 233
Figure 13.5:Material definition for light goods vehicle simulation.... 236
Figure 13.6: Cone test data used for FDS simulation.... 236
Figure 13.7: Heat release rate curve predicted using FDS4.... 237
Figure 13.8: HRR estimate for LGV fire using Probabilistic Bayesian and FDS (2 lane tunnel).... 238
Figure 13.9: HRR estimate for LGV fire using Probabilistic Bayesian and FDS (3 lane tunnel).... 239
Figure 13.10: Heat release rate estimate for front and rear ignition using FDS4... 241
Figure 14.1: The UCSC room with p5-575 case opened to show fans, memory and... 247
Figure 14.2: The UCSC system; (a) schematic setup;(b) example job tasks issued to UCSC ... 248
Figure 14.3: FDS simulation results using 32bit and 64bit compiled version... 249
Figure 14.4: (a) FDS model setup; (b) Material define for light goods vehicle simulation ... 250
Figure 14.5: Effect of putting mesh boundaries at fire location... 254
Figure 14.6: Simulation results using meshes... 256
Figure 14.7: Tunnel design application... 257
Figure 15.1: Runehamar tunnel fire reconstruction using FDS 5... 265
Figure 15.2: Grid sensitivity………..265
Figure 15.3: Domain sensitivity... 265
Figure 15.4: Comparing HRR computed using FDS version 4 and 5 with fire test... 266
Figure 15.5: Different fuel arrangement... 267
Figure 15.6: Exampleof HRRPUA curve incorporated surface burning factor... 268
Figure 15.7: Example of simplify curve... 269
Figure 15.8: HRR of the Runehamar Tunnel fire experiment using simplify curve... 269
List of Tables
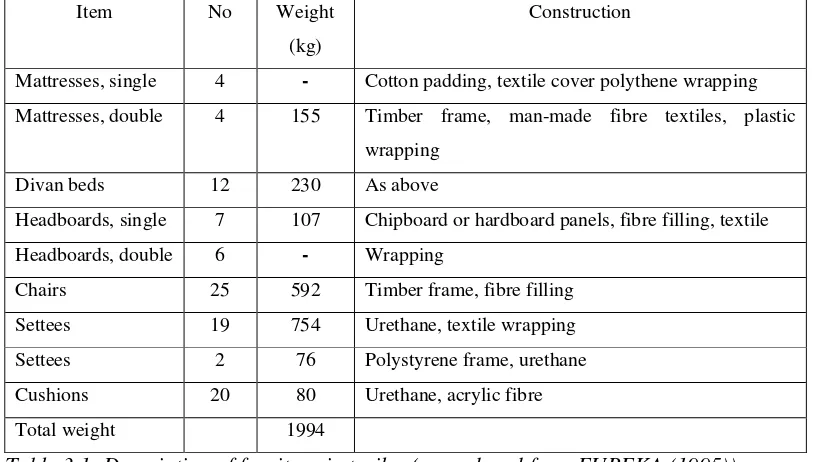
Table 2.1: Recommended heat release rate from various standards and committee...16 Table 2.2: Peak HRR values adopted by some road tunnel...23 Table 3.1: Description of furniture in trailer (reproduced from Dusseldorf et al (1995)).30 Table 3.2: Air temperature at the fans caused by various fire sizes (Bechtel and
Brinckerhoff 1995)...36 Table 3.3: Description of fire load (Ingason H and Lonnermark A 2005)...38 Table 3.4: Description of fire load used in large-scale fire test...40 Table 3.5: A summary of fire tests carried out by General Motors...48 Table 3.6: PeakHRR and test condition (reproduced from (Chuang et al 2006))...55 Table 4.1: Breakdown of genuine fire calls (SCDF 2005a) & (SCDF 2006a)...67 Table 4.2: Breakdown of vehicle fire incident in Singapore (SCDF 2006b)...68 Table 5.1: Type of HTVTS violation (SCDF 2006)...77 Table 8.1: Heat release rate from various fire experiments... 110 Table 8.2: Tunnel traffic Mix for this project (Luk 2003)... 112 Table 8.3: Fire risk due to vehicle fault, carelessness and intentional act... 120 Table 8.4: Fire risk due to vehicle collision selected data (Refer to Appendix F for full
data)... 121 Table 8.5: Summary of potential fire risk in the urban road tunnel in Singapore... 123 Table 9.1: Thermal properties for wood and plastic pallets... 130 Table 9.2: Thermal properties for wood and plastic pallets... 133 Table 9.3: Summary of the simulation performed on the burning pallets experiment... 136 Table 10.1: Fuel load used for the Runehamar Tunnel fire experiments (Ingason and
Lonnermark 2005)... 142 Table 10.2: Cone test data for wood and polyethylene... 148 Table 10.3: Re-distribution of plastic and wood pallets for baseline FDS simulation... 152 Table 10.4: Summary of the FDS simulations performed around the Runehamar tunnel fire
Table 11.6: Summary of predicted peak HRR value for a single LGV for this project... 206 Table 11.7: Summary of predicted peak HRR value for a single HGV for this project.... 207 Table 12.1: Simulation schedule used for the Singapore urban road tunnel... 214 Table 12.2: Minimum heat flux for ignition... 217 Table 12.3: Summary of vehicle separate distance from fire to prevent ignition... 222 Table 13.1: HRR 3.49 Ton truck with goods in free burning conditions Chuang et al (2007)
Nomenclature
Symbol Description Unit
A Pre-exponential factor m/s
A Surface area of fire m2
T
A
f
A
Tunnel cross-sectional area
Horizontal burning area of the fuel
m2 m2
C Empirical constant -
nc
C Natural convection coefficient -
c Specific heat kJ/kgK
p
c Specific heat of ambient air at constant pressure
kJ/kgK
D Equivalent circular diameter m
i
D Diffusion coefficient of species i -
*
D Characteristic fire diameter m
A
E Activation energy kJ/kmol
Fr Froude number -
f External force vector (excluding gravity) -
g Acceleration due to gravity m/s2
grade Tunnel gradient %
H
eff
H
Height
Effective heat of combustion
m MJ/kg
h Enthalpy J
I Radiation intensity W/m2
κ Absorption coefficient -
k Multiplicative factor -
k Thermal conductivity W/mK
L Characteristic length m
M Molecular weight kg/kmol
m&
" m&
Mass loss rate
Mass loss rate per square meter
Symbol Description Unit
p Pressure Pa
Pr Prandtl number -
.
Q Heat release rate W or kW or MW
vent
Q
. Heat release rate of fire subject to ventilation
W or kW or MW
open
Q .
Heat release rate of fire in open space W or kW or MW
''
c
q& Convective heat flux kW/m2
''
cr
q& Critical heat flux kW/m2
''
r
q& Radiative heat flux kW/m2
Re Reynolds number -
T Temperature °C or K
f
T Average temperature near fire site °C or K
t Time s
u Vector describing the velocity in the u, v and w directions
-
V Velocity m/s
c
V Critical velocity m/s
WT Width of the tunnel m
WF Width of the fire object m
x Vector position in the x, y and z
directions
-
i
Y Mass fraction -
I F
Y Fuel mass fraction in the fuel stream -
Z Mixture fraction -
Greek symbol Description Unit
ψ HRR enhancement coefficient -
ρ Density kg/m3
δ Thickness m
χ Combustion efficiency factor -
rad
χ Radiative loss fraction -
τ Viscous stress tensor Pa
R Universal gas constant kJ/kmolK
v Stoichiometric coefficients -
Φ Dissipation function -
φ Stoichiometric combustion -
σ Stefan-Boltzmann’s constant (5.67x10⁻¹¹) kW/m2K4
eff
H
∆ Effective heat of combustion kJ/kg or MJ/kg
o
H
∆ Heat release rate per unit mass of oxygen consumed
kJ/kg or MJ/kg
v
H
∆ Heat of vaporization kJ/kg or MJ/kg
List of superscripts Description Unit
. Per unit time s-1
' Per unit length m-1
" Per unit area m-2
'
" Per unit volume m-3
List of subscripts Description
∞ Ambient
a Property of air
CO Property of carbon monoxide
2
CO Property of carbon dioxide
cr Critical value
List of subscripts Description
F Fuel
g Gas
i Chemical species
ig Ignition
int Initial
max Maximum value
min Minimum value
2
O Property of oxygen
P Products
peak Peak value
rad or r Radiative
sur Surface
t Tunnel
List of Abbreviations Description ABS
AC
ACRYLONITRILE BUTADIENE STYRENE Alternating current
AID Automatic incident detector
BD British Design
CCTV Closed Circuit Television
CETU Centre d’Etudes des Tunnels
CPU Central processing unit
CTE Central Expressway Tunnel, Singapore
CFD Computational fluid dynamics
DC Direct current
DNS Direct Numerical Simulation
ETA Event tree analysis
EPDM ETHYLENE PROPYLENE DIENE RUBBER
FDS Fire Dynamics Simulator
List of Abbreviations Description
FMEA Failure mode and effect analysis
FTA Fault tree analysis
GPS Global Positioning System
HGV Heavy good vehicles
HRR Heat release rate
HRRPUA Heat release rate per unit area
HTDP Hazmat Transport Driver Permit
HTV Hazmat Transport Vehicle
HTVTS Hazmat Transport Vehicle Tracking System
ITPMS Integrated traffic and plant management system ISO International Organization for Standardization
LES Large Eddy Simulation
LGV Light goods vehicle
LTA Land Transport Authority, Singapore
LUS Lane used signal
MPI MVU
Messaging Passing Interface Mobile ventilation unit
NA Not available
NEA National Environment Authority, Singapore NFPA National Fire Protection Association
NIST National Institute of Standards and Technology
NR Not required
n/a Not applicable
PIARC Permanent International Association of Road Congresses PC
PE
Polycarbonate Polyethylene PP
PS
Polypropylene Polystyrene
List of Abbreviations Description
PWRI Public Works Research Institute
RTE Radiative Transport Equation
RTV Road Tunnel Ventilation
ROP Report of Progress
SBF Surface Burning Factor
SCDF Singapore Civil Defence Force
SES Subway Environment Simulation
SFPE Society of Fire Protection Engineers
SPF Singapore Police Force
SURS SINGAPORE UNDERGROUND ROAD SYSTEM, SINGAPORE
UK United Kingdom
USA United States of America
USFA U.S. Fire Administration
VHGV Very heavy good vehicles
Chapter 1 Introduction
Chapter 1:
Chapter 1 Introduction
1.1
Background
A road tunnel is an enclosed facility through which road vehicles such as motorcycles, cars, vans, buses and trucks could travel. It is usually constructed to overcome obstacles such as mountains and above-ground structural developments or to facilitate vehicles crossing under the sea or river (Bendelius 2003). The type of tunnel constructed is determined by the obstacle it seeks to overcome, for example there are mountain tunnels, urban tunnels or underwater tunnels.
An efficient road system is an essential element for access yet also a greedy occupant of space and a major source of noise pollution (PIARC 1987). The restrictions imposed by the local geography and the intensive use of land in countries where land is scarce would mean that the only available space for improved transportation systems is underground (Carvel and Beard 2005). In the past few years, more underground road tunnels of increasingly greater length have been built in Singapore. It seems likely that this process will continue. With more road tunnels being built and an increasing volume of traffic using them, it becomes important to establish a quantified picture of fire behaviour in tunnels and to better understand the risks involved.
Chapter 1 Introduction
(HRR), tunnel geometry, gradient of the tunnel, operation (whether bi-directional traffic is required) (Bendelius 2003) and legislation (whether vehicles carrying dangerous goods are allowed to access the tunnel, e.g. petrol tankers). Among these parameters, the heat release rate is the primary parameter for tunnel ventilation design and is the most difficult to identify as this value is dependent on the types of vehicles and the associated loads the vehicle is carrying. Very often, the cargos carried by these goods vehicles varies considerably, therefore it is difficult to quantify the exact value of HRR for a goods vehicle traversing a tunnel.
A major risk factor is the use of tunnel by heavy goods vehicles carrying loads with substantial energy content and yet not a great deal of research has been carried out to determine how these heavy goods vehicles affect the development and spread of fires in tunnel. A fire from a heavy goods vehicle could result in a dangerous situation both to other vehicles, people in the tunnel and the fire fighters if the fire starts to spread to other vehicles (Ingason and Lonnermark 2004).
Legislation is another factor that would affect the heat release rates in a road tunnel fire. In order to enhance the fire safety in tunnels; some countries like Singapore (Traffic Act 2006), Netherlands, Switzerland, France (urban tunnel only) and United Kingdom (Dartford, Mersey and Tyne tunnel only) have forbidden vehicles transporting dangerous goods such as liquid fuels in a road tunnel (OECD / PIARC 2006).
In a country like Singapore, a Hazmat Transport Vehicle Tracking System (HTVTS) is also implemented as part of the national effort to enhance the fire safety in a road tunnel. All local and foreign vehicles carrying bulk petroleum and toxic materials are tracked and monitored by the Singapore Civil Defence Force (SCDF). Vehicles carrying hazardous materials that attempt to enter a road tunnel will be stopped by the Traffic Police (SCDF 2005). This legislation has a direct effect on reducing the degree of fire risk in tunnels.
Chapter 1 Introduction
However, recent fire tests conducted in the Runehamar Tunnel showed that larger vehicles (HGV) with burning goods may cause higher peak HRR (approx 66.4 to 201.9 MW) outputs (Ingason 2006a). These tests seriously hinted that previous data regarding heavy goods vehicles might have been underestimated.
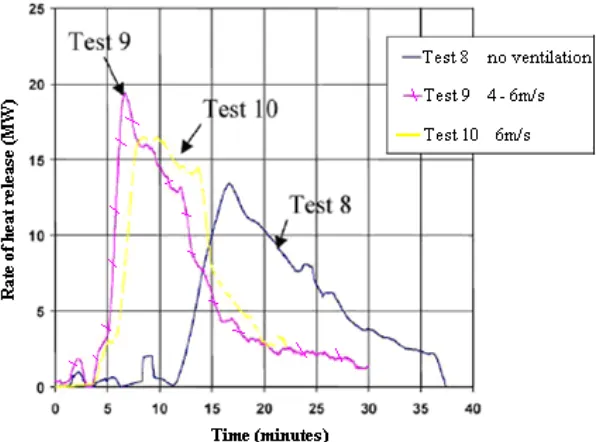
Generally, a tunnel fire has a complex flow behavior because the physical phenomenon is affected by the geometry and ventilation condition including the chemical reaction of the fuel (Lee and Ryou 2006). Full-scale tests are carried out by researchers with the aim of obtaining new knowledge about the fire development in a tunnel. These tests provide valuable information on the design of smoke control systems in the tunnel but are generally very expensive and limited. Another limitation is that most of these test programmes were performed in abandoned tunnels. For a road application, extrapolations are often necessary because of the reduced cross-section and its different shape (i.e. horse shoe instead of rectangular shape (PIARC 1999)). It should be noted that the results obtained in full-scale tests are also dependent on test conditions such as air velocity and geometry. An observation has been made in the EUREKA test that the variation of longitudinal air velocity will result in different heat release rates (Ingason and Lonnermark 2005). In a research project by Carvel et al (2005), it was found that differences in tunnel width and ventilation condition can influence the HRR of a fire. However, ventilation conditions in a tunnel may have a far more dramatic influence on the HRR than the tunnel geometry (Carvel et al 2001).
1.2
Initiative for the Research
Chapter 1 Introduction
condition, geometry and fuel load. Up unit now, there have been very few extensive studies carried out on the relationship between these parameters.
The relatively low number of tunnel fire tests conducted to-date does not allow a general conclusion to be drawn on appropriate credible vehicle design fires for road tunnel ventilation design because of the huge cost required in such test programmes. In addition, factors such as tunnel geometry, ventilation condition, fuel load can vary from tunnel to tunnel. The complexity of these factors suggested that credible vehicle design fires should be analysed on an individual tunnel basis.
In this project, an attempt will be made to use Fire Dynamic Simulator 4.07 (FDS); a computational fluid dynamics (CFD) model developed by the National Institute of Standards and Technology (NIST) to predict fire growth and flame spread in a tunnel. FDS is used because it is a CFD tool that many fire engineers use. There is completed work as well as on-going work to validate FDS for use in a wide variety of fire problems (McGrattan and Hamins 2002). The on-going effect at NIST and elsewhere to validate FDS has evaluated the model’s ability to predict the transport of heat and exhaust products from a fire through an enclosure. Recently, validation effort has moved beyond transport issues in considering fire growth and flame spread phenomena (McGrattan 2005), this can be seen from the work elsewhere (Hietaniemi et al 2004); (Floyd 2002); (Kashef et al 2002); (Hostikka and McGrattan 2001) and many more mentioned in the FDS technical reference guide. Last but not least, the FDS program is available in the public domain which can be downloaded from the NIST website. The analysis for this research project will be based on an urban road tunnel project in Singapore because the author is involved in the design and development stage for this project. Information on the tunnel geometry, ventilation mode and expected traffic fleet and type of vehicle accessing through this tunnel is available to the author. As fuel load is expected to be an important factor that could affect the fire size, the issue of allowing dangerous goods vehicles in the tunnel is not considered in this analysis in view of the implementation of HTVTS. A detailed discussion on HTVTS is covered in chapter 5 of this thesis.
Chapter 1 Introduction
geometry and ventilation conditions are applied. The HRR predicted in this project can also be used as a guide for future road tunnel project with similar geometry, ventilation condition and traffic mix in formulating evacuation and fire fighting strategies.
1.3
Objective of this Research
The objective of this research project is to formulate a methodology to establish a credible fire (heat release rate) in a road tunnel considering factors such as tunnel geometry, ventilation condition and fuel load. The work for this research project involved a combination of probabilistic and deterministic approaches. A risk based probabilistic analysis approach is used to identify the possible fire scenarios followed by a deterministic approach using FDS 4.07 to quantify the estimated fire size in the tunnel. The context of this research work is related to identifying the peak heat release rate so that this information can be used for tunnel ventilation smoke control design. It is acknowledged that in other contexts, the design fire may be related to issues such as fire detection or evacuation where fire development at the growth phase of the fire is critical; or structural fire resistance where the burning and decay phases are important. However these are not the focus of this research work although there are similarities across the various contexts.
The tasks in achieving the objective are:
i) Understand the causes of vehicle fire in road tunnel.
ii) Identify potential fire scenarios in a road tunnel using a quantitative risk assessment approach by incorporating statistical data on traffic fleet, fire incident data such as faulty vehicle, acts of carelessness, intentional fires, fires arising from collision and legislation.
Chapter 1 Introduction
iv) Perform numerical simulation work by calibrating the FDS tunnel simulation model based on Runehamar tunnel fire test. This is a similar objective to task (iii) except it is performed in a tunnel environment.
v) Perform numerical simulation of fire in an urban road tunnel in Singapore (case study) using FDS 4.07 to quantify potential fire size and fire curve considering fuel load, tunnel geometry and ventilation condition. The work from this study would enable similar modelling approach to be used for other tunnel design applications by changing the tunnel geometry, ventilation condition and fuel load.
vi) Explore the impact of vehicle fire spreading from one vehicle to another (upstream and downstream of the fire) for scenarios using longitudinal ventilation air flow in the tunnel.
vii) Compare the method formulated by Carvel based upon experimental data using a Bayesian methodology to produce a probability distribution of fire size for goods vehicles. Results from the Carvel method will be compared with the FDS 4.07 simulated results to examine if there is any significant difference in the heat release rate value using these two approaches.
viii) Explore the pros and cons of using high performance computing for FDS simulation work.
ix) The launch of FDS 5 has inspired this project to do preliminary simulations using FDS 5.0.3 to estimate the heat release rate in the Runehamar tunnel fire experiment.
1.4
Limitations of this research
Chapter 1 Introduction
It is acknowledged by the author that parameters such as tunnel cross section, tunnel air velocity could have an effect on the heat release rate in the tunnel and different tunnels might yield different heat release rate estimates. Therefore, for the purpose of this research project, an urban road tunnel in Singapore is used as a basis for this study to narrow down the scope of the analysis.
The cost of setting up a full-scale fire test is expensive and requires significant facilities, equipment and the relevant authority’s approval. Due to the lack of resources, a full-scale fire test has not been conducted to verify the simulation results. However, a simulation model for the Runehamar tunnel was built and simulated to calibrate the modelling approach.
The material properties of the fuel load (example wood and plastic) are extracted from the Cone Calorimeter test data and used for the FDS simulation. Thermal properties such as thermal conductivity and specific heat are assumed to be constant. The burning behaviour of the materials in the fire scenario is assumed to be similar to that of the small-scale fire tests.
Further details of the limitations of the modelling approach are given in Chapter 16.
1.5
Structure of Thesis
Chapter 1 Introduction
parameters used for the numerical simulations and FDS input files. This additional information is meant to provide readers of this thesis with a more in-depth knowledge of the author’s research work.
The thesis commences by providing reader the initiative and objective of this research work followed with a brief introduction on the ventilation system concept used in road tunnel design. A brief outline on some of the international standards used for tunnel ventilation design will be presented proceeding with an introduction on the fire size adopted in some road tunnel projects around the world.
The literature review in chapter 3 provides an overview to the reader the fire tests experiments conducted in tunnel based on different types of vehicles. The fire test experiments conducted in a non-tunnel environment such as in a test laboratory or open space will also be covered in this chapter. Various types of ventilation systems for tunnel ventilation design and the effect of different tunnel geometry; ventilation condition and fuel load based on various research studies will be discussed.
Chapter 4 presents the history of tunnel fire incident that have occurred internationally and the statistics on vehicle fires in Singapore. The regulation of tunnel access and Hazmat Transport Vehicle Tracking System (HTVTS) will be discussed in chapter 5.
A brief introduction on the urban tunnel in Singapore is covered in chapter 6 to provide the reader with the information needed for the case study presented in chapter 8 and 11.
Chapter 7 outlines the governing equations and assumptions used in FDS providing an appreciation on the concept behind fire modelling.
In chapter 8, the probabilistic risk assessment approach will be used to identify and define the fire scenarios for the case study tunnel.
Chapter 1 Introduction
applications. Comparison of the FDS simulated results versus experimental values and the differences in grid size, boundary condition used in the simulation will be discussed in chapter 9 and 10.
Chapter 11 will discuss the simulation setup and the simulated results for the 2 lane and 3 lane urban road tunnel in Singapore. Various tunnel geometies and ventilation conditions used in this tunnel will be highlighted.
The findings on the effect of vehicle fire spread in the case study tunnel is presented in chapter 12.
Chapter 13 compares the results using Bayesian methodology with FDS 4.07 to examine if there is any significant difference in the heat release rate value.
The discussion on advantages and limitations of using higher performance computing are covered in chapter 14.
Preliminary findings on the simulated results using FDS 5.0.3 are discussed in chapter 15.
Chapter 2 Tunnel ventilation system and design concepts
Chapter 2:
TUNNEL VENTILATION SYSTEM AND DESIGN
CONCEPTS
Chapter 2 Tunnel ventilation system and design concepts
2.1
Tunnel ventilation operation mode
Generally, the design of the tunnel ventilation system consists of three different operation modes (normal, congestion and emergency mode). Normal operation mode is where the tunnel fans are off and the recirculation of air within the tunnel is through the vehicle piston effect. The pollution concentration in the tunnel is less than the design pollution concentration limit. As traffic in the tunnel increases with a slow down in traffic movements, the amount of CO (carbon monoxide) and the temperature in the tunnel will increase. When this happens, the sensors in the tunnel will trigger the operation of the tunnel fans to dilute the CO concentration. This is known as the congestion mode. In the event of a fire, the operation of the tunnel fans will create a longitudinal air velocity higher than the critical velocity for preventing back layering of smoke thus allowing motorists trapped upstream of the fire to evacuate (Figure 2.1). This is defined as the emergency mode. As the objective of the project is to establish the credible vehicle fire size in a tunnel, subsequent discussion will be focused on the emergency operation mode.
Chapter 2 Tunnel ventilation system and design concepts
2.2
Tunnel ventilation system concepts
The heat release rate for fire scenarios is also related to the purpose of the ventilation design which is influenced by the construction and operating cost (PIARC 1999). In addition, the mode of the tunnel ventilation operation (normal, congestion or emergency) at the time of the fire incident could also have an impact on the fire size as the burning rate of the fire is dependent on the amount of air supplied to the fire (fuel control or ventilation control) due to the ventilation system in the tunnel.
Ventilation is necessary in most road tunnels (except for a short tunnel which is ventilated naturally - i.e. no fans) to control smoke and heated gases that are generated during a tunnel fire. The primary objective for controlling smoke movement in the tunnel is to provide safe evacuation and the secondary purpose is to facilitate fire fighters in accessing the fire site (NFPA 502 2004). The approach used for smoke control varies depending on the type of ventilation system being used and if the tunnel is serving bidirectional or unidirectional traffic flow.
Systems used for mechanical ventilation can be categorized into longitudinal and transverse. Longitudinal systems are sub-categorized into jet-fan-based ventilation systems and longitudinal ventilations with saccardo nozzle. For the transverse system, the sub-categories are full-transverse systems, semi-transverse supply systems and semi-transverse exhaust systems.
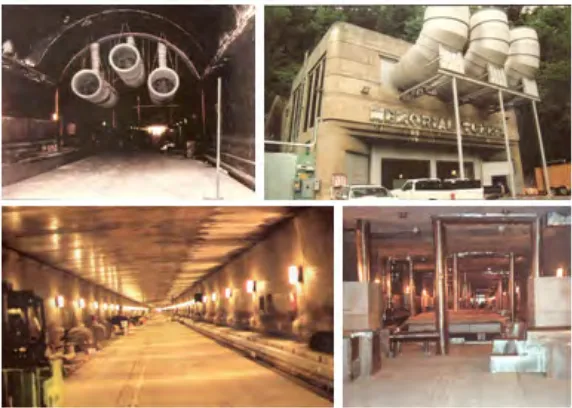
From the Memorial Tunnel Fire Ventilation Test Program (Bechtel and Brinckerhoff 1995), it is known that different ventilation strategies can yield different effectiveness in smoke and heat management. The following sub-sections discuss the various ventilation system concepts usually employed in the ventilation of road tunnels.
Chapter 2 Tunnel ventilation system and design concepts
2.2.1
Jet-fan-based ventilation system
The jet-fan ventilation system (Figure 2.2) employs a series of axial fans mounted at the ceiling level of the tunnel producing a high discharge thrust and velocity which induces additional airflow within the tunnel. This system can only be used in unidirectional tunnels as smoke and heat will be discharged from the exiting portal (Bendelius 2003).
Figure 2.2: Jet fan longitudinal system (reproduced from Bendelius (2003))
2.2.2
Longitudinal ventilation with Saccardo nozzles
This is a system (Figure 2.3) in which air is introduced into or removed from the tunnel at a limited number of points such as at the portal or a shaft (Bendelius 2003). In long tunnels, exchanging vitiated air for fresh air through a shaft may be a better solution than a larger number of jet fans (PIARC 1995).
Chapter 2 Tunnel ventilation system and design concepts
2.2.3
Full transverse ventilation system
A full transverse system has both supply and exhaust throughout the length of the tunnel (Figure 2.4). The major portion of the smoke is discharged through a stack. This system can be used in either bidirectional or unidirectional trafficked flow tunnel (Bendelius 2003).
Figure 2.4: Full transverse system (reproduced from Bendelius (2003))
2.2.4 Semi transverse supply / exhaust ventilation
Semi transverse ventilations are those that have only supply (Figure 2.5) or exhaust ducts (Figure 2.6). The exhaust from the tunnel is discharged at the portal for semi transverse supply or through the exhaust stack for semi transverse exhaust (Bendelius 2003).
Chapter 2 Tunnel ventilation system and design concepts
Figure 2.6: Semi transverse exhaust system (reproduced from Bendelius (2003))
2.3
Worldwide road tunnel fire safety standards / guidelines
2.3.1
Heat release rate recommendation from road tunnel fire safety
standards
In a road tunnel, the vehicle fire load is either unknown or inconsistent. It is often dependent on the traffic flow in the tunnel. In some countries, working groups from fire brigades, regulators, tunnel owners, and consultants are looking at the recommended choice of heat release rate for road tunnel application (PIARC 1999). Table 2.1 shows the heat release rate recommended in standards and committees related to tunnel fire design.
Standards / Guidelines NFPA 502 (2004) NFPA 502 (2008)
BD 78/99 CETU PIARC
Fire Load Fire heat
release rate (MW) Fire heat release rate (MW) Fire heat release rate (MW) Fire heat release rate (MW) Fire heat release rate (MW)
Passenger Car 5 5 -10 5 - 2.5
Bus 20 20 – 30 20 - 20
Van - - 15 15 15
Goods Truck 20 - 30 70 - 200 30 - 100 30 20 – 30
Tankers 100 200 - 300 - 200 -
Source (NFPA 502
Chapter 2 Tunnel ventilation system and design concepts
From Table 2.1, one can see that the heat release rate for light weight vehicles and buses are fairly consistent among these standards. However, the recommended heat release rate for heavy goods vehicles and tankers varies significantly. One reason may be due to inconsistent fire loads on these heavy goods vehicles and the lack of actual fire test data to establish these values.
2.4
Fire model as an analytical tools for road tunnel design
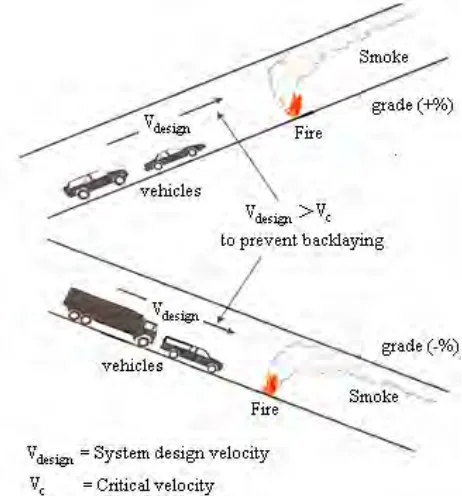
For longitudinal ventilation design, one of the tunnel ventilation design requirements is to ensure no smoke backlayering (Figure 2.7) occurs at the upstream of the fire. At low tunnel airflow where buoyancy induced flow from the fire is not overcome, this will result in the spread of smoke and hot gases in a direction opposite to the forced ventilation which is often termed as “backlayering”
Figure 2.7: Under ventilated fire causing Backlayering
Chapter 2 Tunnel ventilation system and design concepts
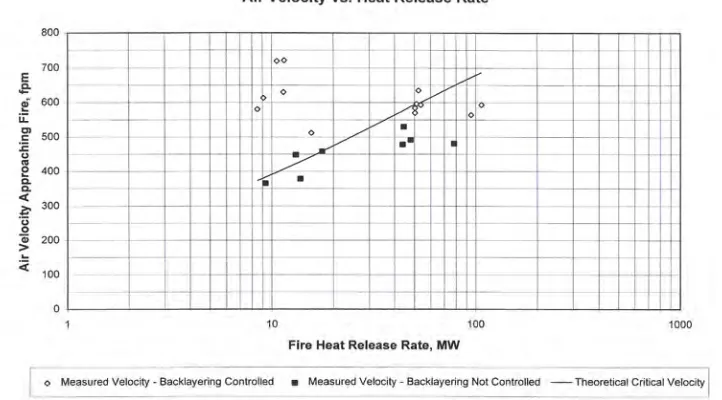
A feasible approach to control smoke is pushing it through the tunnel portal thereby creating a smoke free path for motorists trapped upstream to evacuate. The airflow necessary for such operation is known as the critical velocity (Figure 2.8). The critical velocity is a function of a number of factors which include the heat release rate, tunnel gradient and tunnel geometry. The theoretical critical velocity calculation is obtained from the following relationships (Bechtel and Brinckerhoff 1995):
3 / 1
1
= f T p g c T A c gHQ K K V
ρ Equation 2.1
3 / 1 1
−
=Frc
K Equation 2.2
8 . 0 ) ( 0374 . 0 1 grade
Kg = + Equation 2.3
T V A c Q T c T p
f = +
ρ Equation 2.4
Chapter 2 Tunnel ventilation system and design concepts
(example average values for air temperature and airflow) for the entire tunnel network system which may be a few kilometres in length. Using a field model for this type of analysis can be very time consuming and expensive. However, a field model is able to provide detailed results including temperature, smoke profiles, velocity (Figure 2.10), visibility and heat release rate, and therefore ideally suited for road tunnel analysis (Bendelius 2003).
Figure 2.9: A schematic diagram showing the airflow and temperature simulated using a
one dimensional model (SES)
Chapter 2 Tunnel ventilation system and design concepts
2.5
Tunnel slope and super-critical velocity
Due to buoyancy effects, smoke from a fire in a tunnel with no slope will naturally tend to propagate in both directions. In a tunnel with considerable slope, one influence during a fire can be due to the chimney effect (Riess et al 2001). If the ventilation is operating, the smoke will tend to be driven in the direction of the airflow (PIARC 1999).
[image:49.612.177.408.194.442.2]
Figure 2.11: Slope determination
According to Atkinson (1996), the design methods for smoke control systems are based on results from study of methane-rich roof layers experiment to predict the critical velocity in sloping tunnel. Equation 2.5 shows the correlation factor used in the US Department of Transport Subway Environment Simulation Program.
[
0.8]
) ( 0374 . 0 1 ) 0 ( )
(grade V grade
V = + Equation 2.5
where: