ORIGINAL RESEARCH
Normal Aging in the Basal Ganglia Evaluated by
Eigenvalues of Diffusion Tensor Imaging
Q. Wang X. Xu M. Zhang
BACKGROUND AND PURPOSE: The age effect on the diffusion pattern in the basal ganglia differs from that in the white matter. The main purpose of our study was to provide further insight into the change of water diffusion in the basal ganglia during human brain aging by using the eigenvalues of DTI.
MATERIALS AND METHODS:We examined 71 healthy subjects (mean age, 41.8⫾14.5 years; age
range, 20 –79 years). The values of MD, FA, and the eigenvalues1and23(23⫽[2⫹3] / 2) were determined in regions of the head of the caudate nucleus, putamen, globus pallidus, and in some regions of white matter. The age-dependence of these measurements was tested for statistical significance by using the Pearson correlation analysis.
RESULTS: A significant reduction of MD with aging was found in the head of caudate nucleus (r⫽ ⫺0.319,P⫽.007) and putamen (r⫽ ⫺0.410,P⬍.001), and an increase in FA with aging was found in the putamen (r⫽0.535,P⬍.001). Eigenvalue23showed a significant age-related decrease in the putamen (r⫽ ⫺0.451,P⬍.001) and the head of the caudate nucleus (r⫽ ⫺0.312,P⫽.008), but no significant changes of23were found in the globus pallidus. The results for eigenvalue1in the head of caudate nucleus (r⫽ ⫺0.299,P⫽.011) were close to statistical significance.
CONCLUSIONS:The eigenvalues provide more insights into the different diffusion patterns in the basal ganglia during human brain aging.
ABBREVIATIONS:ACPC ⫽anterior/posterior commissure; ADC⫽apparent diffusion coefficient; DTI⫽diffusion tensor imaging; EPI⫽echo-planar imaging; FA⫽fractional anisotropy; MD⫽mean diffusivity
D
uring human aging, the brain exhibits both macro- and microscopic alterations. With conventional MR imaging methods, there is a consensus on the aging-related reduction of the global or regional gray matter volume, with accelerated loss in some focal areas such as the prefrontal cortex.1-3The cerebral white matter exhibits various age-related degenera-tive changes, such as loss of axons and decreased myelin atten-uation or demyelination.2,4Although the age-related changesin both gray matter and white matter are at a global level, changes in white matter occur more prominently during cer-tain older ages.5,6
DTI, with its advantage of noninvasively providing a quan-titative assessment of the microscopic diffusion properties of water in living tissue, has been used to investigate and visualize tissue microstructure and orientation effectively, which was not accessible with conventional MR imaging. In white matter fibers, water diffuses faster along the direction parallel to the axons than it does in directions perpendicular to the axons. With such water diffusion anisotropy, DTI is a powerful and
unique tool for evaluating maturing and aging of the white matter.7,8Previous DTI studies on the relationship between
white matter degeneration and aging have demonstrated in-creased MD and reduced water diffusion anisotropy in some regions of white matter, especially in the genu of the corpus callosum and the deep prefrontal white matter.6,9-11However,
to our knowledge, investigations with DTI on age-related de-generative alterations in the cerebral gray matter are lacking.
In fact, anisotropic water diffusion depends on oriented barriers. The phenomenon of anisotropy is not unique to neu-ral fiber tracts but is also observed in other tissues, such as skeletal muscle, myocardium, and kidney. The degree of hin-drance to water diffusion is determined by the size, shape, and composition of any physical obstructions and the spacing be-tween these obstructions.12
In the human brain, the axonal membranes, myelin sheaths, cell membranes, and even the directional arrangement of cells can all constitute such ob-structions. The basal ganglia are composed of both gray matter and fibers. The volume of the striatum (putamen and caudate) is larger than that of the globus pallidus. The decreased trend of cerebral tissue volume from the cortex to the basal ganglia suggests a volumetric convergence. Pallidal neurons are much less numerous than striatal neurons; this difference suggests a numeric convergence.13The striatum consists mainly of spiny
neurons covered densely with dendritic spines. The pallidal neurons have a completely different morphology. They are larger, and the dendrites are sparsely branched.13The varia-tions of volume, neuronal numbers, and neuronal types be-tween the striatum and globus pallidus may result in different presentations of water diffusion and make DTI a suitable tool for studying age effects.
The parameters of ADC and FA are most commonly used as the markers of degeneration in white matter. The loss of Received June 9, 2009; accepted after revision August 3.
From the Department of Radiology, First Affiliated Hospital, School of Medicine, Zhejiang University, Hangzhou, China.
This work was supported by the National Research Foundation of China (No. 30570536) and the Research Foundation of the Health Bureau of Zhejiang Province (391010-I40824).
Paper previously presented in part at: Joint Annual Meeting of the International Society for Magnetic Resonance in Medicine⫺European Society for Magnetic Resonance in Medicine and Biology, May 19 –25, 2007; Berlin, Germany.
Please address correspondence to Mingming Zhang, MD, Department of Radiology, First Affiliated Hospital, School of Medicine, Zhejiang University, 79 Qing Chun Rd, Hangzhou 310003, China; e-mail: [email protected]
Indicates open access to non-subscribers at www.ajnr.org
axons and the decrease of myelin attenuation are some of the main explanations for the observation of decreased FA value with advanced aging.6,9-11The FA value, which is derived from
the SD of the 3 eigenvalues (1, 2, and3), represents an
overall anisotropy of water diffusivity and reflects the degree of alignment or integrity of cellular structures on the whole, but the 3 eigenvalues may differentiate the degree of diffusivity in each direction. A study of the corpus callosum in mouse brain demonstrated that the extent of increased or decreased diffusivity in2or3offered a specific assessment of
demyeli-nation or remyelidemyeli-nation. The results are distinct from acute axonal damage, which introduces a decreased1in the long
axis of axons.14The 3 eigenvalues both in gray and white
mat-ter all decrease during normal human brain maturation, but the main eigenvalue1shows less reduction.15These studies
suggest that the eigenvalues may provide a more direct marker of any directional changes of water diffusivity.
In this study, the age effects on water diffusivity of the basal ganglia were evaluated by eigenvalues along with MD and FA. We anticipated that eigenvalues could provide further insight into the changes of water diffusivity in the basal ganglia during human brain aging.
Materials and Methods
Subjects
DTIs were obtained from 71 healthy subjects (39 men, 32 women; mean age, 41.8⫾14.5 years; age range, 20 –79 years). All subjects were recruited from the local community (most were staff in our department, medical students, and their relatives). Written informed consent was obtained and approved by the research ethics committee of the hospital. The ex-clusion criteria included any history of neurologic or psychiatric disor-der, head trauma, or serious cardiovascular disease. Conventional MR images of all subjects were acquired and were examined by an experi-enced neuroradiologist to exclude any morphologic abnormalities in the brain. A high signal intensity on the T2-weighted imaging was frequently present in asymptomatic elderly participants. If the focal hyperintensity was⬎3 mm in diameter in 1 section, the subject was also excluded. The subjects whose images showed a few punctuate areas of hyperintensity were included because we considered these to be physiologic findings.
MR Imaging Protocols
All the MR imaging data were acquired by using a 1.5T scanner (Signa Excite II; GE Healthcare, Milwaukee, Wisconsin) equipped with an 8-channel neurovascular phased array coil. The conventional MR
im-aging examinations included the acquisition of T2-weighted sagittal images and both T1- and T2-weighted axial images. T2-weighted im-ages were acquired by using a fast recovery fast spin-echo sequence (TR/TE, 4000/85 ms; section thickness/section gap, 7.0/1.0 mm; FOV, 24⫻24 cm2; NEX, 2; matrix, 320⫻224), and T1-weighted images were acquired by using a fast inversion-recovery sequence (TR/TE, 2400/20 ms; TI, 650 ms; section thickness/section gap, 7.0/1.0 mm; FOV, 24⫻24 cm2; NEX, 2; matrix, 320⫻224). A single-shot spin-echo EPI sequence was used for DTI acquisition (TR/TE, 10,000/86 ms; section thickness/section gap, 3.0/0.0 mm; FOV, 24⫻24 cm2; NEX, 2; matrix, 128⫻128). Diffusion properties were measured along 15 diffusion directions with a b-value of 1000 s/mm2. To reduce eddy current distortions, DTI acquisition used a twice-refocused bal-anced echo. The total DTI acquisition time was 5 minutes 40 seconds at 32–36 transverse sections. All the transverse-section planes were positioned parallel to the ACPC line.
All the diffusion-weighted images were transferred to the work-station supplied by the manufacturer (Advantage Workwork-station 4.2; GE Healthcare). Before the diffusion tensor processing, the correction function was used to remove EPI distortions by scaling, de-skewing, and translating methods. Then, maps of FA and eigenvalues1,2, and3were generated on a voxel-by-voxel basis. The values of MD were calculated as follows:
MD⫽共1⫹2⫹3兲/3.
Regions of Interest
We chose to examine the diffusion properties by using the region-of-interest methodology. The values of FA and the eigenvalues1,2, and3were determined in regions of the head of the caudate nucleus, putamen, globus pallidus, and some white matter regions, including the posterior limb of the internal capsule, the genu and splenium of the corpus callosum, and the prefrontal white matter.
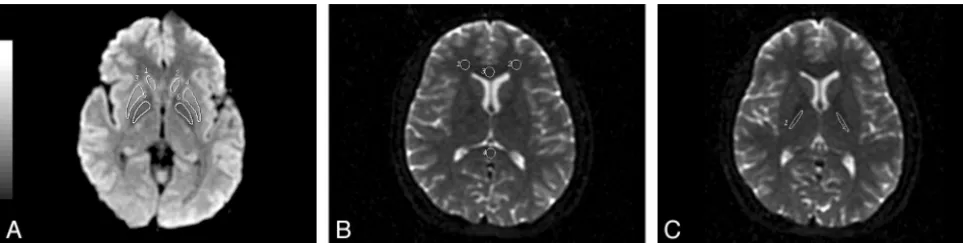
The regions of interest in the head of the caudate nucleus, puta-men, and globus pallidus were located on the first section above the ACPC line (Fig 1A). The other regions of interest were positioned on the section in which each anatomic structure was most conspicuous (Fig 1B, -C). Because the outlines of the head of the caudate nucleus, putamen, and globus pallidus were well differentiated in T2-weighted trace images, these regions of interest were defined manually in the basal ganglia as to their bilateral anatomic structures on T2-weighted trace images. The other regions of interest were then placed on the T2-weighted image (b⫽0). All the regions of interest were circular or elliptic with the same size of 50 mm2. All regions of interest were determined by the same operator, who was blinded to any informa-tion about the participants.
Fig 1.Depictions of regions of interest used in this study.A, T2-weighted trace image.BandC, T2-weighted images.A, Regions of interest are drawn in the head of the caudate nucleus (regions of interest 1 and 2), the putamen (regions of interest 3 and 4), and the globus pallidus (regions of interest 5 and 6).B, Regions of interest are drawn in the prefrontal white matter (regions of interest 1 and 2), the genu (region of interest 3), and the splenium (region of interest 4) of the corpus callosum.C, Regions of interest are drawn in regions of the poster limb of the internal capsule (regions of interest 1 and 2).
BRAIN
ORIGINAL
[image:2.594.54.536.42.163.2]Statistical Analysis
The values of FA and eigenvalues1,2, and3were measured at the left and right regions of the basal ganglia and the prefrontal white matter and also in regions of the genu and splenium of the corpus callosum. The averages of the values measured at the left and right regions are presented. The eigenvalue1represents the water diffusivity parallel to the axonal fibers, and the eigenvalues2and3refer to the diffusivity perpendicular to the fibers. In this study, the eigenvalues2and3were also averaged and presented as a single parameter:23⫽(2⫹3) / 2. In this way,1 referred to the axial diffusivity and23referred to the radial diffusivity. The age dependence of MD, FA,1, and23was tested for statistical significance by using the Pearson correlation analysis among all subjects. Values ofP⬍.01 were considered significant for all statistical tests, and those ofP⬍.05 were considered suggestive.
Results
With the Pearson correlation analysis, a reduction of MD with aging was found in the head of caudate nucleus (r⫽ ⫺0.319, P⫽.007) and putamen (r⫽ ⫺0.410,P⬍.001). The results of age-related changes of FA in the putamen showed an increase with aging (r⫽0.535,P⬍.001), but in the head of caudate nucleus, no significant correlation with FA was found. In the globus pallidus, FA presented a trend of increasing with age (r⫽0.276,P⫽.020). Pearson correlation analysis of eigen-value23showed an age-related decrease both in the putamen
(r⫽ ⫺0.451,P⬍.001) and the head of the caudate nucleus (r⫽ ⫺0.312,P⫽.008), whereas results for23in the globus
pallidus showed no significant change. The results for eigen-value1in the head of caudate nucleus (r⫽ ⫺0.299,P⫽.011)
were close to statistical significance. No significant alterations of1with age were found in the putamen or globus pallidus.
In contrast, the results in regions of white matter were greatly different from those in the basal ganglia. Age-related increases of MD were found in the prefrontal white matter (r⫽0.314,P⫽.008) and the genu of the corpus callosum (r⫽
0.319,P⫽.007). The results for FA in the prefrontal white matter (r⫽ ⫺0.391,P⫽.001) and the genu of the corpus callosum (r⫽ ⫺0.307,P⫽.009) showed reduction with ag-ing. The Pearson correlation analysis of eigenvalue23showed
an increase with aging in the prefrontal white matter (r⫽
0.403,P⬍.001) and the genu of the corpus callosum (r⫽
0.353,P⫽.003). In all regions of white matter, there were no significant or suggestive changes in1.
The values of MD, FA,1, and23in the selected regions
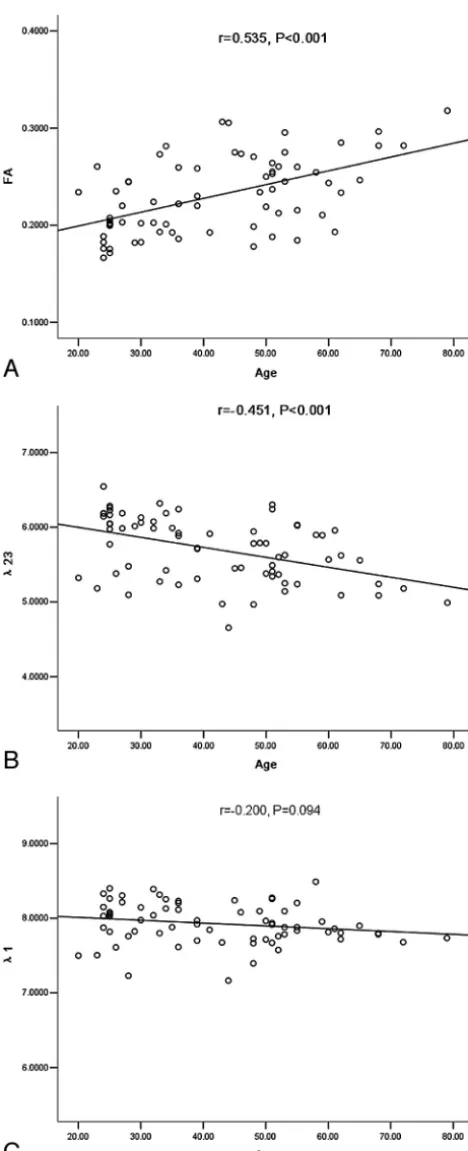
and the results of their Pearson correlation analysis are shown in the Table. The scatterplots of FA and eigenvalues1and23
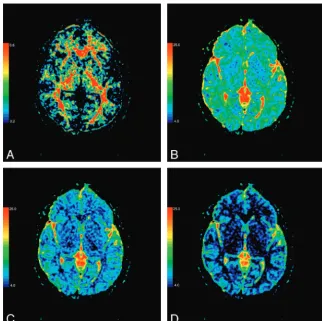
for correlation with aging in the putamen are presented in Fig 2. The color-coded FA,1,2, and3maps of the basal ganglia
are presented in Fig 3.
Discussion
Among the structures in the basal ganglia, the caudate nucleus and putamen have the same phylogenesis, but the globus pal-lidus develops later. Neurons in the caudate nucleus and pu-tamen have a spheric dendritic arborization, which is covered densely with dendritic spines. These allow water to diffuse freely in the caudate nucleus and putamen. In contrast, neu-ronal dendrites in the globus pallidus are long, smooth, and sparsely branched.13,16,17The fibers in the globus pallidus are
well protected by myelin, and some fibers are arranged in bun-dles. The motion of water diffusion is, therefore, more re-stricted and more directional in the globus pallidus and so may present a higher FA and lower MD. In this study, the FA was higher and the MD was lower in the globus pallidus than in the caudate nucleus and putamen, which well reflected the micro-structural properties of neurons in the basal ganglia.
The putamen is a structure in which FA increases with ad-vancing age.18-21In this study, we found the same result.
Al-though the recently published study by Pfefferbaum et al18 stated that the high FA in the putamen is correlated with iron deposition, there are few interpretations for the age-related increase of FA. In contrast to the microstructure of the white matter, the basal ganglia consist predominantly of neurons and glia. The interpretation of age-related changes of DTI metrics in the basal ganglia appears to be different from and more complicated than that in white matter.
Theoretically, the anisotropy index of FA is influenced by the axial (1) and radial (23) diffusivity. The increased FA
may result from increased axial diffusivity, decreased radial diffusivity, or both. In our study, the age-related increase of FA in the putamen resulted from the decreased eigenvalue23and
the relatively preserved1. Volume reduction with age due to
the loss of neurons in the striatum has been reported.1,22The
concurrent gliosis and tissue compaction during aging further obstruct water diffusion. The cell membranes of the remaining atrophic neurons become less fluid and stiffer with aging. These kinds of age-related changes add to the hindrance to water diffusion. Diffusivity in all directions could be affected, Mean values and Pearson correlations between age and DTI metrics in the basal ganglia (MD,1,23ⴛ10ⴚ
4mm2/s)
Region MD (Mean⫾SD) FA (Mean⫾SD) 1(Mean⫾SD) 23(Mean⫾SD)
Caudate 6.88⫾0.42, 0.24⫾0.03, 8.57⫾0.46, 6.03⫾0.43,
r⫽ ⫺0.319,P⫽.007 r⫽0.178,P ⫽.138 r⫽ ⫺0.299,P⫽.011 r⫽ ⫺0.312,P⫽.008 Putamen 6.45⫾0.36, 0.23⫾0.04, 7.93⫾0.27, 5.71⫾0.43,
r⫽ ⫺0.410,P⬍.001 r⫽0.535,P ⬍.001 r⫽ ⫺0.200,P⫽.094 r⫽ ⫺0.451,P⬍.001 Globus pallidus 6.00⫾0.49, 0.36⫾0.04, 8.16⫾0.42, 4.89⫾0.45,
r⫽ ⫺0.142,P⫽.238 r⫽0.276,P ⫽.020 r⫽ ⫺0.117,P⫽.329 r⫽ ⫺0.215,P⫽.072 Prefrontal 7.18⫾0.51, 0.35⫾0.05, 9.82⫾0.65, 5.86⫾0.56,
r⫽0.314,P⫽.008 r⫽ ⫺0.391,P⫽.001 r⫽0.053,P⫽.663 r⫽0.403,P⬍.001 Genu 6.98⫾0.65, 0.65⫾0.06, 12.97⫾1.19, 3.98⫾0.65,
r⫽0.319,P⫽.007 r⫽ ⫺0.307,P⫽.009 r⫽0.139,P⫽.249 r⫽0.353,P⫽.003 Splenium 6.77⫾0.67, 0.75⫾0.05, 14.16⫾1.51, 3.06⫾0.56,
r⫽ ⫺0.153,P⫽.202 r⫽ ⫺0.008,P⫽.946 r⫽ ⫺0.156,P⫽.194 r⫽ ⫺0.066,P⫽.585 Internal capsule 6.43⫾0.51, 0.69⫾0.04, 12.56⫾0.85, 3.36⫾0.46,
but notably the radial diffusivity presented decreasing change. Besides, the body of the striatum, especially the putamen, is a region with an abundant blood supply compared with other regions in the brain. The pseudodiffusion effect caused by blood motion may be enlarged, probably due to the abundant blood supply. The vessel wall experiences some hyaline degen-eration during aging. It becomes thicker and the water
diffu-sion through the wall becomes more difficult. This kind of age-related change in vessel walls may also contribute to the changes of23. In contrast to the high value of1in the white
matter, the1in the basal ganglia was low. The FA value was
then easily influenced by changes in23.
The caudate nucleus and putamen have the same types of neurons. It is likely that these neurons experience the same kinds of changes in water diffusion during brain aging. The eigenvalue23in the head of the caudate nucleus also
exhib-ited a negative correlation with aging, but FA showed no sig-nificant change. The main difference for FA was the difference of1between the 2 structures. In the putamen,1was
pre-served, while1of the caudate nucleus manifested an almost
significant age-related reduction. The1corresponded to
dif-fusivity in the long axis of the diffusion ellipsoid. Therefore, the loss of axons may be prominently reflected by the decrease of1. The caudate nucleus includes the associative functional
territory projecting to the prefrontal cortex. Volume analysis with conventional MR imaging has shown that the prefrontal cortex is vulnerable to advancing age.3,23DTI studies on
hu-man brain aging have also presented the phenomenon of lower FA selectively in the prefrontal white matter.6,9,10The
meaning of the result is open to the speculation that loss of fibers occurs in the caudate nucleus. Different from the func-tional territory in the caudate nucleus, the putamen mainly receives projections from the primary motor and premotor cortices. The tissue associated with primary motor function is thought to be relatively spared with aging. Accordingly,1in
the putamen appeared relatively stable. The speculation that the results for1in the 2 structures corresponded well to the
characteristic of functional territory is acceptable. Except for the eigenvalue1, the diffusion patterns in the caudate nucleus
and putamen had much in common.
Although FA in the globus pallidus exhibited an increasing trend, no significant difference in eigenvalues was found. The results are also in agreement with the smaller shrinkage of the volume of the globus pallidus during human brain aging.1,22
We focused our study on the basal ganglia, but we also included the corpus callosum, the internal capsule, and the prefrontal white matter. The main reason was that results in white matter regions provide a useful contrast to the basal ganglia. In this study, the relationship between23and aging
in the prefrontal white matter and the genu of the corpus cal-losum was significantly positive, while there was no statisti-cally significant change in1. The results indicated that the
age-related declines of FA in the prefrontal white matter and genu were caused mainly by the increased radial diffusivity and that demyelination and decreased myelin attenuation are the main changes in white matter during human brain aging. The results in the internal capsule, where none of the diffusion metrics showed age-related alterations, also supported the theory of spared aging effects in primary motor function.
Because of the region-of-interest method in this study, all values were acquired from only portions of each structure, so the results did not reflect the entire structure. To analyze the age-related changes at a relatively global level, we averaged the DTI values from the 2 hemispheres. In this way, the possible hemispheric asymmetry could be discarded.
The metrics of DTI are affected by the relatively lower sig-nal intensity–to-noise ratio and distortion of the diffusion
im-Fig 2.The scatterplots of FA (A) and eigenvalues23(B) and1(C) with aging in the
putamen (1,23:⫻10⫺ 4
mm2
[image:4.594.53.287.38.613.2]age. In this study, we used 15 diffusion directions. It is impor-tant to acquire robust determination of DTI metrics.24On the
other hand, the existing noise effect in every healthy volunteer was equal on the whole, so we suggest that the trend in metrics with advancing age remains strong.
Conclusions
The findings in this study suggest that there are different age-related water diffusion patterns in the basal ganglia than in the white matter, especially the putamen. The age-related changes of eigenvalues in the basal ganglia are related to the degenerative process in this region, which includes gliosis, tissue compaction, blood change, and even the varied vulnerability of different func-tional territories. The analysis of eigenvalues provides further in-sight into the description of microstructural changes.
References
1. Walhovd KB, Fjell AM, Reinvang I, et al.Effects of age on volumes of cortex, white matter and subcortical structures.Neurobiol Aging2005;26:1261–70 2. Good CD, Johnsrude IS, Ashbruner J, et al.A voxel-based morphometric study
of aging in 465 normal adult human brains.Neuroimage2001;14:21–36 3. Jernigan TL, Archibald SL, Fennema-Notestine C, et al.Effects of age on tissues
and regions of the cerebrum and cerebellum.Neurobiol Aging2001;22:581–94 4. Guttmann CR, Jolesz FA, Kikinis R, et al.White matter changes with normal
aging.Neurology1998;50:972–78
5. Ge Y, Grossman RI, Babb JS, et al.Age-related total gray matter and white matter changes in normal adult brain. Part 1. Volumetric MR imaging analy-sis.AJNR Am J Neuroradiol2002;23:1327–33
6. Salat DH, Tuch DS, Greve DN, et al.Age-related alterations in white matter microstructure measured by diffusion tensor imaging. Neurobiol Aging 2005;26:1215–27
7. Le Bihan D, Mangin JF, Poupon C, et al.Diffusion tensor imaging: concepts and applications.J Magn Reson Imaging2001;13:534 – 46
8. Mori S, Barker PB.Diffusion magnetic resonance imaging: its principle and applications.Anat Rec1999;257:102– 09
9. Abe O, Aoki S, Hayashi N, et al.Normal aging in the central nervous system: quantitative MR diffusion-tensor analysis.Neurobiol Aging2002; 23:433– 41
10. Sullivan EV, Pfefferbaum A.Diffusion tensor imaging and aging.Neurosci Biobehav Rev2006;30:749 – 61. Epub 2006 Aug 1
11. Nusbaum AO. Tang CY, Buchsbaum MS, et al.Regional and global changes in cerebral diffusion with normal aging.AJNR Am J Neuroradiol2001;22:136 – 42 12. Beaulieu C.The basis of anisotropic water diffusion in the nervous system: a
technical review.NMR Biomed2002;15:435–55
13. Yelnik J.Funtional anatomy of the basal ganglia.Mov Disord2002;17(suppl 3):15–21
14. Song SK, Yoshino J, Le TQ, et al.Demyelination increases radial diffusivity in corpus callosum of mouse brain.Neuroimage2005;26:132– 40
15. Mukherjee P, Miller JH, Shimony JS, et al.Diffusion-tensor MR imaging of gray and white matter development during normal human brain maturation.
AJNR Am J Neuroradiol2002;23:1445–56
16. Yelnik J, Francois C, Percheron G, et al. Morphological taxonomy of the neu-rons of the primate striatum.J Comp Neurol1991;313:273–94
17. Braak H, Braak E.Neuronal types in the striatum of man. Cell Tissue Res 1982;227:319 – 42
18. Pfefferbaum A, Adalsteinsson E, Rohlfing T, et al.Diffusion tensor imaging of deep gray matter brain structures: effects of age and iron concentration. Neu-robiol Aging2010;31:482–93 Epub 2008 May 29
19. Abe O, Yamasue H, Aoki S, et al.Aging in the CNS: comparison of gray/white matter volume and diffusion tensor data.Neurobiol Aging2008;29:102–16 20. Zhang YT, Zhang CY, Zhang J, et al.Age-related changes of normal adult brain
structure: analysed with diffusion tensor imaging. Chin Med J (Engl) 2005;118:1059 – 65
21. Bhagat YA, Beaulieu C.Diffusion anisotropy in subcortical white matter and cortical gray matter: changes with aging and the role of CSF-suppression.J Magn Reson Imaging2004;20:216 –27
22. Raz N, Rodrigue KM, Kennedy KM, et al.Differential aging of the human striatum: longitudinal evidence.AJNR Am J Neuroradiol2003;24:1849 –56 23. Raz N, Gunning FM, Head D, et al.Selective aging of the human cerebral cortex
observed in vivo: differential vulnerability of the prefrontal gray matter.Cereb Cortex1997;7:268 – 82
24. Jones DK.The effect of gradient sampling schemes on measures derived from diffusion tensor MRI: a Monte Carlo study.Magn Reson Med2004;51:807–15 Fig 3.The color-coded FA (A),1(B),2(C), and3(D) maps
[image:5.594.51.374.41.362.2]