ORIGINAL RESEARCH
Decrease in Leptomeningeal Ivy Sign on
Fluid-Attenuated Inversion Recovery Images after
Cerebral Revascularization in Patients with
Moyamoya Disease
M. Kawashima T. Noguchi Y. Takase Y. Nakahara T. Matsushima
BACKGROUND AND PURPOSE: The “ivy” sign that is identified on FLAIR images in patients with Moyamoya disease is considered to be leptomeningeal collaterals. The aim of our study was to evaluate the correlation between postoperative decrease in ivy sign and cerebral hemodynamic status in the bypass-established hemisphere.
MATERIALS AND METHODS: Twenty-two patients with Moyamoya disease were enrolled. Postopera-tive changes in the ivy sign on FLAIR images were examined in each patient after bypass surgery. The correlation between postoperative changes in the ivy sign and hemodynamic status was examined in 10 patients by using SPECT.
RESULTS: Of the 22 preoperative ivy-positive patients, 21 showed decreased ivy signs on the opera-tive side. Average intervals between the operation day and the date when the decreased or vanished ivy sign was first recognized were 157.6 days in patients who underwent direct bypass and 212.2 days in patients who underwent indirect bypass. A postoperative decrease in ivy signs was found to be significantly correlated with an improved hemodynamic status of the surgically treated hemisphere, resulting in a postoperative increase in regional vascular reserve and a decreased proportion of the misery perfusion area (P⬍.01).
CONCLUSIONS:Postoperative changes in the ivy sign can be used as a marker for identifying improved hemodynamics and also for testing the effectiveness of cerebral revascularization.
ABBREVIATIONS:ACZ ⫽acetylzolamide; CBF ⫽cerebral blood flow; FLAIR ⫽ fluid-attenuated inversion recovery; Inf ⫽ inferior; 123I-IMP ⫽ iodine-123-N-isopropyl-p-iodoamphetamine; IV ⫽ intravenous; JET⫽Japanese Extracranial-Intracranial Bypass Trial; L⫽left; Lt Lat⫽left lateral; MCA⫽ middle cerebral artery; MRA⫽ MR angiography; MRI ⫽ MR imaging; PET ⫽ positron-emission tomography; postope.⫽ postoperative; preope.⫽ preoperative; R⫽ right; Rt Lat⫽right lateral; STA-MCA⫽superficial temporal artery⫺middle cerebral artery; rCBF⫽regional CBF; Rest⫽resting; rVR⫽regional VR; SPECT⫽single-photon emission CT; Sup⫽superior; VR⫽vascular reserve
T
he “ivy” sign refers to a diffuse leptomeningeal enhance-ment observed on postcontrast MR images of patients with Moyamoya disease in childhood.1It can also be observed onFLAIR images of a child with Moyamoya disease.2On FLAIR
sequences, the ivy sign has been defined as a continuous linear or punctate leptomeningeal high signal intensity along the cortical sulci and subarachnoid space.3 This enhancement
mechanism is considered to represent a retrograde slow flow of engorged pial vasculature toward an ischemic area via lep-tomeningeal collaterals.1-4We recently reported that unilat-eral hemispheric ivy proliferation is highly correlated with an ipsilateral decrease in VR that is associated with the develop-ment of leptomeningeal collaterals in patients with Moya-moya disease.3In addition, ivy proliferation was found to de-crease in 10 of 18 patients (55.6%) who underwent bypass surgery during the follow-up period.3
The aim of our study was to evaluate postoperative changes
in ivy signs on FLAIR after cerebral revascularization and to correlate a decrease in ivy signs with postoperative hemo-dynamic status in the bypass-established hemisphere, focus-ing especially on VR, which was measured by123I-IMP SPECT
with ACZ challenge in patients with Moyamoya disease.
Materials and Methods
Patients
During⬎2.5 years, 22 patients who presented with transient ischemic attacks (n⫽17), headache (n⫽2), involuntary movement (n⫽1), or no symptoms (n⫽2) were diagnosed with Moyamoya disease at our institution. Eleven female (average age, 25.8 years; range, 7– 66 years) and 11 male (average age, 24 years; range, 7– 61 years) patients were included in this study. In all patients, either indirect (encephaloduro-arteriosynangiosis) or direct STA-MCA bypass was performed on the hemisphere where cerebral VR decreased without a major infarction. Ten patients (6 women and 4 men; average age, 42.4 years) had direct bypasses and 12 (5 females and 7 males; average age, 10.3 years) had indirect bypasses. The postoperative follow-up period ranged from 41 to 425 days (average, 184.9 days).
Imaging Examinations
Imaging examinations, including MR imaging and MRA, were per-formed in each patient pre- and postoperatively. Ten of 22 patients
Received January 15, 2010; accepted after revision March 15.
From the Departments of Neurosurgery (M.K., Y.T., Y.N., T.M.) and Radiology (T.N.), Faculty of Medicine, Saga University, Saga, Japan.
Please address correspondence to Masatou Kawashima, MD, PhD, Department of Neuro-surgery, Faculty of Medicine, Saga University, 5-1-1 Nabeshima, Saga 849-8501 Japan; e-mail: [email protected]
DOI 10.3174/ajnr.A2124
BRAIN
ORIGINAL
underwent quantitative SPECT with ACZ challenge pre- and post-operatively. Then, the correlation between a decrease in the ivy sign in the surgically treated hemisphere after cerebral revascularization and postoperative hemodynamic status was examined in 10 patients.
MR Imaging and MRA
The routine MR imaging protocol for cerebral ischemic diseases in-cludes FLAIR imaging. MR imaging was performed by using a 3T MR imaging unit (MAGNETOM Trio, A Tim System; Siemens, Erlangen, Germany) without variability. FLAIR imaging was performed by us-ing a fast FLAIR sequence with a TR of 9000 ms, a TEeffof 86 ms, a TI
of 2500 ms, a 241-Hz/pixel bandwidth, and a flip angle of 150°. Image thickness, gap, and matrix for all sequences were 6.0 mm, 1.2 mm, and 384⫻372 pixels, respectively. 3D time-of-flight MRA was performed with a TR of 22 ms, a TE of 3.1 ms, a 250-Hz/pixel bandwidth, and a flip angle of 18°. Voxel size was 0.52⫻0.52⫻0.8 mm, and the acquisition matrix was 384⫻320 pixels.
An ivy sign on a FLAIR image was defined as a continuous linear or punctate leptomeningeal high signal intensity along the cortical sulci and subarachnoid space. Two neuroradiologists retrospectively reviewed MR images for ivy signs on FLAIR. A hemisphere was de-fined as ivy-positive when an ivy sign was observed in the MCA region (in any of the frontal, temporal, and parietal lobes). The degree of the ivy sign (ivy sign score) in the MCA region was classified into 3 grades (0 –2): Grade zero indicated an absence of the ivy sign, grade 1 indi-cated that the ivy sign was seen on less than half of the cortical surface in the region, and grade 2 indicated that the ivy sign was seen on more than half of the cortical surface. The ivy sign was scored subjectively by reviewing all the FLAIR images traversing all the cerebral hemi-spheres. The average score for each region was defined as the ivy sign score for the individual hemisphere. The score of the ivy sign was compared pre- and postoperatively among patients with Moyamoya disease. Postoperative MR imaging was performed during the first 3 months after surgery and every 6 month after that.
Quantitative Estimation of CBF and VR
A SPECT Multispect 3 scanner (Siemens) and an ICON image pro-cessor (Siemens Medical Systems) were used, with a low-energy ultra-high-resolution fan-beam collimator (225 cpm/Ci). The conditions for acquisition were as follows: 20-minute acquisition (40 seconds/ 90 steps, 3° step; the step and shoot method), a matrix of 128⫻128 pixels (2.89 mm/pixel), and a rotation radius of 13.9 cm. A filtered back-projection method by using a Butterworth filter was used to reconstruct images from 20-minute data. A low-pass filter (cutoff, 0.3 cycles/cm; order, 5.0) was used as the 3D postfilter. Two SPECT images were summated to obtain a section thickness of 5.78 mm.
Ten patients underwent 2 SPECT sessions: a basal study and an ACZ-challenged study. Both rCBF and VR were quantified by auto-radiographic processing of a single SPECT scan with a 1-point arterial blood sample (the IMP-ARG method).5Patients were allowed to rest
in a quiet dimly lit room and were injected with IV 123I-IMP,
166.5 MBq. Ten minutes after starting123I-IMP infusion, an arterial
blood sample was collected to calibrate the previously determined standard input function, and its whole-blood radioactivity concen-tration was counted by using a well counter that had been cross-calibrated with the SPECT scanner. After arterial blood sampling, a single SPECT scan was obtained at a midscan time of 10 minutes. Basal images were obtained 35 minutes after injecting the radiotracer. In 2-compartment123I-IMP analysis, the distribution volume (ie, the
ratio of influx constant and efflux constant) was set to a constant value
(41.2 mL/mL). rCBF maps were calculated pixel by pixel from single SPECT data, and the standard input function was calibrated with a 1-point arterial blood sample.5
Several days later (3–5 days), the patients were consecutively placed in an environment similar to that of the first session and were injected with 1-g IV ACZ (Diamox) during a 1-minute period. Fifteen minutes later, the patients were injected with123I-IMP and
ACZ-challenged images were obtained in a manner similar to that followed in the basal study. An automated region-of-interest-setting method by using NEUROSTAT (http://128.95.65.28/⬃Download) was per-formed without losing individual morphologic information in the SPECT images.6,7To objectively classify the severity of hemodynamic
ischemia according to the JET study protocol of patients with intra-cranial occlusive disease,8we performed a quantitative analysis by
using 3D stereotactic surface projections analytical software (3D-SSP; Nihon Medi-physics, Tokyo, Japan) and stereotactic extraction esti-mation display software (SEE-JET; Nihon Medi-physics).9 This
method provides 3D displays of VR, the severity of hemodynamic brain ischemia, and CBF at rest and after Diamox challenge.
The measurements obtained with SPECT are not actually quan-titative because true quanquan-titative assessment of CBF requires the ap-plication of the Fick principle, as originally applied with the use of nitrous oxide by Kety and Schmidt10and currently applied with PET
and the use of15O-labeled CO
2and water.rVR was defined as the
ratio of the difference between Diamox-activated rCBF and resting rCBF to resting rCBF (Diamox-activated rCBF / resting rCBF⫺ 1[⫻100]%). Resting rCBF and rVR of the MCA territory were evalu-ated in the hemispheres in all patients. The severity of hemodynamic brain ischemia was classified into 3 stages: stage 0 (resting CBF⬎15 mL/ 100 g/min and VR⬎30%), stage I (34 mL/100 g/min [80% of nor-mal CBF]⬎resting CBF⬎15 mL/100 g/min and 30%⬎VR⬎10%), and stage II (34 mL/100 g/min⬎resting CBF⬎15 mL/100 g/min and 10%⬎VR⬎ ⫺30%).8,9The stage II area was identical to the misery
perfusion area. Finally, the proportion of stage II area to hemisphere and mean rVRs in MCA territories were compared pre- and post-operatively between surgically treated and contralateral (nonsurgi-cally treated) hemispheres.
Statistical Analysis
Statistical analysis was performed by using the pairedttest to analyze the variance between the decreased ivy sign and contralateral hemi-spheres. A Studentttest was performed to analyze the difference between direct and indirect bypass procedures. The difference was considered significant atP⬍.05.
Results
Postoperative Changes in the Presence of Ivy Signs in Moyamoya Disease
(range, 47–303 days) in patients who underwent direct bypass and 212.2 days (range, 41– 425 days) in patients who under-went indirect bypass. There was no significant difference be-tween the 2 groups (P⬎.05). Postoperative courses of all patients were uneventful.
Ivy signs on FLAIR images of the nonaffected side were observed in 18 of 22 patients with Moyamoya disease exam-ined preoperatively. A postoperative ivy sign was unchanged in all patients.
Postoperative Decrease in Ivy Signs and Cerebral Hemodynamics
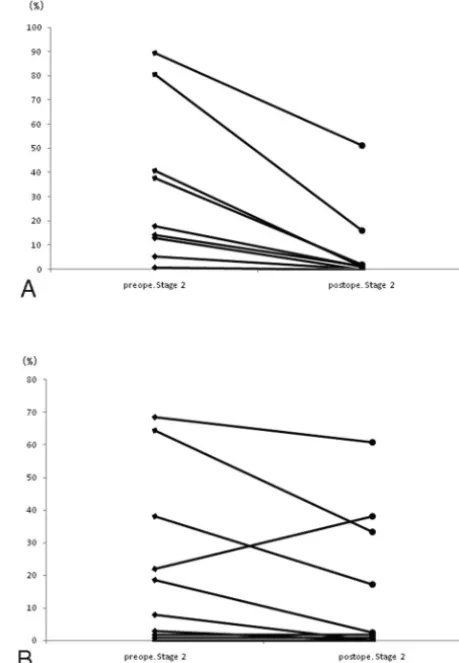
Of the 21 patients in whom ivy signs decreased or disappeared, 10 underwent a quantitative SPECT examination. Postopera-tive rVR increased in all patients in the hemisphere in which cerebral revascularization was established (Fig 1A). The in-creased rVR rate was significantly higher in the bypass-established hemisphere than that in the contralateral hemi-sphere (P⫽.0018). The pre- and postoperative rVRs were 5.08⫾11.82% and 43.27⫾46.34% in the bypass-established hemisphere, respectively. Postoperative rVR increased in 6 pa-tients and decreased in 4 papa-tients on the contralateral hemi-sphere (Fig 1B). Pre- and postoperative rVRs were 31.06⫾ 36.11% and 37.25⫾44.99%, respectively. The proportion of the stage II area in the bypass-established hemisphere was sig-nificantly lower than that in the contralateral hemisphere (P⫽
.0088, Fig 2A, -B). Pre- and postoperative proportions of stage
II areas in the bypass-established hemisphere were 30.04⫾ 32.23% and 7.27⫾16.19%, whereas those in the contralateral hemisphere were 22.66⫾26.06% and 15.52⫾21.55%, re-spectively. This was true for patients treated either by direct or indirect bypass (Figs 3 and 4).
Discussion
The present study had 2 major findings. First, the decrease in the ivy sign on the bypass-established hemisphere was associ-ated with an improved hemodynamic status, resulting in an increased postoperative rVR and a decreased proportion of the misery perfusion area. Second, direct or indirect cerebral revascularization procedures were effective for decreasing the ivy sign in patients with Moyamoya disease.
Knowledge of secondary collaterals remains unclear, largely because of limitations in the methods for evaluating these diminutive CBF routes. Direct visualization of collaterals is limited to angiographic methods, including conventional angiography, transcranial Doppler, CT, angiography, and MRA. The ivy sign, which is identical to a hyperintense vessel on FLAIR images, is frequently observed in a hemisphere af-fected by an acute arterial occlusion.11-14Stationary blood and
anterograde or retrograde leptomeningeal collateral circula-tion have been suggested as possible explanacircula-tions for the ivy sign.3,4,11,14,15Because secondary collateral pathways are
pre-sumed to be recruited once primary collaterals at the circle of
Fig 1.Postoperative change in rVR in the bypass-established hemisphere. The increased
rVR rate is significantly higher on the bypass-established hemisphere (A) than that on the contralateral hemisphere (B) (P⫽.0018).
Fig 2.Postoperative change in the misery perfusion area in the bypass-established
[image:3.594.297.527.45.377.2] [image:3.594.56.286.47.373.2]Willis have failed, the presence of secondary collateral path-ways is possibly considered a marker for impaired cerebral hemodynamics.16,17Furthermore, an ivy sign on FLAIR can
be observed in patients with chronic vascular diseases. Two recent studies, 1 of which includes the study reported by our group, revealed that the existence of an ivy sign on a FLAIR image in patients with Moyamoya disease is associated with decreased cerebral VR and development of leptomeningeal collaterals.3,4In Moyamoya disease, secondary collaterals are well-developed due to failure of primary collaterals. The re-cruitment of secondary collaterals is required to supply arte-rial blood to the ischemic area that has impaired cerebral hemodynamics.
In the present study, the presence of an ivy sign on the surgically treated hemisphere decreased after bypass surgery, supporting the idea that a secondary collateral pathway is pos-sibly associated with impaired cerebral hemodynamics. In fact, rVR increased and the proportion of misery area de-creased postoperatively in the surgically treated hemisphere, as shown by SPECT analysis. Postoperative rVR, increased in 6 patients and decreased in 4 patients on the contralateral hemi-sphere, may represent an indirect demonstration of the fact that CBF evaluation by SPECT is semiquantitative, showing a wide variability in the vascular capacity of the contralateral hemisphere, which is used as the normal control with this technique.
Ten of 21 patients underwent a SPECT examination. There was no selection bias. It was preferred that children and pa-tients living a long distance from the hospital receive the 1-day method (semiquantitative SPECT analysis). So far, the post-operative hemodynamics of surgically treated hemispheres in patients with Moyamoya disease have been evaluated mainly by SPECT or PET. If a decrease in the ivy sign after bypass surgery implies improved hemodynamics, it would be easier for us to speculate on a patient’s condition.
In our institution, a multiple combined indirect non-anastomotic procedure is recommended as an appropriate surgical option for treating children with Moyamoya disease, though the best treatment is STA-MCA anastomosis with en-cephalomyosynangiosis, if feasible.18STA-MCA direct
anas-tomosis is performed for most adult patients with Moyamoya disease because of suitable donor and recipient arteries; how-ever, the appropriate technique to induce neovascularization is controversial.18,19The present study revealed that the
aver-age intervals between the operation day and the date when the decreased or vanished ivy sign was first recognized in the 2 groups were not significantly different. It may take some time to revascularlize CBF by using an indirect bypass procedure. Direct or indirect cerebral revascularization can be an effective option for patients with Moyamoya disease and impaired hemodynamics.
Conclusions
A postoperative decrease in the ivy sign on a FLAIR image reflected an improvement in the impaired cerebral hemo-dynamic status in patients with Moyamoya disease. A change in the postoperative ivy sign, giving careful consideration to a patient’s symptoms, can be a marker for identifying the effec-tiveness of cerebral revascularization.
References
1. Ohta T, Tanaka H, Kuroiwa T.Diffuse leptomeningeal enhancement, “ivy sign,” in magnetic resonance images of Moyamoya disease in childhood: case report.Neurosurgery1995;37:1009 –12
2. Maeda M, Tsuchida C.“Ivy sign” on fluid-attenuated inversion-recovery im-ages in childhood Moyamoya disease.AJNR Am J Neuroradiol 1999;20: 1836 –38
3. Kawashima M, Noguchi T, Takase Y, et al.Unilateral hemispheric prolifera-tion of ivy sign on FLAIR image in Moyamoya disease correlates highly with ipsilateral hemispheric decrease of cerebrovascular reserve.AJNR Am J Neu-roradiol2009;30:1709 –16
4. Mori N, Mugikura S, Higano S, et al.The leptomeningeal “ivy sign” on fluid-attenuated inversion recovery MR imaging in Moyamoya disease: a sign of decreased cerebral vascular reserve?AJNR Am J Neuroradiol2009;30:930 –35 5. Iida H, Itoh H, Nakazawa M, et al.Quantitative mapping of regional cerebral
blood flow using iodine-123-IMP and SPECT.J Nucl Med1994;35:2019 –30 6. Ogura T, Hida K, Masuzuka T, et al.An automated ROI setting method using
NEUROSTAT on cerebral blood flow SPECT images.Ann Nucl Med2009;23: 33– 41. Epub 2009 Feb 11
7. Minoshima S, Berger KL, Lee KS, e al.An automated method for rotational correction and centering of three-dimensional functional brain images.
J Nucl Med1992;33:1579 – 85
8. JET Study Group.Japanese EC-IC Bypass Trial (JET study): study design and interim analysis.Surg Cereb Stroke2002;30:97–100
9. Mizumura S, Nakagawara J, Takahashi M, et al.Three-dimensional display in staging hemodynamic brain ischemia for JET study: objective evaluation using SEE analysis and 3D-SSP display.Ann Nucl Med2004;18:13–21 10. Kety SS, Schmidt CF.The nitrous oxide method for the quantitative
de-termination of cerebral blood flow in man: theory, procedure and normal values.J Clin Invest1948;27:476 – 83
11. Noguchi K, Ogawa T, Inugami A, et al.MRI of acute cerebral infarction: a comparison of FLAIR and T2-weighted fast spin-echo imaging. Neuroradiol-ogy1997;39:406 –10
12. Cosnard G, Duprez T, Grandin C, et al.Fast FLAIR sequence for detecting major vascular abnormalities during the hyperacute phase of stroke: a comparison with MR angiography.Neuroradiology1999;41:342– 46 13. Gauvrit JY, Leclerc X, Girot M, et al.Fluid-attenuated inversion recovery
(FLAIR) sequences for the assessment of acute stroke: inter observer and inter technique reproducibility.J Neurol2006;253:631–35. Epub 2005 Dec 13 14. Maeda M, Yamamoto T, Daimon S, et al.Arterial hyperintensity on fast
fluid-attenuated inversion recovery images: a subtle finding for hyperacute stroke undetected by diffusion-weighted MR imaging.AJNR Am J Neuroradiol 2001;22:632–36
15. Sanossian N, Saver JL, Alger JR, et al. Angiography reveals that fluid-attenuated inversion recovery vascular hyperintensities are due to slow flow, not thrombus.AJNR Am J Neuroradiol2009;30:564 – 68
16. Liebeskind DS.Collateral circulation.Stroke2003;34:2279 – 84
17. Girot M, Gauvrit JY, Cordonnier C, et al.Prognostic value of hyperintense vessel signals on fluid-attenuated inversion recovery sequences in acute cerebral ischemia.Eur Neurol2007;57:75–79
18. Matsushima T, Inoue T, Suzuki SO, et al.Surgical treatment of Moyamoya disease in pediatric patients: comparison between the results of indirect and direct revascularization procedures.Neurosurgery1992;31:401– 05 19. Houkin K, Kuroda S, Ishikawa T, et al.Neovascularization (angiogenesis) after