ORIGINAL RESEARCH
ADULT BRAIN
Assessing Postconcussive Reaction Time Using Transport-Based
Morphometry of Diffusion Tensor Images
XS. Kundu,XA. Ghodadra,XS. Fakhran,XL.M. Alhilali, andXG.K. Rohde
ABSTRACT
BACKGROUND AND PURPOSE:Cognitive deficits are among the most commonly reported post-concussive symptoms, yet the under-lying microstructural injury is poorly understood. Our aim was to discover white matter injury underunder-lying reaction time in mild traumatic brain injury DTI by applying transport-based morphometry.
MATERIALS AND METHODS: In this retrospective study, we performed DTI on 64 postconcussive patients (10 –28 years of age; 69% male, 31% female) between January 2006 and March 2013. We measured the reaction time percentile by using Immediate Post-Concussion Assessment and Cognitive Testing. Using the 3D transport-based morphometry technique we developed, we mined fractional anisotropy maps to extract the common microstructural injury associated with reaction time percentile in an automated manner. Permutation testing established statistical significance of the extracted injuries. We visualized the physical substrate responsible for reaction time through inverse transport-based morphometry transformation.
RESULTS:The direction in the transport space most correlated with reaction time was significant after correcting for covariates of age, sex, and time from injury (Pearsonr⫽0.44,P⬍.01). Inverting the computed direction using transport-based morphometry illustrates physical shifts in fractional anisotropy in the corpus callosum (increase) and within the optic radiations, corticospinal tracts, and anterior thalamic radiations (decrease) with declining reaction time. The observed shifts are consistent with biologic pathways underlying the visual-spatial interpretation and response-selection aspects of reaction time.
CONCLUSIONS: Transport-based morphometry discovers complex white matter injury underlying postconcussive reaction time in an automated manner. The potential influences of edema and axonal loss are visualized in the visual-spatial interpretation and response-selection pathways. Transport-based morphometry can bridge the gap between brain microstructure and function in diseases in which the structural basis is unknown.
ABBREVIATIONS:FA⫽fractional anisotropy; ImPACT⫽Immediate Post-Concussion Assessment and Cognitive Testing; mTBI⫽mild traumatic brain injury; TBM⫽transport-based morphometry
C
ognitive deficits are among the most commonly reported symptoms after mild traumatic brain injury (mTBI).1-6Bothtransient and persistent deficits in processing speed, attention, and working memory are associated with mTBI.7Furthermore,
persistent cognitive deficits may accelerate aging-related cogni-tive decline.2Yet, despite its ubiquity, the microstructure
under-lying postconcussive cognitive deficit is difficult to assess. Routine CT and MR imaging findings are often negative. Although diffu-sion tensor imaging can capture diffuse white matter injury,8
mTBI is still diagnosed clinically because damage is subtle and spatially diffuse.7,9The microstructural injury is challenging to
Received December 26, 2018; accepted after revision April 27, 2019.
From the Department of Biomedical Engineering, Electrical and Computer Engi-neering (G.K.R.), University of Virginia, Charlottesville, Virginia; Department of Bio-medical Engineering at Carnegie Mellon University and Medical Scientist Training Program (S.K.), University of Pittsburgh Medical Center, Pittsburgh, Pennsylvania; Department of Radiology (A.G.), Banner Health and Hospital Systems, Mesa, Ari-zona; and Department of Neuroradiology (S.F.), Barrow Neurological Institute, Phoenix, Arizona. Dr Alhilali is currently at the Department of Internal Medicine, University of Pittsburgh Medical Center, Pittsburgh, Pennsylvania.
This work was supported, in part, by the National Science Foundation award CCF 1421502 and National Institutes of Health awards GM130825 and GM090033.
A subset of these results was presented at: Radiological Society of North Amer-ica’s Scientific Assembly and Annual Meeting: “Transport-Based Morphometry of Diffusion Tensor Images for Assessment of Postconcussive Reaction Time.” No-vember 27 to December 2, 2016; Chicago, Illinois.
Please address correspondence to Shinjini Kundu, MD, PhD, Medical Scientist Training Program, University of Pittsburgh/Carnegie-Mellon University, 526 Scaife Hall, 3550 Terrace St, Pittsburgh, PA 15261; e-mail: shk71@pitt.edu; @ShinjiniKundu
Indicates open access to non-subscribers at www.ajnr.org
Indicates article with supplemental on-line appendix.
Indicates article with supplemental on-line photos.
distinguish from a background of normal anatomic variability and accumulated insults with time.10
Given its complexity, traditional analysis has permitted only a limited view of the microstructural perturbations. Conventional methods have sought to index injuries to individual tracts (ie, ROI analysis; Tract-Based Spatial Statistics, TBSS; http://fsl.fmrib.ox.ac. uk/fsl/fslwiki/TBSS; and so forth) or individual voxels (ie, voxel-based analysis, potholes and molehills analysis, and so forth).7,10,11
However, techniques treating each voxel or ROI as an independent variable cannot provide adequate insight into the interconnectedness of injuries across multiple regions as a function of cognition.6,7
Fur-thermore, visual inspection is particularly insensitive to subtle- but-interconnected biophysical shifts in tissue architecture.12
In our prior work, we developed 3D transport-based morphom-etry (TBM) as a technique to assess complex physical changes in brain tissue that may be undetectable by visual inspection.13By
com-puting the effort needed to morph the brain tissue distribution in one image into another, TBM statistically mapped joint interaction across multiple brain regions.13Unlike traditional approaches, TBM
could explain the relevant microstructural shifts underlying the clin-ical assessment visually because it is a generative technique.13
Fur-thermore, TBM can discover the common substrate underlying re-action time in a fully automated manner.6,7
This study investigated the brain microstructure associated with postconcussive reaction time, one of the most frequently reported cognitive deficits after mTBI.1,3.4,14,15Given new interventions such
as exercise rehabilitation,16,17it is crucial to identify objective
sub-strates underlying postconcussive cognition to assess progress in treatment and understand repair mechanisms. Particularly, studying the acute and postacute phases of recovery could reveal new targets for early treatment monitoring. TBM has never before been applied to investigate white matter injury associated with postconcussive cognition. Given the known limitations of traditional techniques, we hypothesize that if a common structural substrate underlying post-concussive reaction time exists, it can be uncovered using TBM.
MATERIALS AND METHODS
Subject CohortIn this retrospective study, institutional review board approval was obtained, and informed consent was waived. The electronic medical record was searched for DTI studies performed for mTBI between January 1, 2006, and March 1, 2013, at the University of Pittsburgh Medical Center. Studies were identified using keywords “concus-sion,” “mild traumatic brain injury,” and “diffusion tensor imaging.” Inclusion criteria were the following: 10 –50 years of age, witnessed closed head trauma, no focal neurologic deficit, loss of consciousness of⬍1 minute, posttraumatic amnesia of⬍30 minutes, English lan-guage proficiency, and available neurocognitive testing with Imme-diate Post-Concussion Assessment and Cognitive Testing (ImPACT; https://scipol.duke.edu/track/immediate-post-concussion-assessment-and-cognitive-testing-impact). Exclusion criteria were the following: prior neuropsychiatric illness (2 patients), abnor-mal CT or conventional brain MR imaging findings including large focal abnormalities such as encephalomalacia not attribut-able to current trauma (3 patients), history of substance abuse (3 patients), lack of DTI (4 patients), lack of neurocognitive assess-ment (6 patients), total symptom score of zero (3 patients), and
inability to align fractional anisotropy (FA) images (2 patients). The cohort included patients in the immediate (n⫽13), acute (n⫽30), subacute (n⫽10), and chronic (n⫽11) phases of injury (acute, 1– 6 weeks; subacute, 7–12 weeks; chronic,⬎12 weeks).18
The final cohort contained 64 subjects. A prior article11used this
cohort to examine postconcussive headache. Demographic infor-mation and causes of injury are summarized inTable 1. Unlike voxel-based analysis or ROI techniques used in prior studies, we evaluated postconcussive reaction time using the TBM technique to enable both discovery and visualization of novel structural substrate.
A neuropsychological examination was performed by a single neuropsychologist with⬎15 years of experience in treating pa-tients with mTBI. Reaction time was determined as part of the ImPACT.19 Although ImPACT included other cognitive
mea-sures, this study focused on reaction time, one of the most com-mon postconcussive cognitive sequelae20and a sensitive marker
of recovery following concussion.20,21ImPACT reaction time for
each subject is a percentile based on normative data from baseline testing of⬎17,000 athletes as part of presport participation. Per-centile information accounts for both sex and age.
MR Imaging Acquisition and Preprocessing
All subjects underwent an identical imaging protocol on the same system during the imaging time period. DTI was performed with a 1.5T unit (Signa; GE Healthcare, Milwaukee, Wisconsin) and a stan-dard head coil. A single-shot echo-planar sequence was used (TR⫽ 4000 ms, TE⫽80 ms, NEX⫽2, section thickness⫽5 mm, matrix⫽ 128⫻128, FOV⫽260 mm). Diffusion gradients were set in 25 noncollinear directions using 2 b-values (b⫽0 and 1000/mm2).
FA maps were generated to characterize white matter integrity using the Brain Diffusion Toolbox,22,23which is part of the DTI
pipe-line of FSL.24,25The FA maps included both gray and white matter
and were registered to the Montreal Neurological Institute atlas by a 12-parameter affine transformation. A common reference image was computed through the Euclidean average of all images across the study population.
Analyzing FA Spatial Distribution Using Transport-Based Morphometry
The microstructure differentiating high and low reaction time was not perceptible visually as demonstrated inFig 1, motivating the use of TBM13,26-28to discover the complex pattern. Our
3D-TBM technique13is an image-transformation framework that
fa-Table 1: Demographic information and causes of injury
Participant Characteristics
Number of Participants Demographics
Age, time of imaging (range) (mean) (yr) 10–28 (16.1⫾2.9) Male participants (%) 44 (68.8) Time from injury to imaging (mean) (days) 55⫾91 Causes of mTBI
Sports injury (%) 42 (65.6%)
Motor vehicle collision (%) 6 (9.4%)
Bicycle accident (%) 2 (3.1%)
Fell down stairs (%) 2 (3.1%)
Fell off horse (%) 2 (3.1%)
Othera(%) 10 (15.6%)
a
[image:2.594.301.532.56.191.2]cilitates the discovery of this pattern through analysis in a trans-form domain.26-28On-line Fig 1 illustrates the system diagram in
the On-line Appendix. The interested reader is referred to Kundu et al13for the mathematic derivation of 3D-TBM. We provide
only a brief description here.
The similarity in the FA spatial distribution with respect to a reference is quantified in a transport map for each subject: a vec-tor field morphing an individual FA image into the common ref-erence. The optimal transport map minimizes FA transport to match the common reference. On-line Fig 2 shows FA maps and corresponding transport maps for 4 sample subjects.
The optimal transport map is unique for a pair of images,13
en-suring a bijective transformation. Equations A1 and A2 describe analysis and synthesis equations for forward and inverse transforms, respectively, in the On-line Appendix. Transformation is nonlinear; thus, complex patterns are more sparsely characterized in the trans-port domain and correspond to distances on the Riemannian mani-fold. Computing Riemannian distances with respect to a common template allows linearization of the optimal mass transport metric and reduces the number of operations fromN(N⫺1) / 2 toN. Prior work shows that pattern discrimination using the linear optimal transport distance is enabled when the template lies sufficiently close to the Riemannian manifold.27,28Because the TBM transformation
is bijective, we can generate de novo images along the regression direction in transport space through inverse transformation. The lat-ter is enabled because TBM is generative. The ability to ultimately visualize the complex shift in microstructural profile initially im-perceptible to visual inspection (Fig 1) is a unique contribution of TBM. We implemented all 3D-TBM codes in Matlab (Math-Works, Natick, Massachusetts) as described in Kundu et al.13
Assessing the Microstructural Relationship with Reaction Time
Statistical learning is performed in the transport domain to ex-tract relevant image features. First, transport maps generated by the transformation are vectorized and concatenated into a stan-dard data matrix. Then, the principal components analysis tech-nique (Equation A3) is used to eliminate data dimensions
con-tributing little to the variance in the dataset. The data matrix is projected onto the topmostdeigenvectors associated with 90% of the variance in transport maps to create the reduced-dimension data matrixX僆⺢d⫻n(d⬍⬍p). Let僆⺢n⫻1be the reaction
time percentile mapped to squared values (to increase separation of lower from higher percentiles). The direction in transport space that results in the strongest linear correlation is computed with the reaction time percentile(Equation 1)26:
1) wcorr⫽arg max w
wTX
冑
wTw⫽X
冑
TXTX.Here,wcorris a vector field synthesized in the transport domain
that quantifies the direction and amount of FA redistribution most correlated with the reaction time percentile. Covariates are removed according to Equation 2.
2) ⫽y⫺Z共ZTZ兲⫺1ZTy.
Here,describes the residual from the reaction time percentile (y僆⺢n⫻1) that is decorrelated and orthogonal to thec,
con-founding variables inZ僆⺢n⫻c. This study corrects for age, sex,
and time from injury as covariates. Statistical significance of the computed direction was assessed using permutation testing with
T⫽1000 tests. The reportedPvalue is the fraction of times over
Ttests that the Pearson correlation coefficient was higher when labelsvare randomly assigned to subject data than when com-puted based on the original assignment. We implemented all sta-tistical analysis code in Matlab.
RESULTS
Assessing the Microstructural Relationship with Reaction Time
As illustrated inFig 1, visual inspection does not elucidate the changes characteristic of poor postconcussive reaction time. The computed tissue distribution from the transport space was signif-icantly associated with the reaction time percentile after correct-ing for covariates accordcorrect-ing to Equation 2 (Pearsonr⫽0.44,P⬍
.01). The strength of the association is moderate. Furthermore, the pattern of injury identified by TBM is specific to cognitive
[image:3.594.54.529.48.220.2]symptoms following mTBI because it is not significantly corre-lated with any other ImPACT measures except processing-speed percentile (Table 2).
On-line Fig 3 shows the scatterplot of subjects when their images are projected onto the most correlated direction com-puted in the transport space. The mean imageI0(x) maps to a
projection score of zero. Each point in the scatterplot repre-sents a brain image in the dataset. According to the linear regression model constructed in the transport space, increas-ing reaction time percentile (faster reaction times) is associ-ated with increasing projection scores, and decreasing reaction time percentile (slower reaction times) is associated with de-creasing projection scores.
Understanding Complex Correlations Visually
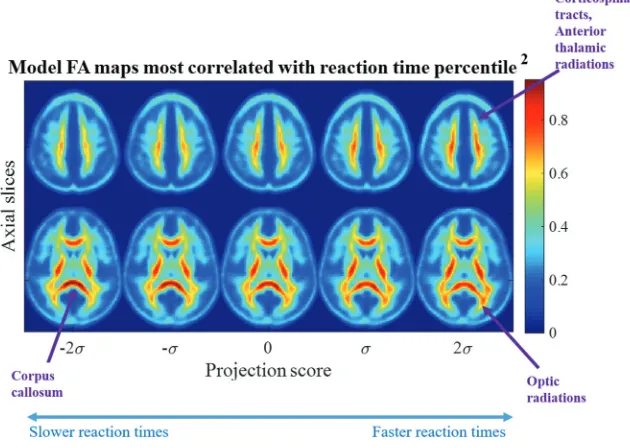
In addition to confirming a correlation between the reaction time percentile and microstructure, projection scores can be interpreted clinically. Reverse TBM transformation can map any given projec-tion score to visualize a computer-generated image.Figure 2shows
visualizations of dynamic brain morphology corresponding to varying projection scores. The images are synthesized on the basis of the study population. Note that simple linear regression in transport space can characterize the nonlinear, spatially diffuse, white matter injury pattern in the image domain.
The projection scores across the horizontal axis inFig 2 corre-spond to those in the horizontal axis of On-line Fig 3. The images shown are computer-generated by TBM from points sampled along the line of best fit where the projection score spans⫺2 to⫹2 SDs from the mean. The FA maps are colored to aid in visualiza-tion. The values represent relative density, a measure of FA con-centration. Two axial slices are shown that best summarize the morphologic differences from a low-reaction-time percentile to a high-reaction-time percentile. The population mean imageI0(x)
is indicated by the projection score zero inFig 2. The images at the negative projection scores correlate most strongly with the low-reaction-time percentile, while the images at the positive projec-tion scores correlate most strongly with high-reacprojec-tion-time per-centile (On-line Fig 3). Progressing from a low-to-high reaction time percentile, the statistical model illustrates that FA in the cor-pus callosum decreases while increasing in the optic radiations, corticospinal tract, and anterior thalamic tracts.
Individual Assessment of White Matter Injury Associated with Reaction Time
In addition to identifying common structural correlates of reac-tion time, TBM also identifies white matter injury in individual patients. The direction computed in transport space can clinically assess whether the patterns of white matter injury inFig 2are present in an individual patient. The transport map for an indi-vidual patient can be projected onto this direction to yield a pro-jection score for the patient. The propro-jection scores can be inter-preted on the basis of the relationship with reaction time performance illustrated in On-line Fig 3 to evaluate whether cog-nitive deficits may be present.Figure 3
illustrates the FA map of a patient with a fast reaction time in the 94th percentile that maps to a high positive projection score and that of a patient with slow re-action time in the 21st percentile that maps to a low negative projection score, a potential metric by which to differen-tiate these patients. A key strength of TBM is its ability to assess spatially dif-fuse, complex white matter patterns that are not easily identified visually or by an ROI-based perspective.
Furthermore, Fig 3 shows that the transport map may reveal new numeric assessment tools. The determinant of the Jacobian computed from the trans-port maps measures the joint changes in FA concentration across multiple white matter tracts. An increase in FA concen-tration is indicated by a value of⬎1, and decreases are indicated by a value of⬍1. We see that the direction of FA change in multiple white matter tracts with respect
[image:4.594.54.285.307.431.2]FIG 2. Most correlated direction. Images corresponding to the most correlated direction in transport space show decreasing FA in the corticospinal tracts, anterior thalamic radiations, and optic radiations with the low reaction time percentile corresponding to the scatterplot in On-line Fig 3. The FA in the corpus callosum increases as reaction time decreases.
Table 2: Correlation between TBM direction and other ImPACT measures
ImPACT Measure
Pearson
Correlation P
Anxiety ⫺0.06 .68
Cervicalgia ⫺0.06 .70
Headaches ⫺0.18 .91
Total ImPACT score ⫺0.29 .98
Processing speed percentile 0.31 ⬍.01a
Sleep-wake disturbance ⫺0.24 .97
Time to recovery ⫺0.05 .67
Tinnitus ⫺0.05 .61
Verbal memory 0.20 .06
Visual memory 0.20 .05
a
[image:4.594.56.371.466.690.2]to the common reference corroborates those identified byFig 2
for a patient with high and low reaction times.
DISCUSSION
This article investigates the microstructure underlying postconcus-sive reaction time. Our prior work developing 3D-TBM demon-strated its ability to uncover microstructural circuits not adequately assessed through visual inspection or conventional methods.13This
article builds on prior work to propose a new framework to bridge microstructure and postconcussive cognitive assessment. We discov-ered an FA spatial pattern that is significantly associated with reaction time and robust to covariates of age, sex, and time from injury. The discovered pattern is specific to cognitive symptoms and does not correlate with ImPACT measures outside of processing speed and reaction time. This article is the first to elucidate the influence of multiple regions jointly on postconcussive reaction time through vi-sualizable FA images.
This work delves deeper in elucidating the link between post-concussive reaction time and brain microstructure than prior studies.29-32 Previous studies investigated individual ROIs.
Womack et al29reported that the posterior corpus callosum is
related to peripheral visual reaction time, and Arenth et al30
re-ported that DTI parameters in the corpus callosum relate to im-paired reaction time post-TBI. The prior findings, however, lack specificity to cognitive performance because the corpus callosum is commonly involved across mTBI populations.31Our work
un-covers microstructural circuitry that is specific to cognitive pro-cessing (ie, reaction time and propro-cessing speed). Other studies examining frontal ROIs12,32found no consistent pattern between
DTI variables on various ROIs and symptom scale scores. Most important, a prior study suggested that cognitive deficit is a dif-fuse process: the number of DTI lesions positively correlated with poorer cognitive measures.7Our work offers a more complete
map of the multiple microstructural lesions that jointly influence reaction time. This study uniquely visualizes the complex, dy-namic microstructure opaque to visual interpretation and ROI-based approaches because TBM is generative.
Our work demonstrates a new approach for assessing latent microstructural patterns, especially those that are not discernible
[image:5.594.56.530.44.443.2]visually. TBM addresses many shortcomings of traditional meth-ods. Histogram analysis does not provide regionally specific an-swers,12,33ROI-based techniques do not characterize spatially
dif-fuse processes, and voxel-based analysis is sensitive to a priori structural/functional alignment,12,33,34 which produces
false-positives in mTBI cohorts.10Tractography visualizes in vivo
path-ways, but poorly understood interconnections are precisely the ones most difficult to characterize using tractography.35In
con-trast, TBM uncovers structure-function circuitry13in an
auto-mated manner. Unlike traditional methods, TBM is generative and inverse transformation visualizes latent microstructure opaque to these methodologies. We see multiple white matter tracts dynamically interacting, providing novel insight into bio-physical substrates. Our approach is widely applicable to future mTBI studies investigating the link between brain microstructure and clinical symptoms.
The microstructure we discovered is consistent with reaction time neurobiology. First, optic radiations interpret the initial stimulus and contribute to interindividual variability in reaction time.36 Next, frontally mediated circuits help process the
ob-served stimulus. In prior studies, damage to the anterior thalamic radiations led to impaired cognitive function37and was associated
with reaction time deficits.38Following executive processing,
in-terhemispheric transmission translates attention into a physical response. The corpus callosum mediates interhemispheric trans-mission and correlates with reaction time in both healthy and cognitively impaired individuals.33,39 Finally, the corticospinal
tract generates a motor response.40
In addition, this study illuminates interaction across multiple white matter tracts. The direction of FA varies among the corpus callosum and visual tracts, corticospinal tracts, and anterior tha-lamic radiations. Our corpus callosum findings are consistent with prior reports6of increased FA with injury that suggest
cyto-toxic edema in the semiacute phase. However, other studies de-scribe diffusely decreased FA with persistent cognitive symptoms, including in the corpus callosum.7,41The acute/postacute
imag-ing time period may be responsible for this findimag-ing. White matter injury in mTBI is dynamic, demonstrating increased FA early due to cytotoxic edema and decreased FA late, reflecting decreased white matter integrity and axonal loss.42Our finding of mixed FA
likely reflects a transitional time period. Some regions may have progressed to axonal loss, while others remain in earlier stages. This mixed response is seen during the semiacute interval.43,44
The corpus callosum is the largest fiber tract in the human brain45; increased FA may represent residual edema from the
im-mediate into the subacute phase of injury relative to smaller tracts. There are several limitations of this study. We conducted a retrospective, single-center study. Future prospective, multi-center studies are needed to build on our results. Additionally, our patients ranged from pediatric to adult. White matter myelination may vary in the pediatric population. However, our model re-mained significant even after accounting for age covariation.46
Furthermore, focusing on FA spatial distribution may be advan-tageous in mixed-age patient populations in which differences in head size may confound traditional voxel-based techniques. Our study included subjects imaged at heterogeneous intervals since traumatic injury, but the statistical model remained robust after
correcting for time from injury as a covariate. Furthermore, many patients with mTBI do not seek medical attention, and there is a possible selection bias toward more seriously injured or symp-tomatic patients. However, the bias may help direct toward pa-tients who would benefit most from objective assessment. Finally, lack of universally accepted normative data limits quantitative use of DTI metrics in the clinical setting. Future studies will need to establish normative references for quantitative TBM in healthy patients and those with mTBI. This study motivates future inves-tigation into causality between brain microstructure and mTBI symptoms.
CONCLUSIONS
In the future, 3D TBM may help provide prognostic markers to assess either recovery or progression to chronic stages in prospec-tive longitudinal DTI studies.12,33There is immense potential for
3D-TBM to be a novel diagnostic technology capable of investi-gating structure-function relationships in many diseases like mTBI that are still considered mysteries.
Disclosures: Gustavo K. Rohde—UNRELATED:Grants/Grants Pending: National Insti-tutes of Health/National Science Foundation,Comments: I currently have 1 National Institutes of Health and National Science Foundation pending grant on developing the underlying technology that will support future studies using transport-based morphom-etry;Patents (Planned, Pending or Issued): United States Patent Office,Comments: I have 1 patent related to methods for measuring optimal transport between images.
REFERENCES
1. Vincent AS, Roebuck-Spencer TM, Cernich A, et al. Cognitive changes and dementia risk after traumatic brain injury: implica-tions for aging military personnel.AAlzheimers Dement2014;10(3 Suppl):S174 – 87CrossRef Medline
2. Himanen L, Portin R, Isoniemi H, et al.Cognitive functions in rela-tion to MRI findings 30 years after traumatic brain injury.Brain Inj
2005;19:93–100Medline
3. Grandhi R, Tavakoli S, Ortega C, et al.A review of chronic pain and cognitive, mood, and motor dysfunction following mild traumatic brain injury: complex, comorbid, and/or overlapping conditions?
Brain Sci2017:7CrossRef Medline
4. Levin HS, Li X, McCauley SR, et al.Neuropsychological outcome of mTBI: a principal component analysis approach.J Neurotrauma
2013;30:625–32CrossRef Medline
5. Hellawell DJ, Taylor RT, Pentland B.Cognitive and psychosocial outcome following moderate or severe traumatic brain injury.
Brain Inj1999;13:489 –504Medline
6. Wozniak JR, Krach L, Ward E, et al.Neurocognitive and neuroim-aging correlates of pediatric traumatic brain injury: a diffusion ten-sor imaging (DTI) study.Arch Clin Neuropsychol2007;22:555– 68
Medline
7. Niogi SN, Mukherjee P, Ghajar J, et al.Extent of microstructural white matter injury in postconcussive syndrome correlates with impaired cognitive reaction time: a 3T diffusion tensor imaging study of mild traumatic brain injury.AJNR Am J Neuroradiol2008; 29:967–73Medline
8. Mac Donald CL, Dikranian K, Bayly P, et al.Diffusion tensor imag-ing reliably detects experimental traumatic axonal injury and indi-cates approximate time of injury.J Neurosci 2007;27:11869 –76
Medline
9. Davenport ND, Lim KO, Armstrong MT, et al.Diffuse and spatially variable white matter disruptions are associated with blast-related mild traumatic brain injury.Neuroimage2012;59:2017–24CrossRef Medline
the diagnostic performance of diffusion-tensor imaging in concus-sion.Radiology2014;272:217–23CrossRef Medline
11. Ghodadra A, Alhilali L, Fakhran S.Principal component analysis of diffusion tensor images to determine white matter injury patterns underlying postconcussive headache.AJNR Am J Neuroradiol2016; 37:274 –78CrossRef Medline
12. Niogi SN, Mukherjee P.Diffusion tensor imaging of mild traumatic brain injury. J Head Trauma Rehabil 2010;25:241–55 CrossRef Medline
13. Kundu S, Kolouri S, Erickson KI, et al.Discovery and visualization of structural biomarkers from MRI using transport-based morphom-etry.Neuroimage2018;167:256 –75CrossRef Medline
14. Erlanger D, Saliba E, Barth J, et al.Monitoring resolution of post-concussion symptoms in athletes: preliminary results of a web-based neuropsychological test protocol.J Athl Traii2001;36:280 – 87
Medline
15. Collie A, Maruff P, Makdissi M, et al.CogSport: reliability and cor-relation with conventional cognitive tests used in postconcussion medical evaluations.Clin J Sport Med2003;13:28 –32Medline
16. Leddy JJ, Kozlowski K, Fung M, et al.Regulatory and autoregulatory physiological dysfunction as a primary characteristic of post con-cussion syndrome: implications for treatment.NeuroRehabilitation
2007;22:199 –205Medline
17. Leddy JJ, Kozlowski K, Donnelly JP, et al.A preliminary study of subsymptom threshold exercise training for refractory post-con-cussion syndrome.Clin J Sport Med2010;20:21–27CrossRef Medline
18. Department of Defense, Department of Veterans Affairs. VA/DoD Clinical Practice Guideline for Management of Concussion/Mild Traumatic Brain Injury. 2009. https://www.rehab.research.va.gov/ jour/09/46/6/pdf/cpg.pdf. Accessed May 17, 2019
19. Mayers LB, Redick TS.Clinical utility of ImPACT assessment for postconcussion return-to-play counseling: psychometric issues.
J Clin Exp Neuropsychol2012;34:235– 42CrossRef Medline
20. Eckner JT, Kutcher JS, Richardson JK.Effect of concussion on clini-cally measured reaction time in 9 NCAA division I collegiate athletes: a preliminary study.PM R2011;3:212–18CrossRef Medline
21. Lau B, Lovell MR, Collins MW, et al.Neurocognitive and symptom predictors of recovery in high school athletes.Clin J Sport Med2009; 19:216 –21Medline
22. Behrens TE, Woolrich MW, Jenkinson M, et al.Characterization and propagation of uncertainty in diffusion-weighted MR imaging.
Magn Reson Med2003;50:1077– 88Medline
23. FDT. FMRIB’s Diffusion Toolbox. http://fsl.fmrib.ox.ac.uk/fsl/fs-lwiki/FDT. Updated May 12, 2016. Accessed May 17, 2019 24. Jenkinson M, Beckmann CF, Behrens TE, et al.FSL.Neuroimage
2012;62:782–90CrossRef Medline
25. FMRIB Software Library, Version 6.0. Analysis Group, FMRIB, Ox-ford, UK. http://www.fmrib.ox.ac.uk/fsl. Updated April 16, 2019. Ac-cessed March 26, 2016
26. Basu S, Kolouri S, Rohde GK.Detecting and visualizing cell pheno-type differences from microscopy images using transport-based morphometry.Proc Natl Acad Sci U S A2014;111:3448 –53CrossRef Medline
27. Wang W, Slepc˘ev D, Basu S, et al.A linear optimal transportation framework for quantifying and visualizing variations in sets of im-ages.Int J Comput Vis2013;101:254 – 69CrossRef Medline
28. Kolouri S, Tosun AB, Ozolek JA, et al.A continuous linear optimal transport approach for pattern analysis in image datasets.Pattern Recognit2016;51:453– 62CrossRef Medline
29. Womack KB, Paliotta C, Strain JF, et al.Measurement of peripheral vision reaction time identifies white matter disruption in patients with mild traumatic brain injury.J Neurotrauma2017;34:1539 – 45
CrossRef Medline
30. Arenth PM, Russell KC, Scanlon JM, et al.Corpus callosum integrity and neuropsychological performance after traumatic brain injury: a diffusion tensor imaging study.J Head Trauma Rehabil2014;29: E1–10CrossRef Medline
31. Aoki Y, Inokuchi R, Gunshin M, et al.Diffusion tensor imaging studies of mild traumatic brain injury: a meta-analysis.J Neurol Neurosurg Psychiatry2012;83:870 –76
32. Levin H, Wilde EA, Troyanskaya M, et al.Diffusion tensor imaging of mild to moderate blast related TBI and its sequelae.J Neu-rotrauma2010;27:683–94CrossRef Medline
33. Grossman EJ, Inglese M, Bammer R.Mild traumatic brain injury: is diffusion imaging ready for primetime in forensic medicine?Top Magn Reson Imaging2010;21:379 – 86CrossRef Medline
34. Bookstein FL.“Voxel-based morphometry” should not be used with imperfectly registered images.Neuroimage2001;14:1454 – 62
Medline
35. Jbabdi S, Johansen-Berg H.Tractography: where do we go from here?Brain Connect2011;1:169 – 83CrossRef Medline
36. Tuch DS, Salat DH, Wisco JJ, et al.Choice reaction time perfor-mance correlates with diffusion anisotropy in white matter path-ways supporting visuospatial attention.Proc Natl Acad Sci U S A
2005;102:12212–17Medline
37. Booth T, Bastin ME, Penke L, et al.Brain white matter tract integrity and cognitive abilities in community-dwelling older people: the Lothian Birth Cohort, 1936. Neuropsychology 2013;27:595– 607
CrossRef Medline
38. Righart RI, Duering M, Gonik M, et al.Impact of regional cortical and subcortical changes on processing speed in cerebral small ves-sel disease.Neuroimage Clin2013;2:854 – 61CrossRef Medline
39. Anstey KJ, Mack HA, Christensen H, et al.Corpus callosum size, reaction time speed and variability in mild cognitive disorders and in a normative sample.Neuropsychologia2007;45:1911–20Medline
40. Leocani L, Cohen LG, Wassermann EM, et al.Human corticospinal excitability evaluated with transcranial magnetic stimulation dur-ing different reaction time paradigms. Brain 2000;123(Pt 6): 1161–73Medline
41. Salmond CH, Menon DK, Chatfield DA, et al.Diffusion tensor im-aging in chronic head injury survivors: correlations with learning and memory indices.Neuroimage2006;29:117–24Medline
42. Eierud C, Craddock RC, Fletcher S, et al.Neuroimaging after mild traumatic brain injury: review and meta-analysis.Neuroimage Clin
2014;4:283–94CrossRef Medline
43. Mayer AR, Ling J, Mannel MV, et al.A prospective diffusion tensor imaging study in mild traumatic brain injury.Neurology2010;74: 643–50CrossRef Medline
44. Bazarian JJ, Zhong J, Blyth B, et al.Diffusion tensor imaging detects clinically important axonal damage after mild traumatic brain injury: a pilot study.J Neurotrauma2007;24:1447–59Medline
45. Aboitiz F.Brain connections: interhemispheric fiber systems and anatomical brain asymmetries in humans.Biol Res1992;25:51– 61
Medline