ISSN Online: 2160-889X ISSN Print: 2160-8881
DOI: 10.4236/opj.2018.82003 Feb. 27, 2018 20 Optics and Photonics Journal
Single-Photon Interaction with Beam Splitters
Jose L. Parra
Courtesy Postdoctoral Associate, Florida International University, Miami, FL, USA Email: [email protected]
Abstract
The production of maxima and minima by the superposition of two or more light signals provides fundamental support for the wave nature of light. This result is based on the study of wave interference phenomena which remains the only approach to explain the production of those maxima and minima. In a system that is prepared to work with only one photon at a time, any detector can signal only one or zero. In 1986, a rigorously controlled experiment was designed by Grangier, G. Roger, and A. Aspect, [Europhys Lett. 1(4), p. 173, 1986] that guaranteed a single-photon beam. The explanation of the experi-mental results implied the interference of the wave function of a single-photon with itself. Thus, the explanation of interference that is accepted for an en-semble of photons was assumed to be valid for a single photon. In this study, we prepare a Mach-Zehnder interferometer using the same type of beam splitters used by Grangier et al. to test the assumption mentioned above. Our results allow us to explain the results of Grangier et al. because of the interac-tion between light and the beam splitters. Our results also verify that their wave interpretation of the results is not valid. Here, we present the essential findings of the extensive experimental evidence that supports our ideas.
Keywords
Interference, Beam Splitter, Mach-Zehnder Interferometer
1. Introduction
In 1986, Grangier, G. Roger, and A. Aspect, [1] published an important experi-mental result concerning the creation of interference using only one photon at a time. In this study, photons were directed to a Mach-Zehnder (MZ) interfero-meter at an average rate of 16 photons per second. Two multi-dielectric coatings on a single silica plate (see Figure 1) acted as beam-splitters (BS1 and BS2) with a transmission-reflection ratio of 50/50. Changing the phase difference between the two waves that arrived at BS2 resulted in changes in the probability of
pho-How to cite this paper: Parra, J.L. (2018) Single-Photon Interaction with Beam Splitters. Optics and Photonics Journal, 8, 20-28.
https://doi.org/10.4236/opj.2018.82003
Received: January 22, 2018 Accepted: February 23, 2018 Published: February 27, 2018
Copyright © 2018 by author and Scientific Research Publishing Inc. This work is licensed under the Creative Commons Attribution International License (CC BY 4.0).
DOI: 10.4236/opj.2018.82003 21 Optics and Photonics Journal
tons arriving at detectors D1 and D2. If p1 and p2 represent the probability of a photon arriving at D1 and D2 respectively, then the extreme values for (p1, p2) were (1, 0) and (0, 1). Thus, Grangier, G. Roger, and A. Aspect, concluded that these results were difficult to explain without assuming that a single photon in-terferes with itself. Here, we suggest that this is not the correct interpretation. We set up an MZ interferometer with beam splitters like those used in the expe-riment of [1] to support our conclusion.
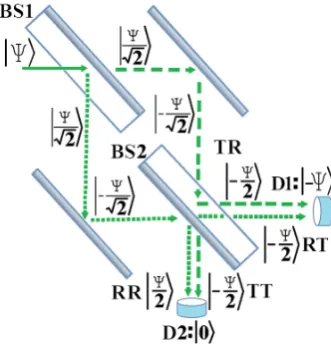
Here, we briefly summarize the explanation of K. P. Zetie, S. F. Adams, and R. M. Tocknell, [2] of the results of [1] to determine whether their results have any connection with quantum mechanical interference. For now, we assume that there is no phase difference between the two paths in the interferometer of Fig-ure 1. This figure describes the phase changes that occur at each part of the in-terferometer, as well as the final amplitudes reaching the second beam splitter (BS2). Thus, a wave of amplitude Ψ will be transmitted and reflected at BS1 with the amplitude Ψ 2, even in the case of a single photon beam.
(In other words, it is assumed that the transmission-reflection ratio of 50/50 that applies for many photons that moves on a macro cross section is the same ratio for a single photon that moves on a micro cross section.)
The math inserted in Figure 1 shows that, after BS2, only one detector at a time can detect the signal of a single arriving photon. After this ideal study, in
[2] is concluded that “all of the physics is contained in this analysis.”
2. Method
2.1. Analysis of the Beam Splitters Microscopic Outputs
We introduce three important pieces of information not present in the analysis done in [1].
[image:2.595.290.456.493.668.2]A convex lens was introduced between the laser and the MZ interferometer
Figure 1. Two beam splitters positioned such that, after BS2, the net output wave hits
DOI: 10.4236/opj.2018.82003 22 Optics and Photonics Journal
(prior to BS1) to magnify the details. In Figure 2, we show two side-by-side im-ages produced by an MZ interferometer. One image is clearly the negative of the other image. (This represents a normal scenario in MZ interferometers.) This setup creates rings on both interference patterns. The images and video were taken using a Canon EOS Rebel SL1.
It is possible to observe vertical interference fringes on the right side of Figure 2. This suggests a new interpretation of the results in [1], which can be described by asking the following question What does it mean for a beam splitter from a microscopic point of view to have a 50/50 transmission-reflection ratio? The ac-cepted opinion is that every point of the beam splitter reflects 50% of the inten-sity of the arriving beam and transmits the remaining 50%. However, this is not the only possible interpretation. Figure 3 shows another possibility. We made a MZ interferometer using two 50/50 beam splitters (R5000069881-13193, Ed-mund Optics). Furthermore, the transmission-reflection ratio was globally
[image:3.595.251.499.307.431.2]50/50, although every microscopic point of the beam splitter could transmit
Figure 2. A mirror was placed after BS2 in one output of the MZ interferometer to
facili-tate the comparison between the output signals. The mirror does not participate in the interference phenomena. The image on the right is the negative of the image on the left and both show interference patterns composed of rings.
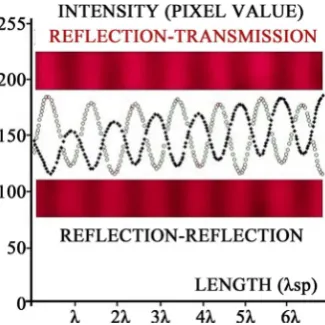
Figure 3. Pictures and graphs with the intensity in pixel units for a beam reflected by BS1
[image:3.595.291.454.494.657.2]DOI: 10.4236/opj.2018.82003 23 Optics and Photonics Journal
somewhere between 0% and 100% of the arriving energy (and correspondingly reflect the complementary quantity of energy).
Figure 3 contains two microscopic images of the two beams to make the point-to-point comparison easier. These images are magnified views of select portions of the real images to make clear the spatial periodicities. The camera that was placed at nine meters of the MZ interferometer had no lens at the time of performing both shots; hence, the beam of light could directly strike the sen-sor of the camera and produce visual information proportional to the intensity of the beam at every point. Every dot in Figure 3 represents the intensity average on a column of 3465 pixels. Every pixel on the camera is a square with an ap-proximate side length of (4 ± 0.25) μm.
It is well known that the functional principle of a beam splitter with multidie-lectric coatings is the interference of light inside the multilayers, i.e., beam split-ter insplit-terference (BSI). Under some specific conditions (not articulated in this paper) an array of maxima and minima as shown in Figure 3 can be manifested outside of the beam splitter. In general, the interference pattern can be described in the following manner: Suppose a ray of light hits a point of the BS at an angle that transmits 100% of the intensity. Another point on the BS, separated by a distance d from the original point, can be used to define a ray with a path that is one wavelength larger than the first ray. This second point also will transmit 100% of the energy. A screen that is separated by a distance L from the beam splitter will show a pattern with maxima and minima with spatial separations (SP) according to the Equation (1).
sp L d
λ =λ (1) Notice that each image in Figure 3 was taken by blocking the beam transmit-ted by BS1. Accordingly, the images in Figure 3 do not represent an interference pattern between two beams of light. To the best of our knowledge, we are the first to demonstrate this experimental result. Moreover, this observation is well correlated with the results produced by Grangier et al in Figure 4 of their study
[1]. Thus, we reinterpret their results as follows. During a one-second period, all single incoming photons hit BS1 on an area and at an angle that produces BSI with 100% of the energy transmitted or reflected. In that transmitted or reflected direction, a regular mirror sends those photons one by one to the same area of BS2, which guides the photons to the corresponding detector according to its BSI coefficient. The movement of the regular mirror in one of the paths by a fif-tieth of a wavelength changes the position of the area of incidence on BS2 by the same amount. The percentage of photons transmitted and reflected on the new area follows the sine-squared function corresponding to the BSI of BS2 (in a similar manner to the function shown in Figure 3).
DOI: 10.4236/opj.2018.82003 24 Optics and Photonics Journal
here may suggest why that occurs.
In our opinion, Figure 4. [1] represents curves that are extremely like any one of our observed R-T and R-R curves. This suggests that in [1] was not observe the interference of a single photon with itself and misunderstood the interaction of single photons with the beam splitter. Therefore, we must next investigate whether it is possible for single photons to finish at only one detector after un-dergoing wave interference from two signals originating from two independent paths.
2.2. Numerical Evaluation of the MZ Interference Patterns
The classical assumption that one image is the negative of the other in Figure 2
can be explained as follows. If the two paths result in destructive interference in one direction, the photons cannot travel in that direction; however, those pho-tons will be redirected in a perpendicular direction, where the interference is constructive. According to [1], this classical assumption explains the behavior observed in MZ interferometers, and photons that cannot travel to D2 in Figure 1 must travel to detector D1. We can verify this line of reasoning through fur-ther experiments.
A basic setup was prepared to produce simple patterns of interference. In this way, inconvenient spatial effects could be avoided making the wave as close as possible to the ideal plane wave. In this trial, no lens was placed between the la-ser and the MZ interferometer. Furthermore, two lenses per beam were posi-tioned around 30 cm after the MZ interferometer to amplify the size of the im-ages. The MZ interferometer should produce two symmetrical outputs, where one output is the negative image of the other, according to the classical wave theory. If these conditions can fail, it must occur when the symmetry of the sys-tem could be compromised under extreme conditions. This case occurs when the path difference between the two beams is almost zero.
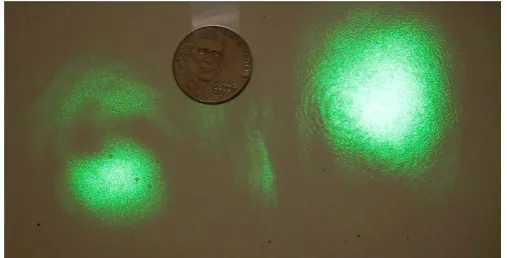
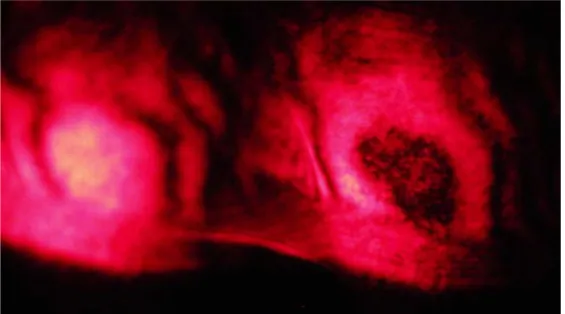
[image:5.595.247.501.548.677.2]A video allowed us to analyze the output of the two beams. Figure 4 shows one frame of the video. Two observations and one question arise from this fig-ure:
Figure 4. The two outputs of an MZ interferometer under a path difference of zero (An
DOI: 10.4236/opj.2018.82003 25 Optics and Photonics Journal
1) The destructive interference on the left side is not completely dark. 2) The image on the right side is not the negative image of the left (i.e., sym-metry was broken).
3) The photons that cannot travel to the center of the left image because of the destructive interference, where do they go? (In [1] was assumed that they travel to the image on the right.)
Point 3 was studied using Wolfram Mathematica 10 at different sections of our video to corroborate the images shown here. One good example consists of frames 1289 and 1290, which are separated by one thirtieth of a second.
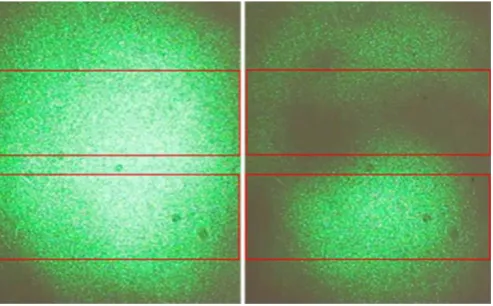
The frames of Figure 5 that correspond to the right side of Figure 4, show an average 0.07 increase of intensity from frame 1289 to 1290. This increment in intensity could be originate from the left beam of Figure 4 or from the space surrounding the computed image. The left beam can be used to answer this question.
[image:6.595.251.498.335.488.2]The left beam (Figure 6) shows a 0.26 decrease in intensity from frame 1289 to 1290, which is significantly different from the 0.07 increase in intensity expe-rienced by the right beam. The strong destructive interference of the top box of
Figure 5. Right side of frames 1289 and 1290, which show the average intensities for three
different regions: the total image, the top box, and the bottom box. This information al-lows us to follow the energy flux.
Figure 6. Left side of frames 1289 and 1290 showing the average intensities at three
[image:6.595.252.499.543.696.2]DOI: 10.4236/opj.2018.82003 26 Optics and Photonics Journal
the left beam during frame 1290 (intensity decrease of 0.44, which is half as large as that in frame 1289) is larger than the decrease of 0.19 experienced by the bot-tom box of the left beam. In other words, some of the photons that leave the di-rection pointing to the top box finished at the bottom box of the left beam. On the other hand, photons that do not end in a region of destructive interference move toward neighboring regions where the interference is not destructive and do not move in the perpendicular direction where the interference is construc-tive, as is typically assumed. This result makes sense because photons need not “know” in advance where they can or cannot move.
3. Discussion
Though these observations completely disprove the conclusion of [1], these re-sults do not in any way belittle their experiment. Instead, the combination of their results with our results clearly shows that a single photon does not interfere with itself. If a single photon does interfere with itself, then Figure 4 of [1]
would show an almost constant intensity.
In our opinion, when. in [1] is state “this was achieved by observing the fringes in the focal planes of two lenses, …” they were looking at the vertical fringes of the BSI and not at the semi-arc of the MZ interference. In effect, the experiment of [1] produces the antithesis of their interpretation.
[image:7.595.233.518.533.692.2]Note that all results in this study were obtained twice by using lasers with wa-velengths of 650 nm and 460 nm because they cover more than half of the visual spectrum. It is possible to think that maybe the last numerical results discussed here were created by the BS or the lasers used on the experiment. A more so-phisticated MZ interferometer was made using two pellicles BS (39485, Edmund Optics). This time the two-outside lens were unnecessary. Also, the helium-neon laser used this time emits light with wavelength 632 nm that is the one used to calibrate the pellicle BS, meaning a more reliable 50/50 reflection-transmission ratio. A video was recorded to help on the after-visual comparison between the MZ outputs. Figure 7 and Figure 8 show the same pattern observed before. That
Figure 7. Both output of the MZ interferometer on a frame where no destructive
DOI: 10.4236/opj.2018.82003 27 Optics and Photonics Journal
Figure 8. Next time frame showing both output of the MZ interferometer. Here is clear
that the photons that abandon the central region on the right do not move to the left output because the variation in both region are completely different.
is, photons of a beam that cannot travel to the regions with destructive interference do not finish on the other output where the interference remains constructive.
4. Conclusions
The results shown here do not diminish the experimental work performed by [1]
in any way. We have simply reinterpreted their conclusion. More precisely, their experiment shows that it is not possible to create interference via the superposi-tion of the wave associated with the propagasuperposi-tion of single photons. If circular symmetry is guaranteed, our interpretation is completely justified by the expe-rimental evidence that MZ interference produces a pattern of interference rings, while the BSI produces a pattern of interference fringes. In other words, if the quantum mechanical wave calculations were correct, both D1 and D2 would signal continually because the destructive MZ interference will push the photons
radially out of or in to the center with an experimental angle no larger than 0.5 degree. Note that this angle is far smaller than the 90-degree angle claimed in.
[1] and [2], where it was erroneously assumed that the destructive interference in one direction should send the single arriving photon in a perpendicular direc-tion where the MZ interference is constructive. Here, it was shown experimen-tally that the trajectory of many photons could be understood if the MZ interfe-rometer is forced to produce interference between beams with a path difference of almost zero.
DOI: 10.4236/opj.2018.82003 28 Optics and Photonics Journal
made by two virtual foci on a plane “side by side” to the laser direction. The former produces a dark center inside a bright ring, whereas the latter produces a dark fringe accompanied by two bright fringes.
Acknowledgements
We would like to acknowledge the junior student Carmen Vargas at Florida In-ternational University for realizing the video and for performing the light inten-sity calculations on the figures introduced here. To Ivan Santiago, Photographer of the Academic Imaging Services, Division of Information Technology, Florida International University, for supervising the quality of the graphical material of-fered here. Special mention to the Professor Francisco Mueller for supervision of all the experimental work done and for guarantee that every concept introduced were crystal clear and precise.
References
[1] Grangier, P., Roger, G. and Aspect, A. (1986) Experimental Evidence for a Photon Anticorrelation Effect on a Beam Splitter: A new Light on Single-Photon Interfe-rences. Europhysics Letters, 1, 173. https://doi.org/10.1209/0295-5075/1/4/004
[2] Zetie, K.P., Adams, S.F. and Tocknell, R.M. (2000) How Does a Mach-Zehnder In-terferometer Work? Physics Education, 35, 46.
https://doi.org/10.1088/0031-9120/35/1/308
[3] Scully, M.O. and Zubairy, M.S. (1997) Quantum Optics. Cambridge University Press, 133. https://doi.org/10.1017/CBO9780511813993
[4] Franson, J.D. and Potocki, K.A. (1988) Single-Photon Interference over Large Dis-tances. Physical Review A, 37, 2511. https://doi.org/10.1103/PhysRevA.37.2511