Study of hsCRP, adiponectin, NF-κB in low
bodyweight, standard bodyweight and obese
subjects with type 2 diabetes mellitus in India
*
Sidhartha Das1#, Durga Prasanna Misra1, Pratima Kumari Sahu2
1Department of Medicine, Sriram Chandra Bhanj Medical College, Cuttack, India; #Corresponding Author: drsidhartha.cuttack@gmail.com
2Department of Biochemistry, Sriram Chandra Bhanj Medical College, Cuttack, India
Received 29 June 2012; revised 30 July 2012; accepted 10 August 2012
ABSTRACT
Introduction: Low bodyweight type 2 DM is a distinct clinical entity having many inherent pe- culiarities seen in India and developing coun-tries, constituting 11% to 25% of type 2 diabetic subjects. Our study aimed at assessing the prevalence of inflammatory markers like hsCRP, adiponectin and NF-κB expression in peripheral blood mononuclear cells in subjects with type 2 DM in relation to BMI. Materials and Methods: 57 consecutive type 2 diabetics were recruited for study, classified as Low Bodyweight (A = BMI < 18.5), Standard weight (B = BMI 18.5 - 24.99) and Obese (C = BMI ≥ 25). Group D comprised 14 healthy controls. They were evaluated for clini-cal parameters, FBG, 2hrPPBG, HbA1c, lipid profile and above mentioned inflammatory mark-ers. Results: Serum hsCRP was significantly higher in all group of diabetics as compared to Group D but was lowest in Group A. Adiponectin levels were highest in Group D, similar in Groups B and C but lowest in Group A. NF-κB expres-sion, though higher in diabetic subjects than controls (OD = 0.041 ± 0.006), was least in Group A (OD = 0.045 ± 0.005). Discussion and Conclu-sion: Our study revealed that Indians with type 2DM are in a pro-inflamematory state. Low body- weight type 2 diabetics had the least pro-in- flammatory load. This further supported the ear-lier observation of lesser macrovascular disease load and testifying that Low Bodyweight type2 DM constitutes a distinct entity.
Keywords: Low Bodyweight Type 2 DM; hsCRP;
NF-κB; Adiponectin
1. INTRODUCTION
Type 2 Diabetes Mellitus (DM) is the most prevalent form of DM seen in India and constitutes more than 95% of the diabetic population. Almost 80% of Indian patients with type 2 diabetes are non-obese, whereas 60% - 80% of such patients with type 2 diabetes in the West are obese [1,2]. Epidemiological data has revealed the clini-cal and phenotypic profile of patients with type 2 DM to be very different in India and certain developing coun-tries of Asia and Africa when compared to the West [1,2]. This appreciation that the profile, presentation and com-plications in subjects with Non-Insulin Dependent Dia-betes Mellitus (NIDDM) seen in India was much differ-ent from those NIDDM of the west was recorded, for the first time, as a consensus statement adopted at the “In-ternational Workshop on types of Diabetes Peculiar to the Tropics”, held at Cuttack, India [3]. The consensus statement published in Diabetes Care (1996) read as, “This group supports the WHO classification of NIDDM into Obese and Non-obese sub-classes. In some devel-oping countries, non-obese patients constitute the more common category, and a proportion of them have BMI < 18.5. There are many factors that are not well understood in these subjects with NIDDM and Low body weight; further research is required in this group” [3].
Cross-sectional studies on newly diagnosed or estab-lished patients with type 2 diabetes have revealed that acute-phase markers such as C reactive protein (CRP) and interleukin 6 (IL-6) are elevated when compared to non-diabetic subjects [4]. Adiponectin is an adipocyte derived protein whose plasma concentration has an in-verse correlation with the severity of insulin resistance [5-7]. Adiponectin is anti-inflammatory in nature, and has potential inhibitory activity on atherogenic cellular phenomena [5,7,8]. Subjects with type 2 DM have been
*There is no conflict of interest, not funded by any agency nor
found to have lower adiponectin levels than healthy nondiabetic individuals [5,7].
Data from the Atherosclerosis Risk in Communities (ARIC) study, had demonstrated that a variety of in-flammatory markers, including white blood cell count
α-1 acid glycoprotein, fibrinogen and sialic acid predict the development of type 2 DM in a middle-aged popula-tion [4]. Recent evidences show that diabetic atheroscle-rosis is not only a disease of hyperlipidemia but also has an inflammatory component involving multiple media-tors viz. CRP, cytokines like Tumor necrosis factor alpha (TNF-α) and IL6 [9]. Gene profiling studies have shown that high glucose treatment of monocytes leads to in-creased expression of multiple inflammatory cytokines, chemokines and related factors. Many of these are regu-lated by the pro-inflammatory transcription factor, Nu-clear factor kappa-B (NF-κB) [9].
Literature on inflammatory markers in relation to various subgroups of type 2 DM based on BMI viz. Low bodyweight (BMI < 18.5), standard bodyweight (BMI 18.5 - 24.99) and obese (BMI ≥ 25) is sparse in world literature. Therefore it was decided to study the preva-lence of inflammatory markers in subjects with type 2 DM in the above mentioned subgroups.
2. SUBJECTS, MATERIALS AND
METHODS
The present case-control study was undertaken at a tertiary care hospital attached to a medical college. tients with type 2 DM, attending the Medicine Out Pa-tient Department and InpaPa-tients ward of S.C.B. Medical College and Hospital, Cuttack were included in the study. Diagnosis of DM was made as per WHO criteria of 2006. Patients with type 2 DM having nephropathy, acute or chronic infection, fever or any other associated inflam-matory condition were excluded from the study. 57 con-secutive cases of type 2 DM were selected for the study. They were sub-classified into three different groups de-pending on BMI. 11 cases of type 2 DM with BMI < 18.5 kg/m2 were designated as Group A, 29 cases of type 2 DM with BMI 18.5 - 24.99 kg/m2 as Group B and 17 type 2 DM with BMI ≥ 25 kg/m2 constituted Group C respectively. 14 healthy individuals without type 2 DM or family history of metabolic disease or acute or chronic infection served as controls i.e. Group D. A detailed his-tory, physical examination, fasting blood glucose (FBG), 2 hr post-prandial/post glucose blood glucose (2 hr PPBG), glycosylated haemoglobin (HbA1c), lipid profile, serum high-sensitivity CRP (hsCRP), serum Adiponectin and NF-κB expression in peripheral blood mononuclear cells were done for each case.
The patients with diabetes were only on antidiabetic medication. They were not on any other drug therapy like lipid lowering or anti-inflammatory agents. There were
no differences in the type of medications used for the different group of diabetic subjects.
Blood glucose was estimated by the glucose oxidase method using a standard kit supplied by Acutex Bio- chemical Pvt. Ltd. (Mumbai, India). Serum cholesterol was estimated using a standard kit (Enzokit) supplied by Ranbaxy Fine Chemicals Ltd. Diagnostic Centre; serum triglyceride was estimated using a standard kit supplied by Chemelex S. A., Barcelona; serum low-density lipo- protein cholesterol (LDL-C) was estimated using a stan- dard kit supplied by Agappe Diagnostics Ltd. (Kerala, India); serum high-density lipoprotein cholesterol (HDL- C) was estimated using a standard kit supplied by Tran-sasia Biomedicals Ltd. (Daman, India). Samples were analysed in the Boehringer Mannheim photometer 5010 (Birkenfeld, Germany). HbA1c was estimated using re-agent supplied by Lilac Medicare, Mumbai and Multi- function Automatic Analyser System BiOLiS 24i (Tokyo Boeki Machinery Ltd., Japan). Serum hsCRP estimation was done using qualitative turbidimetric assay using kit supplied by SPINREACT, S.A.U., Spain by Vitalab Se-lectra E Chemistry Analyser (Diamond Diagnostics, USA). Serum Adiponectin estimation was done using Adi-ponectin (human) EIA Kit(HS), from SPIBIO, France and assay done by ELISA. Peripheral blood mononuclear cells (PBMC) extraction and preparation of nuclear ex-tract was done immediately after venipuncture using method previously described in literature [10]. NF-κB estimation was done using NF-κB (human p50) Tran-scription Factor Assay Kit, Cayman Chemicals, USA by ELISA using iMARK Microplate Absorbance Reader (Biorad, USA). The values of NF-κB were expressed in terms of optical density (OD).
Statistical analysis was done using SPSS 16.0 software (SPSS Inc., Chicago, IL). The significance of difference in values between the different groups was estimated using analysis of variance (ANOVA) test. The Pearson correlation coefficient (r value) between different pa- rameters was worked out by bivariate correlation.
3. RESULTS
Table 1. Demographic characteristics, blood pressure values of groups A, B, C.
CASES WITH DIABETES
BMI < 18.5 (A) n = 11
CASES WITH DIABETES
BMI 18.5 - 24.99
(B) n = 29
CASES WITH DIABETES
BMI > 25 (C) n = 17
HEALTHY CONTROLS
(D) n = 14
p value
A vs B A vs C B vs C A vs D B vs D C vs D ANOVA
AGE (YRS) 46.90 ± 13.96 53.10 ± 10.78 55.47 ± 8.44 27.57 ± 5.74 0.14 0.052 0.44 0.0001 0.0001 0.0001 0.0001
GENDER (MALE/ FEMALE)
6/1 28/5 14/3 10/4
DURATION DIABETES
(YRS)
1.63 ± 1.36 3.42 ± 4.35 3.48 ± 3.99 0.19 0.16 0.96 0.35
BMI (kg/m2) 17.31 ± 1.34 22.49 ± 1.26 27.54 ± 1.4 21.43 ± 2.06 0.0001 0.0001 0.0001 0.0001 0.04 0.0001 0.0001
WHR 0.94 ± 0.02 0.97 ± 0.05 1.00 ± 0.06 0.92 ± 0.02 0.06 0.003 0.07 0.02 0.0009 0.0001 0.0001
Systolic BP
(mm·Hg) 119.27 ± 17.28 133.66 ± 16.78 127.35 ± 32.91 114.43 ± 7.96 0.02 0.46 0.39 0.5 0.001 0.16 0.04
Diastolic BP
[image:3.595.56.537.424.729.2](mm·Hg) 76.36 ± 8.04 81.58 ± 8.42 79.52 ± 8.90 71.42 ± 3.63 0.08 0.34 0.43 0.05 0.001 0.003 0.001
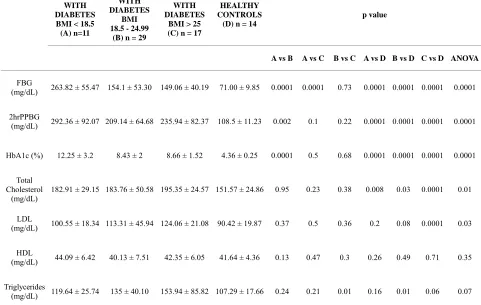
Table 2. Blood glucose, HbA1c, lipid profiles of groups A, B, C.
CASES WITH DIABETES
BMI < 18.5 (A) n=11
CASES WITH DIABETES
BMI 18.5 - 24.99
(B) n = 29
CASES WITH DIABETES
BMI > 25 (C) n = 17
HEALTHY CONTROLS
(D) n = 14
p value
A vs B A vs C B vs C A vs D B vs D C vs D ANOVA
FBG
(mg/dL) 263.82 ± 55.47 154.1 ± 53.30 149.06 ± 40.19 71.00 ± 9.85 0.0001 0.0001 0.73 0.0001 0.0001 0.0001 0.0001
2hrPPBG
(mg/dL) 292.36 ± 92.07 209.14 ± 64.68 235.94 ± 82.37 108.5 ± 11.23 0.002 0.1 0.22 0.0001 0.0001 0.0001 0.0001
HbA1c (%) 12.25 ± 3.2 8.43 ± 2 8.66 ± 1.52 4.36 ± 0.25 0.0001 0.5 0.68 0.0001 0.0001 0.0001 0.0001
Total Cholesterol
(mg/dL)
182.91 ± 29.15 183.76 ± 50.58 195.35 ± 24.57 151.57 ± 24.86 0.95 0.23 0.38 0.008 0.03 0.0001 0.01
LDL
(mg/dL) 100.55 ± 18.34 113.31 ± 45.94 124.06 ± 21.08 90.42 ± 19.87 0.37 0.5 0.36 0.2 0.08 0.0001 0.03
HDL
(mg/dL) 44.09 ± 6.42 40.13 ± 7.51 42.35 ± 6.05 41.64 ± 4.36 0.13 0.47 0.3 0.26 0.49 0.71 0.35
Triglycerides
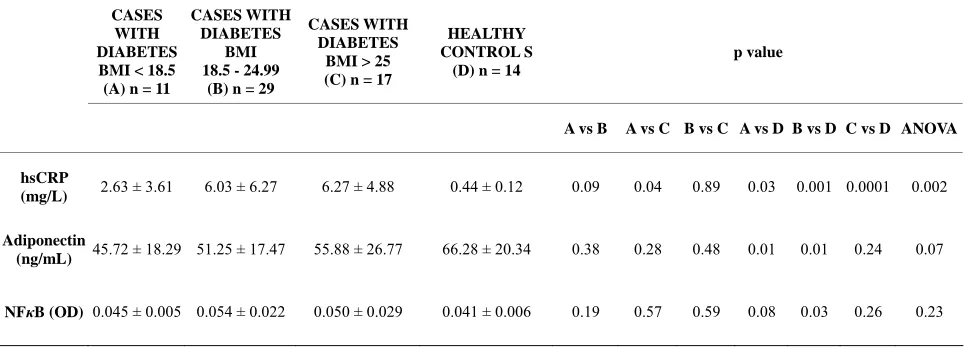
Table 3. Values of inflammatory markers of groups A, B, C.
CASES WITH DIABETES BMI < 18.5 (A) n = 11
CASES WITH DIABETES
BMI 18.5 - 24.99
(B) n = 29
CASES WITH DIABETES
BMI > 25 (C) n = 17
HEALTHY CONTROL S (D) n = 14
p value
A vs B A vs C B vs C A vs D B vs D C vs D ANOVA
hsCRP
(mg/L) 2.63 ± 3.61 6.03 ± 6.27 6.27 ± 4.88 0.44 ± 0.12 0.09 0.04 0.89 0.03 0.001 0.0001 0.002
Adiponectin
(ng/mL) 45.72 ± 18.29 51.25 ± 17.47 55.88 ± 26.77 66.28 ± 20.34 0.38 0.28 0.48 0.01 0.01 0.24 0.07
NFκB (OD) 0.045 ± 0.005 0.054 ± 0.022 0.050 ± 0.029 0.041 ± 0.006 0.19 0.57 0.59 0.08 0.03 0.26 0.23
The patients with diabetes were only on antidiabetic medicines. They were not on any medications like lipid lowering agent or anti-inflammatory agents. There were no differences in the type of medications used between the groups.
patients with diabetes (Table 2). Levels of total choles- terol were comparable in all the three groups of patients with type 2 diabetes, though higher than healthy controls (Group D) (Table 2). Serum LDL-C was significantly higher in Group C as compared to group A (p = 0.005), and this was significantly higher in all patients with type 2 diabetes compared to healthy controls (Table 2). Value of serum triglycerides was significantly higher in Group C compared to Group B (p = 0.01), and was of a higher value compared to healthy controls (Table 2).
Patients with Low bodyweight type 2 DM had signifi- cantly lower levels of serum hsCRP as compared to obese patients with type 2 DM (p = 0.04), and values of serum hsCRP were significantly higher in patients with type 2 DM of all the three groups A,B and C compared to healthy controls (p = 0.03, 0.001, 0.001 respectively) (Table 3). Serum adiponectin levels were lower than healthy controls in all the three groups of patients with type 2 DM, however they only differed to a level of sta- tistical significance between Groups A and D (p = 0.01) and Groups B and D (p = 0.01) (Table 3). NF-κB ex- pression in peripheral blood mononuclear cells was low- est in Group A amongst all groups of patients with type 2 DM, even though it was higher in all the three groups of patients with type 2 diabetes compared to healthy con-trols. There was a statistical significance of difference only between Groups B and D (p = 0.03) (Table 3).
Calculation of Pearson’s correlation coefficient (r) was done between the above mentioned variables in each of the groups. In Group A, levels of serum hsCRP corre- lated positively with age (r = +0.667, p = 0.025) but negatively with serum HDL-C (r = –0.756, p = 0.007). Levels of serum adiponectin correlated positively with waist-hip ratio (r = +0.610, p = 0.046) and HbA1c (r = +0.606, p = 0.048). In Group B, value of serum hsCRP
correlated positively with waist hip ratio (r = +0.398, p = 0.032). NF-κB expression in peripheral blood mononu- clear cells had a positive correlation with value of sys- tolic blood pressure (r = +0.379, p = 0.043). In Group C, values of serum hsCRP had a positive correlation with FBG (r = +0.582, p = 0.014), whereas serum adiponectin had a negative correlation with PPBG (r = –0.536, p = 0.026). In Group D, values of serum adiponectin were found to correlate negatively with systolic BP (r = –0.571, p = 0.033), and values of NF-κB expression in periph- eral blood mononuclear cells were found to have a posi- tive correlation with levels of HbA1c (r = 0.640, p = 0.014).
4. DISCUSSION
insulin kinetics of subjects with diabetes revealed that they have lower lipid profiles with higher levels of HDL cholesterol and triglycerides, a greater incidence of pe- ripheral neuropathy and microvascular complications, and fewer macrovascular complications with low plasma homocysteine levels [1,16]. On the whole these subjects of low body weight diabetes have a favourable lipid pro- file that could be a consequence of hepatic handling of HDL and carbohydrate (CHO) metabolism and lack of hyperinsulinemia-insulin resistance in the peripheral bed. The HDL Cholesterol were never low even in glycemi- cally uncontrolled state with mean glycosylated Hb val- ues above 10%. This could be owing to the fact that he- patic lipase activity, like all other enzymes is primed by insulin during its first pass, is in excess in lean patients with type 2 DM, and is directly related to HDLc me- tabolism. Type 4 hyperlipoproteinemia is by far the com-monest form of dyslipidemia seen in these subjects and that too in a glycemic uncontrolled state. These cor- roborative observations support and explain the observed level of lipid profile and inflammatory markers found in the phenotypic variant of type 2 DM (Group A).
C-reactive protein (CRP) is an acute phase reactant has long been considered a classic marker for inflamma- tion. Although normally circulating at low levels, acute inflammation, infection, tissue injury induces a marked increase in hepatic synthesis of CRP which can raise the serum level a hundred fold more as markers of inflame- mation in prediction.
The level of hsCRP in all three group of subjects with diabetes was significantly more than in the healthy con- trols but, patients with Low bodyweight type 2 DM had significantly lower levels of serum hsCRP compared to obese patients with type 2 DM. Raised levels of hsCRP in diabetics is well documented in literature [4]. In Low bodyweight type 2 diabetics, values of serum hsCRP were found to have significant positive correlation with age. The above correlation of hsCRP with age is well recognized [17]. Levels of serum hsCRP had a positive correlation with waist hip ratio, as met with in hitherto published literature [18].
With the human genome sequence completed in 2003, efforts towards a mechanistic understanding of the dis- ease diabetes, its complications, its treatment, cure and prevention were made. The gene that expressed most abundantly and specifically in adipose tissue was a novel gene, the adiponectin gene. Hypoadiponectinemia, a part of metabolic syndrome, inflammation were confirmed with knockout mice of adiponectin gene. The knockout mice showed no specific phenotype when no high fat or high sucrose diet was loaded [19]. However, high fat and high sucrose diet induced marked elevation of plasma glucose as well as plasma insulin levels in the knockout mice. They also showed marked insulin resistance during
high fat and high sucrose diet. The supplementation of adiponectin by adenovirus transfection clearly improved this insulin resistance [19]. Adiponectin was shown to inhibit the TNF-alpha-induced NF-kappa B activation through the inhibition of IkB phosphorylation, which might be a major molecular mechanism for the inhibition of monocyte adhesion to endothelial cells and thus the inflammation.
Low bodyweight, standard weight and obese subjects with diabetes had lower values of serum adiponectin as compared to healthy controls. Reduced adiponectin lev- els in patients with type 2 DM is well recognized in world literature [5-7]. However, in the present study, sta- tistical significance of difference in the values of adi- ponectin was seen between Low bodyweight and stan- dard bodyweight diabetics (both groups are non-obese type 2 diabetics) when compared with healthy controls and there was positive correlation with serum adi- ponectin levels with waist-hip ratio and HbA1c levels encountered in this group of diabetics could be likely due to an inherent characteristic of Low bodyweight type 2 DM. Lean habitus is mostly due to lack of fat depot and central adiposity rather than nutritional deficiency. The above observation is an expected aberration in subjects with Low Bodyweight type 2 DM and compatible with our earlier observations of low Homocysteine, high Glucokinase and brisk hepatic metabolic state in Low Bodyweight type 2 diabetics [1,10,11,16]. Value of serum adiponectin had a significant negative correlation with PPBG, as has been previously reported in literature [7]. Thus, our findings are corroborative with most publica- tions on levels of adiponectin in DM [5,6,15]. These ob- servations confirmed that adiponectin suppresses the de- velopment of inflammation. Lower serum adiponectin levels than healthy controls in all the three groups of patients with type 2 diabetes is at par with other studies in subjects with type 2 DM. Interestingly, statistical sig- nificant difference in the values of adiponectin between Groups A and D (p = 0.01) made Low Bodyweight type2DM subjects to have a lesser proinflammatory load.
NF-κB belongs to a family of transcription factors, originally identified by B cells. These transcription fac-tors of NF-κB group are pro inflammatory markers. NF-
blood mononuclear cells were found to be higher in dia- betic subjects as compared to healthy controls. This is at par with many previous publications [5,9,10]. Interest- ingly, statistical significance of difference was seen only between standard bodyweight diabetics and healthy con- trols, but not between Low bodyweight diabetics and healthy controls. Contrary to expectation, in subjects with type 2 DM the expression of NF-κB was lowest in Low Bodyweight type 2 diabetics as compared to both Group B and C while the value of optical density ob- served in them was near similar to that observed in healthy controls. Significant positive correlation between NF-κB expression in peripheral blood mononuclear cells and HbA1c levels has been reported previously, wherein exposure to hyperglycemia induced activation of the transcription factor NF-kappa B in ex vivo-isolated pe- ripheral blood mononuclear cells [20,21].
It has already been reported in world literature that, Low bodyweight type 2 DM is a distinct clinical entity constituting an independent variant of type 2 DM with inherent peculiarities of insulin kinetics in the liver along with altered profile and behaviour of key enzymes re-lated to carbohydrate metabolism, excess extraction of insulin in the hepatic bed, hyperactive cytochrome sys- tem and non-supressible glucokinase activity [1,3,11,12, 16,22,23].
The clinical picture is dominated by peripheral neu- ropathy and consequences of poor glycemic control such as infections and endothelial cell dysfunction [1]. The insulin resistance observed in Low bodyweight type 2 DM is unlikely to be due to anthropometric parameters like central obesity and waist hip ratio [1]. Observa- tion of lower hsCRP, relatively lower levels of adi- ponectin (probably due to sparse fat pool) and expression of NF-κB similar that of healthy controls, further justifies that Low bodyweight type 2 DM is an independent clinical entity with many inherent peculiarities.
5. CONCLUSION
Our study revealed type 2 Diabetes in Indians to be a pro-inflammatory state, in the form of elevated hsCRP and NF-κB expression in peripheral blood mononuclear cells and low levels of adiponectin. Low bodyweight type 2 diabetics have a lesser pro-inflammatory load as compared to standard bodyweight and obese type 2 dia- betics. Our findings add credence to the fact that Low bodyweight type 2 diabetes is a distinct clinical entity by itself, with peculiarities in its clinical profile and phenol- typic presentation.
REFERENCES
[1] Das, S. and Fonseca, V. (2009) Low bodyweight type 2
diabetes in India: Clinical characteristics and pathophysi- ology. Diabetes & Metabolic Syndrome: Clinical Re- search and Reviews, 3, 60-66.
doi:10.1016/j.dsx.2009.01.001
[2] Diamond, J. (2011) Diabetes in India. Nature, 469, 478-
479. doi:10.1038/469478a
[3] Tripathy, B.B. and Rao, H. (1996) Malnutrition and dia- betes in the tropics. Report of the international workshop on types of diabetes peculiar to the tropics. Diabetes Care,
19, 1014-1017.
[4] Pickup, J.C. (2004) Inflammation and activated innate immunity in the pathogenesis of type 2 diabetes. Diabetes Care, 27, 813-823. doi:10.2337/diacare.27.3.813
[5] Dandona, P., Aljada, A., Chaudhuri, A., Mohanty, P. and Garg, R. (2005) Metabolic syndrome: A comprehensive perspective based on interaction between obesity, diabe- tes and inflammation. Circulation, 111, 1448-1454.
doi:10.1161/01.CIR.0000158483.13093.9D
[6] Ziemke, F. and Mantzoros, C.S. (2010) Adiponectin in insulin resistance: Lessons from translational research. The American Journal of Clinical Nutrition, 91, 258S-
261S. doi:10.3945/ajcn.2009.28449C
[7] Kawano, J. and Arora, R. (2009) The role of adiponectin in obesity, diabetes and cardiovascular disease. Journal of the CardioMetabolic Syndrome, 4, 44-49.
doi:10.1111/j.1559-4572.2008.00030.x
[8] Gustafson, B. (2010) Adipose tissue, inflammation and atherosclerosis. Journal of Atherosclerosis and Thrombo- sis, 17, 332-341. doi:10.5551/jat.3939
[9] Natarajan, R. and Nadler, J.L. (2004) Lipid inflammatory mediators in diabetic vascular disease. Arteriosclerosis, Thrombosis, and Vascular Biology, 24, 1542-1548.
doi:10.1161/01.ATV.0000133606.69732.4c
[10] Das, S. (1994) Identity of lean-NIDDM: Clinical, meta- bolic and hormonal status. In: Kochupillai, N., Ed., Ad- vances in Endocrinology Metabolism and Diabetes, Vol. 2, Macmillan, Delhi, 42-53.
[11] Das, S., Samal, K.C. and Baliarsinha, A.K. (1995) Lean (underweight) NIDDM-peculiarities and differences in metabolic and hormonal status. Journal of the Association of Physicians of India, 43, 339-342.
[12] Das, S. (1999) low bodyweight type 2 diabetes mellitus, technical series. Indian College of Physicians (ICP), Aca- demic Wing of Association of Physicians of India, Mum- bai.
[13] Zimmet, P.Z., Tuomi, T., Mackay, I.R., Rowley, M.J., Knowles, W., Cohen, M. and Lang, A. (1994) Latent autoimmune diabetes mellitus in adults (LADA): The role of anti-bodies to glutamic acid decarboxylase in diagnosis and prediction of insulin dependency. Diabetic Medicine,
11, 299-303. doi:10.1111/j.1464-5491.1994.tb00275.x
[14] Mohan, V., Vijayaprabha, R., Rema, M., Premlatha, G., Poongothai, S., Deepa, B.E., Mackay, I.R. and Zimmet, P. (1997) Clinical profile of lean NIDDM in South India. Diabetes Research and Clinical Practice, 38, 101-108.
doi:10.1016/S0168-8227(97)00088-0
function in subjects with low body weight type 2 diabetes mellitus. Metabolic Syndrome and Related Disorders, 5, 136-141.
[16] Das, S., Reynolds, T., Patnaik, A., Rais, N., Fink, L.M. and Fonseca, V.A. (1999) Plasma homocysteine concen- trations in type 2 diabetics in India: Relationship to body- weight. Journal of Diabetes and Its Complications, 13,
200-203. doi:10.1016/S1056-8727(99)00045-8
[17] Lannergård, A., Friman, G., Ewald, U., Lind, L. and Larsson, A. (2005) Serum amyloid A (SAA) protein and high-sensitivity C-reactive protein (hsCRP) in healthy newborn infants and healthy young through elderly adults. Acta Paediatrica, 94, 1198-1202.
doi:10.1111/j.1651-2227.2005.tb02074.x
[18] Devaraj, S., Valleggi, S., Siegel, D. and Jialal, I. (2010) Role of C-reactive protein in contributing to increased cardiovascular risk in metabolic syndrome. Current Athe- rosclerosis Reports, 12, 110-118.
doi:10.1007/s11883-010-0098-3
[19] Pickup, J.C. and Crook, M.A. (1998) Is type II diabetes mellitus a disease of the innate immune system? Diabe- tologia, 41, 1241-1248. doi:10.1007/s001250051058
[20] Dhindsa, S., Tripathy, D., Mohanty, P., Ghanim, H., Syed, T., Aljada, A. and Dandona, P. (2004) Differential effects of glucose and alcohol on reactive oxygen species gen- eration and intranuclear factor-kappaB in mononuclear cells. Metabolism, 53, 330-334.
doi:10.1016/j.metabol.2003.10.013
[21] Hofmann, M.A., Schiekofer, S., Kanitz, M., Klevesath, M.S., Joswig, M., Lee, V., et al. (1998) Insufficient gly- cemic control increases nuclear factor-kappa B binding activity in peripheral blood mononuclear cells isolated from patients with type 1 diabetes. Diabetes Care, 21, 1310-1316. doi:10.2337/diacare.21.8.1310
[22] Patnaik, A., Das, S. and Patnaik, B. (1999) Hepatic meta- bolic states and glucokinase. In: Das, S., Ed., Low Body- weight Type 2 Diabetes Mellitus, Association of Physi- cians of India, Mumbai, 48-53.