ISSN Online: 2164-0181 ISSN Print: 2164-0165
DOI: 10.4236/mme.2018.81001 Jan. 17, 2018 1 Modern Mechanical Engineering
Design and Optimization of Comb Drive
Accelerator for High Frequency Oscillation
Zichen Zhang
Shandong Experimental High School, Jinan, China
Abstract
Comb-drive devises have been widely applied in many fields. However, the application of high frequency sensor, such as rocket chamber, still remains problems. In this work, a finite element code was used for the design, optimi-zation and visualioptimi-zation of a comb drive accelerator. In the simulation results, the post-optimization design has high performance in high frequency oscilla-tion operating environment. The optimizaoscilla-tion is based on the ideal eigenfre-quency and Nelder-Mead method. The 3-D working conditions are realized by testing and comparing the time and frequency domain of pre-optimized and optimized design whose frequency ranges from 2000 Hz to 5000 Hz. Fi-nally, the electric potential and capacitance in comb drive are visualized, which shows the better electric signals and displacements.
Keywords
Comb-Drive Micro-Structure, COMSOL Multiphysics, Optimization, Electric Responses
1. Introduction
In contemporary society, the Micro-Electro-Mechanical System (MEMS) devices play a significant role in many fields, e.g. accelerator, fluid control, micro-power system, MEMS fuse system and internet of things (IOT) [1]. The widely use of MEMS devices is due to its scaling advantage, i.e. the scaling of MEMS devices reduces the cost per device. Although the total cost to fabricate one wafer may increase, the number of devices on each wafer increases exponentially with the decrease of the feature size of MEMS devices. In addition, the finer fabrication process provides high performance of MEMS devices. For example, the accuracy and precision of MEMS sensors are orders of magnitude higher than conven-tional sensors [2]. Therefore, MEMS becomes a focus of both fundamental re-How to cite this paper: Zhang, Z.C. (2018)
Design and Optimization of Comb Drive Accelerator for High Frequency Oscillation. Modern Mechanical Engineering, 8, 1-10. https://doi.org/10.4236/mme.2018.81001
Received: November 6, 2017 Accepted: January 14, 2018 Published: January 17, 2018
Copyright © 2018 by author and Scientific Research Publishing Inc. This work is licensed under the Creative Commons Attribution International License (CC BY 4.0).
DOI: 10.4236/mme.2018.81001 2 Modern Mechanical Engineering from 1000 to 5000 Hz. The design and development of a micro-accelerator be-come an essential problem for real-time monitor of the working stators of the combusting chamber.
However, the design and optimization of comb drive sensor become a chal-lenge for the society since the geometry of the devices is complex. Xie et al. has already designed and fabricated the out of plane comb drives which can achieve the aim of realizing [5]. Based on Xie’s design, some scientists have already suc-cessfully developed and tested 1-D analog scanning micro mirror arrays with hidden vertical comb-drive actuators [6]. Besides, there are also some other groups using comb drive to solve out sophisticated problems as to overcome the difficulties of isolating two stationary capacitor comb sets in bulk micromachin-ing by the electrically [7]. Whereas, those designs lack of the freedom to change all the parameters of the comb drive, which means that the designs are partially fixed. Moreover, there is no visualization in their models, making it hard to show the results of the model.
In this work, I used the powerful simulation software—COMSOL to make the model more vivid and visual. The study of the vertical comb-finger actuation for CMOS MEMS is also been realized, simulated and tested. In addition, behavioral simulation using the 3-D NODAS library matched the experimental results within 7% for frequency response. Comparing with this work, the frequency domain study was conducted to optimize the model which nobody has involved in this filed. I also parameterized the geometry of the comb drive structure, e.g. fingers and stators. As a result, I can easily change the structure for optimization in the model. In this way, the model can solve the problems that have mentioned above.
2. Model Setup
DOI: 10.4236/mme.2018.81001 3 Modern Mechanical Engineering (a) (b)
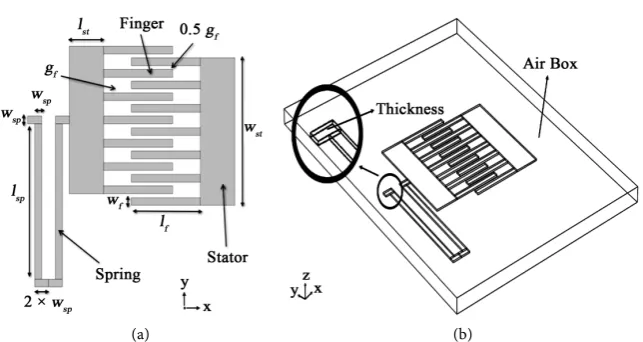
Figure 1. (a) 2-D plane schematic of the comb drive; (b) 3-D stereoscopic sche-matic of the comb drive.
length, and g for gaps between two fingers. In order to stimulate the real work-ing circumstance of comb drives, Figure 1(b) shows the thickness of structures, and the air box as the air around the comb drive in three dimensions. The air-box is setup to calculate the electric field in the air. In order to adapt the rocket chamber circumstances, the number of fingers is fixed as five, the material is copper, and environment is 293.15 K for temperature, 1 atm for absolute pres-sure which have been all set up in COMSOL.
Before the optimization, each parameter is set up the proper number, as 200 µm for lf , wf 20 µm, lst 100 µm, gf 20 µm, lsp 400 µm, wsp 20 µm,
and wst expresses as:
(
)
6 5
st f f f
w = w + g +w (1)
which can derive that wst is 380 µm. On the other hand, the thickness is 5 µm,
and the size of air box is large enough to cover the whole model.
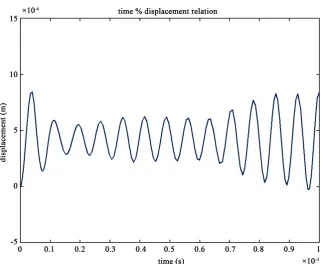
After fixing the right stator, I apply an oscillating voltage with 1 V amplitude to the left comb. The relation between the displacement, u, and the time domain, t, which is the first 1 ms, can be easily obtained by solving the equation below:
V
u F
ρ = ∇ ⋅ + s (2)
where ρ is the density, s is the stress tensor and FV is the external force
densi-ty.
Figure 2 shows the displacement of the moving comb after applying an oscil-lating voltage at the comb drive by applying 1 V.
DOI: 10.4236/mme.2018.81001 4 Modern Mechanical Engineering Figure 2. The initial relation between displacement and the time.
the rocket chamber operates. In the end, we compare this pre-optimized design (PD) to with the optimized design (OD) to show the improvement of the device.
Different displacement fields with different frequencies (freq) are shown in Figures 3(a)-(d). The volume color represents the displacement field for each part.
3. Result
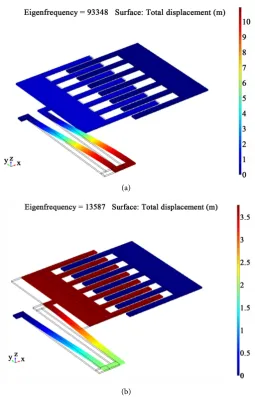
First, the eigen modes of the mechanics are evaluated. As widely known, the rocket chamber operating frequency has a range from 5000 - 10,000 Hz, which is our objective frequency. The eigenfrequency should be as close as the objective to output the maximum displacement. For the physical material, the specific frequency which reachs the maximum amplitude is called Eigenfrequency. Be-fore the optimization, the eigen frequencies of the pre-optimized design’s (PD) are far away from 5000 Hz which is the operation frequency of the rocket cham-ber. As a result of the frequency mismatch, the performance of the PD is not considered appropriate for the rocket chamber application. Figure 4 shows two the eigen modes of device. The colors in Figure 4 represent the displacement field of the drive.
To compare these two different modes, the second eigen mode (Figure 4(b)) has translational motion of the left comb with 13,587 Hz. It should be mentioned that we expect the translational mode rather than other modes. In translational mode, all the left fingers move toward the stator coherently.
DOI: 10.4236/mme.2018.81001 5 Modern Mechanical Engineering Figure 3. (a), (b), (c), and (d) reflect the visualized displacement by colors when fre-quency is 2000 Hz, 3000 Hz, 4000 Hz and 5000 Hz respectively.
(a)
(b)
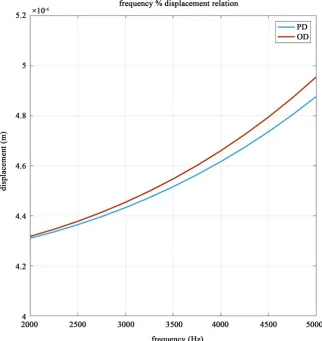
[image:5.595.246.502.297.695.2]DOI: 10.4236/mme.2018.81001 6 Modern Mechanical Engineering mized design (OD) and tested the new design to compare its performance with our original design. Comparison of the displacement is shown in Table 2. Fig-ure 5 shows the difference performance between PD and OD in the frequency range of the rocket chamber.
Table 1. The optimization results.
The optimization results lfinger (m) lstator (m) Objective
2.00 × 10⁻⁴ 1.00 × 10⁻⁴ 1.2869 × 10⁷
1.98 × 10⁻⁴ 1.00 × 10⁻⁴ 1.3063 × 10⁷
2.00 × 10⁻⁴ 1.02 × 10⁻⁴ 1.2370 × 10⁷
1.96 × 10⁻⁴ 1.00 × 10⁻⁴ 1.3250 × 10⁷
2.00 × 10⁻⁴ 9.80 × 10⁻⁵ 1.3389 × 10⁷
2.00 × 10⁻⁴ 1.20 × 10⁻⁴ 8.5970 × 10⁶
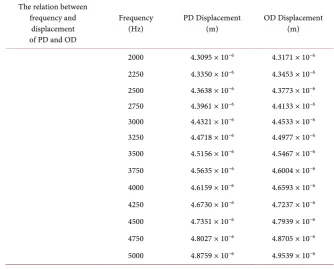
Table 2. The relation between frequency and displacement of PD and OD.
The relation between frequency and
displacement of PD and OD
Frequency
(Hz) PD Displacement (m) OD Displacement (m)
2000 4.3095 × 10⁻⁶ 4.3171 × 10⁻⁶
2250 4.3350 × 10⁻⁶ 4.3453 × 10⁻⁶
2500 4.3638 × 10⁻⁶ 4.3773 × 10⁻⁶
2750 4.3961 × 10⁻⁶ 4.4133 × 10⁻⁶
3000 4.4321 × 10⁻⁶ 4.4533 × 10⁻⁶
3250 4.4718 × 10⁻⁶ 4.4977 × 10⁻⁶
3500 4.5156 × 10⁻⁶ 4.5467 × 10⁻⁶
3750 4.5635 × 10⁻⁶ 4.6004 × 10⁻⁶
4000 4.6159 × 10⁻⁶ 4.6593 × 10⁻⁶
4250 4.6730 × 10⁻⁶ 4.7237 × 10⁻⁶
4500 4.7351 × 10⁻⁶ 4.7939 × 10⁻⁶
4750 4.8027 × 10⁻⁶ 4.8705 × 10⁻⁶
[image:6.595.204.539.459.728.2]DOI: 10.4236/mme.2018.81001 7 Modern Mechanical Engineering Figure 5. Relation between frequency and displacement of PD and OD.
Next, we simulated the relation between the applied forces and displacements. The results of frequency dependent displacement are presented in Table 3. By applying the same force, the OD had significantly larger displacement than that of PD. Thus, the simple test proves that the displacement has ascended after op-timization. Even only a small increase in the displacement, it will increase the electric signal on the micro level.
In the static electric domain, the electric field E satisfies the following relation V
= −∇
E (5)
0 rE v
ε ε ρ
∇ ⋅ = (6)
where V is the electric potential, ε is the permittivity and ρv is the electric
charge density. The capacitance of the device can be calculated as
14
3.2581 10 F
C=Q V = × − , if the device is in static.
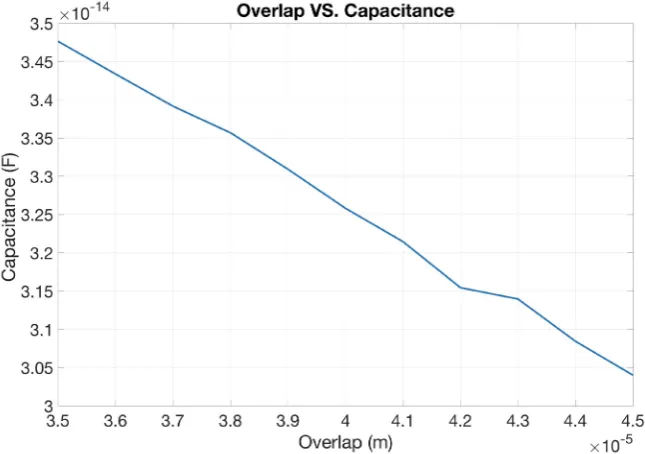
Figure 6 shows the capacitance versus the length of the overlap which is in-duced by the external force. The capacitance can be simply estimated with the equation
S C
d ε
DOI: 10.4236/mme.2018.81001 8 Modern Mechanical Engineering Figure 6. Overlap versus capacitance.
Table 3. The difference between the displacement before and after the optimization.
The difference between the displacement before and after the optimization.
Applied
force Displacement field PD Displacement field OD Difference
0 0 0 0
1.00 0.04216233 0.042133753 285,769 2.00 0.08432466 0.084267506 571,538 3.00 0.12648699 0.126401259 857,307 4.00 0.16864932 0.168535012 11,430.8 5.00 0.21081165 0.210668766 14,288.5 6.00 0.25297398 0.252802519 17,146.1 7.00 0.29513631 0.294936272 20,003.8 8.00 0.33729864 0.337070025 22,861.5 9.00 0.37946097 0.379203778 25,719.2 10.00 0.42162330 0.421337531 28,576.9
where S is the effective area, and d is the effective distance between two capacitor plates. Figure 7 indicates that as overlap grows, the capacitance of the comb drive will decrease. The change of capacitance can be easily measured by the voltage of the comb drive. This is how we interpreter the vibration in mechanics to electric signal.
DOI: 10.4236/mme.2018.81001 9 Modern Mechanical Engineering Figure 7. The capacitances at different frequencies ranged from 2000 Hz to 5000 Hz.
(a)
(b)
[image:9.595.238.509.282.691.2]DOI: 10.4236/mme.2018.81001 10 Modern Mechanical Engineering and made it convenient for the optimization. After the optimization, the electric filed response had been tested by comparing with the PD model and OD model. The PD had larger electric signal in response to the mechanical vibration.
References
[1] Wiak, S., Smółka, K., Dems, M. and Komęza, K. (2006) Numerical Modeling of 3D
Intelligent Comb Drive Accelerometer Structure: Mechanical Models. COMPEL—The International Journal for Computation and Mathematics in Electrical and Electronic Engineering, 25, 697-704.https://doi.org/10.1108/03321640610666862
[2] Hirano, T., et al. (1992) Design, Fabrication, and Operation of Submicron Gap Comb-Drive Microactuators. Journal of Microelectromechanical Systems, 1, 52-59.
https://doi.org/10.1109/84.128056
[3] Xie, H., Erdmann, L., Jing, Q. and Fedder, G.K. (2000) Simulation and Characteri-zation of a Cmos Z-Axis Microactuator with Electrostatic Comb Drives. Proc. 3rd Int’l. Conf. on Modeling and. Simulation of Microsystems (MSM 2000), San Diego, CA, 27-29 March 2000, 181-184.
[4] Xie, H. and Fedder, G.K. (2002) Vertical Comb-Finger Capacitive Actuation and Sensing for CMOS-MEMS. Sensors and Actuators A: Physical, 95, 212-221.
https://doi.org/10.1016/S0924-4247(01)00740-3
[5] Xie, H. and Fedder, G.K. (2000) A CMOS Z-Axis Capacitive Accelerometer with Comb-Finger Sensing. Micro Electro Mechanical Systems 2000 (MEMS 2000), The Thirteenth Annual International Conference on IEEE, Miyazaki, Japan, 23-27 Jan 2000, 496-501.
[6] Hah, D., Huang, S.T.Y., Tsai, J.C., Toshiyoshi, H. and Wu, M.C. (2004) Low-Voltage, Large-Scan Angle MEMS Analog Micromirror Arrays with Hidden Vertical Comb-Drive Actuators. Journal of Microelectromechanical Systems, 13, 279-289.https://doi.org/10.1109/JMEMS.2004.825314
[7] Sun, Y., Fry, S.N., Potasek, D.P., Bell, D.J. and Nelson, B.J. (2005) Characterizing Fruit Fly Flight Behavior Using a Microforce Sensor with a New Comb-Drive Con-figuration.Journal of Microelectromechanical Systems, 14, 4-11.