Exploring the value of large databases of
transaction data for business intelligence
Customer Behavior Analysis in an E-commerce Setting
Vincent Meulenbroek
S1007424
University of Twente
The Netherlands
Master Business Administration
ABSTRACT
Business intelligence is the process of collecting and transforming data into knowledge,
to positively influence decision-making, and is the main subject in this study. Market
intelligence is part of business intelligence, and customer insight is part of market
intelligence. Small to medium-sized enterprises often face large databases but do not
know how to use or exploit the databases because of different reasons. This study tries to
find the value of large databases of transaction data for creating business intelligence.
Concepts as relationship management, repurchase behavior and customer life cycle are
discussed thoroughly. The focus is on small to medium-sized enterprises, a case is added
to give the research its power; Webprint.Data of more than 37.000 customers are
analyzed, from their first to third purchase, in order to find the value of transaction
data for business intelligence.Customer behavior patterns are exposed to find the value
of the large database.
Supervisors:
Prof. Dr. A.J. Groen
Drs P. Bliek
Preface
This thesis concludes and thereby ends my time as a student, a period of which I enjoyed myself most of the time. The study is the last phase of the Master program Business Administration, after I already finished the Bachelor program International Business Administration late 2014. My college time has taught and brought me a lot, not only in academic perspective but I have also experienced my college time as pleasant and enjoyable.
During the process of the research I have had a lot of help conducting and processing the thesis. Therefore I would especially express my gratitude towards my first supervisor Prof. Dr. A.J. Groen. You have helped me by providing useful feedback and advise. In my opinion we have worked together without any major problems and made sure that I was able to finish the thesis in time. But, together with my first supervisor, my second supervisor; Drs P. Bliek, also provided me with meaningful feedback and advise. I would like to thank you for your help.
Besides the help from the University of Twente I would also like to thank Webprint Group for the opportunity to graduate at the company in question. Not only the opportunity but also all the feedback and advise I have received from different people within the organization are worth mentioning. Thank you very much for all the help I was privileged to receive.
At last, I would like to thank everyone else who I might have forgotten to thank earlier in the preface. Thank you for participating in my thesis in any kind of way.
With kind regards,
Vincent Meulenbroek
Contents page
Contents page ... i
List of tables and figures ... iv
1. Introduction ... 1
2 Literature review ... 3
2.1 Business intelligence ... 3
2.1.1 Big data as input and data-driven decision making as output ... 3
2.1.2 Business intelligence as overarching theme of other intelligence concepts ... 4
2.1.3 Market intelligence ... 5
2.2 Customer behavior ... 6
2.2.1 Necessity of relationship management for repurchase behavior ... 6
2.2.2 Different phases in customer life cycle demands different approaches ... 7
2.2.3 Influencing repurchase behavior ... 9
2.2.4 Socio-economic influences on customer behavior ... 10
2.3 Theoretical framework ... 11
2.4 Research questions developed from the theoretical framework ... 12
3 Methodology ... 13
3.1 Research design ... 13
3.1.1 Structure ... 13
3.1.2 Quantitative data collection methods with secondary data ... 14
3.2 Exploring Webprint ... 15
3.3 Webprint’s products ... 16
3.4 Case-oriented methodology ... 17
3.4.1 Case data ... 17
3.4.2 Units of analysis ... 17
3.4.3 Tackling issues at the case... 17
3.4.4 Drawback of the dataset ... 18
4 Results ... 19
4.1 Structure of the results section ... 19
4.2 Calculations in the field of customer retention ... 20
4.2.1 Customers who buy the same product in purchase one and purchase two ... 20
4.2.2 Customers who do not buy the same product in purchase one and two ... 20
4.2.3 Customers who buy the same product in purchase two and purchase three ... 22
4.2.7 The second purchase preliminary to the third purchase of a photo book ... 25
4.3 Calculations in the field of customer relationship management (CRM) ... 26
4.3.1 Customer roads with the lowest and highest frequency ... 26
4.4 Calculations in the field of the customer life cycle ... 26
4.5 Socio-economic Status and order value ... 28
5 Discussion ... 29
5.1 The field of customer retention ... 29
5.1.1 Relevant problems on identical purchases ... 29
5.1.2 Discussing findings on non-identical purchase one and two and purchase two and three ... 30
5.1.3 Discussion on the photo books category ... 30
5.1.4 Discussing theory in addition to the case ... 31
5.2 The field of customer relationship management (CRM) ... 31
5.2.1 Discussing the customer road ... 31
5.2.2 Discussing theory in addition to the case ... 32
5.3 The field of the customer life cycle ... 32
5.3.1 Customer profiling ... 32
5.3.2 Discussing theory in addition to the case ... 33
5.4 Other findings, limitations, future research and contribution ... 34
5.4.1 The influence of socio-economic status on order value ... 34
5.4.2 Limitations and future research ... 34
5.4.3 Contribution to previous research ... 34
6 Conclusion ... 35
7. References ... 38
8. Appendices and additional information ... 41
I. Product assortment Webprint ... 41
II. Channels ... 42
A. Six online channels are tracked by Google Analytics and characterize differently ... 42
B. Comparing statistics between different channels ... 45
C. Overlap between channels ... 47
III. Calculations on purchase one and purchase two ... 48
A. Customers who buy the same product in purchase one and purchase two ... 48
B. Customers who do not buy the same product in purchase one and purchase two ... 49
IV. Calculations on purchase two and purchase three ... 51
A. Customers who buy the same product in purchase two and purchase three ... 51
B. Customers who do not buy the same product in purchase two and purchase three ... 52
V. Calculations in the photo book category ... 54
A. The purchase preliminary to the purchase of a photo book ... 54
B. The second purchase preliminary to the third purchase which includes a photo book ... 55
VI. Mapping the customer road ... 56
A. Customer roads with the highest frequency ... 56
VII. Customer profiling ... 56
List of tables and figures
Tables
Table 1:
Best sold products per product category
Table 2:
Calculations on purchase one and two
Table 3:
Calculations on non-identical products in purchase one and two
Table 4:
Calculations on purchase two and three
Table 5:
Calculations on non-identical products in purchase two and three
Table 6:
Calculations on purchase one, two and three
Table 7:
Averages on sample string one
Table 8:
Averages on sample string two
Table 9:
Postal codes string one
Table 10:
Postal codes string two
Table 11:
ANOVA-table, dependent variable
Table 12:
Coefficients-table, dependent variable
Table 13:
Product category purchase one versus product category purchase two
(row percentages)
Table 14:
Product category purchase one versus product category purchase two
(column percentages)
Table 15:
Product category purchase two versus product category purchase three
(row percentages )
Table 16:
Product category purchase two versus product category purchase three
(column percentages)
Table 17:
Photo books purchase two shares
Table 18:
Photo book purchase three shares
Table 19:
Most frequent customer roads
Table 20:
Least frequent customer roads
Table 21:
Legend customer profiling
Table 22:
Sample of customer road Photos – Photos – Photo books
Table 23:
Sample of customer road Photos – Photo books – Photo books
Table 24:
Sample socio-economic status and order value
Figures
Figure 1:
Data-driven (automated) decision-making and business intelligence (Hakanen, 2014)
Figure 2:
Business intelligence and intelligence concepts (Hakanen, 2014)
Figure 3:
Market Intelligence Model (Crowley, 2007)
Figure 4:
Customer life cycle (Yue & Xiang, 2012)
Figure 5:
Theoretical framework
Figure 6:
Research structure
Figure 7:
An overview of the hypotheses
Figure 8:
Revenue share per product group (01-01-2015 / 31-12-2015) - Data retrieved from
Google Analytics
Figure 9:
Multichannel process
Figure 10:
Google Analytics Data Webprint.nl (period 01-01-2015 / 31-12-2015)
Figure 11:
Channel Traffic - (01-01-2015 / 31-12-2015) - Data retrieved from Google Analytics
Figure 12:
Overlap of conversion shares (01-01-2015 / 31-12-2015) - Data retrieved from Google
1.
Introduction
Electronic commerce or e-commerce is a concept that includes any type of business, or commercial transaction, that involves the transfer of information across the internet. It covers a range of different types of businesses, from consumer based retail sites, through auction or music sites, to business exchanges trading goods and services between corporations (Mahadevan, 2000; NetworkSolutions, 2015). It is currently one of the most present partsof the internet to emerge. E-commerce has experienced a huge growth in the last decade even though it already existed since the seventies, when money was exchanged by use of the computer network.
Companies in the e-commerce business are swamped with lots of information, particularly because of the ease of collecting this data. Purchase data of customers are collected continuously and often only pile up without using the data purposeful. Especially small to medium-sized enterprises deal with lots of unused customer behavior data because they do not have the time, knowledge, or resources to transform these data into value for the company(McAfee A. , Brynjolfsson, Davenport, Patil, & Barton, 2012).
Customer data which is collected, but often not used, remains in large, untouched databases. In most cases the data involves information which is collected after transactions are made: transaction data (Foerster & Karolyi, 1998). Analyzing large databases of transaction data demands much specialized attention, analytical skills, and, if the databases are huge, even resources such as specialized software. Large amounts of transaction data are often labeled as big data, and big data, which is not surprising, can outstrip the capacity of manual analysis (Provost & Fawcett, 2013).
Because of big data, managers can measure radically more about their businesses, and directly translate that knowledge into improved decision making and performance(McAfee A. , Brynjolfsson, Davenport, Patil, & Barton, 2012). Big data analysis provides more insight in customer behavior and can expose customer behavior patterns. Not surprisingly, companies that are able to analyze big data successfully are able to gain a competitive advantage. Big data analysis is the key analytical component in business intelligence (Chen, Chiang, & Storey, 2012).
Nowadays, improving business intelligence is a core activity in large companies. It is often entangled in the company, and influences decision making. Business intelligence refers to transforming hard data into knowledge. Online businesses acknowledge that the understanding of their data is crucial to their competitive position (Negash, 2004).
This study tempts to find out what the value is of large databases of transaction data for business intelligence. A case is used to illustrate the surplus of analyzing big data and, as a consequence, improve business intelligence. The case which is used is Webprint, a Dutch online photo service which is online for more than 10 years. It is a medium-sized company. Especially small to medium-sized companies tend to have unused databases of transaction data. The answer to the research question will be sought in the discipline of customer behavior, because the case data is best fitted for this field.
The following research questions and sub questions are formulated:
What is the value of large databases of transaction data for creating business intelligence?
1. What is business intelligence, what does it consist of and what can be achieved by improving business intelligence?
2. What are the characteristics of customer repurchase behavior in e-commerce and how to stimulate it?
What customer behavior patterns are present at Webprint.nl and what points of action do the findings unveil?
3. How can retaining customers be pushed in the desired direction?
4. How can customer relationship management (CRM) influence customer behavior?
5. How can the customer life cycle be used for decision-making?
6. Does socio-economic status (SES) influence order value?
In this study, the case is used to find out the value of large databases of transaction data. The first two sub questions are set up to provide a theoretical foundation on which the second research question, and the last four sub questions, are based. The second research question considers the case Webprint, and focuses on three main subjects coming from the theoretical foundation; customer retention, customer relationship management and the customer life cycle. The sub questions formulated to support the second research question tend to help the case improve their business intelligence by use of transaction data.
2
Literature review
2.1
Business intelligence
2.1.1 Big data as input and data-driven decision making as output
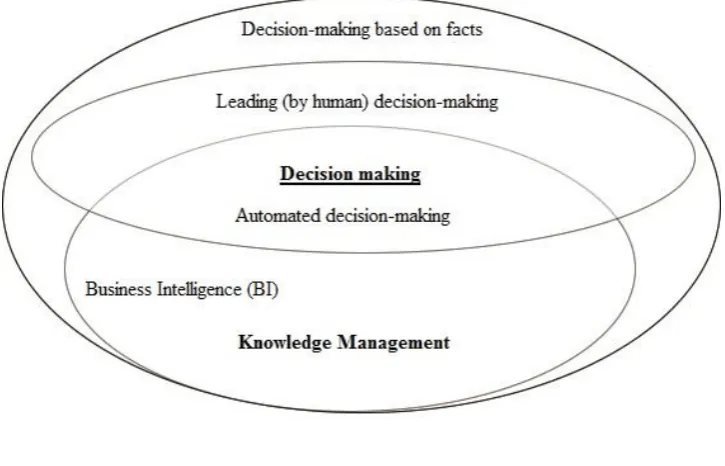
[image:9.595.70.433.498.731.2]2.1.2 Business intelligence as overarching theme of other intelligence concepts
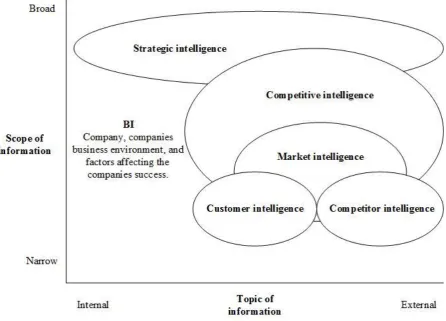
[image:10.595.79.526.432.753.2]Business intelligence can be referred to as the process of collecting and transforming data into knowledge, with as goal to positively influence decision-making, which can improve and uphold performance. It can be seen as part of the overarching theme of information and knowledge management. Business intelligence is viewed as being proactive and supports decision makingon different levels. Negash (2004) illustrates that business intelligence demands unstructured and structured inputs of information to provide intelligence needed in decision making. Different information systems, such as geographic information systems and data mining systems, are part of the structured part of the input. The unstructured part of the input consists of, among others, conversations, graphics and spreadsheets. “The emergence of the data warehouse as a repository, the advances in data cleansing that lead to a single truth, the greater capabilities of hardware and software, and the boom of internet technologies that provided the prevalent user interface all combine to create a richer business intelligence environment than was available previously” (Negash, 2004, p. 179).Only getting the data in a business intelligence system is not enough as is emphasized here: “Getting data in delivers limited value to an enterprise; only when users and applications access the data and use it to make decisions does the organization realize the full value from its data warehouse. Thus, getting data out receives most attention from organizations” (Watson & Wixon, 2007, p. 96). The activity of getting the data out after getting data in is often referred to as business intelligence(Chaudhure, Dayal, & Narasayya, 2011).As mentioned before, business intelligence can be seen as part of the overarching theme of information and knowledge management. But, business intelligence can also be divided. Related intelligence concepts include competitive intelligence, competitor intelligence, customer intelligence, market intelligence and strategic intelligence. These other concepts focus mainly on external environment and are seen as subgroups of a more extensive term, business intelligence (Hakanen, 2014). Figure 2 reveals the different phases of business intelligence and creates an overall picture of the issues that have to be considered to the companies’ business intelligence. Strategic intelligence has the broadest scope of information and depends on internal and external information. Competitive intelligence depends on external information which makes the scope of information at the same time a little less than the scope of strategic intelligence. Market intelligence compels customer and competitor intelligence and also depend on external information, the scope of information declines and narrows. To set focus in this research, market intelligence is discussed further.
2.1.3 Market intelligence
Market intelligence is concerned with information relevant to the markets the company is selling its products in, while business intelligence is concerned with information from the overall environment the company is surrounded by. The model by Hakanen (2014) can be further examined, by which market intelligence is most closely related to information streams relevant for day-to-day processes. According to Crowley (2007) market intelligence consists of four cornerstones; competitor intelligence, product intelligence, market understanding, and customer understanding. Figure 3 illustrates this mindset in a pyramid shape. The model by Crowley (2007) can be seen as an extension and deepening of the model by Hakanen (2014) and displays concrete activities or themes by which information streams originate from. These activities or themes provide leads for studies. The difference between both models lies in the view, the model by Hakanen (2014) is using a top-down view, while the model by Crowley (2007) is a bottom-up view. This means that Crowley’s model is much more customer-oriented instead of the strategic focus the model of Hakanen (2014) starts with. The customer-customer-oriented focus of this study makes the model of Crowley more applicable to this study.
The case Webprint has limitations concerning available data which means a focus needs to be set on the area of intelligence. This study uses transaction data coming from, as self-evident, customers’ transactions. Therefore, competitive insight is not investigated in the research, since that data is not readily available (technical limitations). Secondly, because the company’s intention is to gain more insight into customer transaction data, and therefore into their database, customer insight is the cornerstone this study is built around.
2.2
Customer behavior
Since business intelligence is narrowed by focus in the previous chapter, relevant literature on customer behavior is discussed next. The literature in this part contains the subjects relationship management, the customer life cycle, and repurchase behavior. Socio-economic influences on customer behavior are discussed last.
2.2.1 Necessity of relationship management for repurchase behavior
Because of the revolution on information technology, especially the World Wide Web, companies have the opportunity to choose how they interact with their customers. “By combining the abilities to respond directly to customer requests and to provide the customer with a highly interactive, customized experience, companies have a greater ability today to establish, nurture, and sustain long-term customer relationships than ever before” (Winer, 2001, p. 89). Buying behavior on the web refers to two stages: encouraging people to purchase online which is the first stage and the second stage encouraging customers to repurchase; the essence of e-commerce. Attracting new customers instead of retaining existing customers requires more effort and time (Zhang, Fang, Wei, Ramsey, McCole, & Chen, 2011). Therefore, online customer retention attracted considerable attention in recent years, but also because it is a means of gaining competitive advantage(Tsai & Huang, 2007). Understandable, a focus on customer retention reduces the pressures associated with attracting new customers (De Bock & Poel, 2011). In order to focus on customer retention, relationships with customers have to be formed and maintained. Relationship management is therefore been present in management for a long time past but has not always postulated attention.
The importance of Customer Relationship Management (CRM) nowadays increased with regard to the past and it is often much more expensive to acquire new customers than to keep them (Phan & Vogel, 2010). CRM in e-commerce is concerned with retaining the existing customers on a long-term basis, motivating them to come back to shop for more and to talk positively to their peers about the products and services provided (Ozok, Oldenburger, & Salvendy, 2007). Ozok et al. (2007) emphasize it is five times as expensive to attract a new customer as it is to keep an existing one, customers who have relationships with companies are more loyal and less likely to switch when a better price is discovered, satisfied customers are more likely to refer new customers, and customer feedback can be effective (p.285). A good relationship in B2C e-commerce between buyer and seller is developed only when buyers feel satisfied and have trust in their relationship with the vendor; most of the literature agrees trust and customer satisfaction are the key sub-constructs of relationship quality (Zhang, Fang, Wei, Ramsey, McCole, & Chen, 2011).
Customer relations can be enhanced by different drivers, like the eight c’s, moreover CRM also comprehends certain functions (Xiong & Liu, 2011). CRM can be used to improve the service. Customers can receive personalized information based on their historical information as a service. Personalization is defined as personal interaction that is being practiced by the store to enhance customer relationships (Julian, Ahmed, Wel, & Bojei, 2015). Efficiency can be improved by CRM: enterprises can integrate the available resources, improve the overall response capacity and processing capabilities of sales department, improve the working quality and marketing efficiency of the company. CRM can reduce costs compared with traditional marketing methods by modern network technology that reduces operating costs of marketing. Sales of companies can increase by increasing the success rate and the customer satisfaction that will probably be stimulated by customer relationship management(Xiong & Liu, 2011). Customers’ needs can be predicted, targeted products and services can be provided, and the accuracy of the sales business can be improved. Customer relationship management is an important management tool to manage customer relationships and the ability to extend and repeat the customer life cycle.
2.2.2 Different phases in customer life cycle demands different approaches
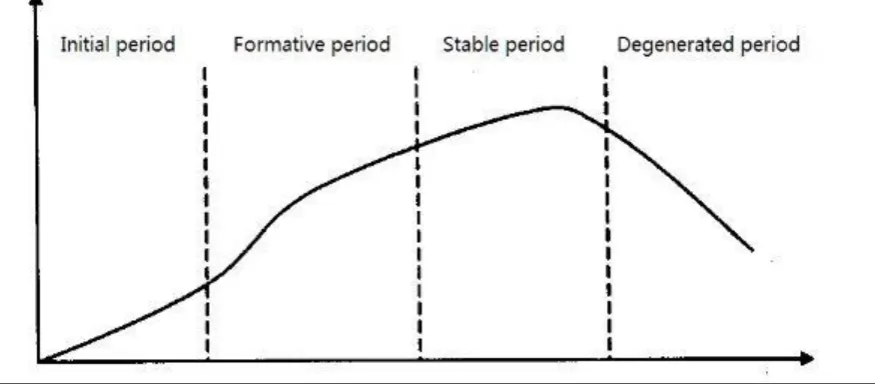
[image:13.595.81.519.439.631.2]“Customer Life Cycle is one of the most classic models in customer relationship management and refers to the whole process that a customer goes through when considering, purchasing, using, and maintaining loyalty to a product or service”(Yue & Xiang, 2012, p. 22). The customer life cycle is separated into four stages: initial period, formative period, stable period, and degenerated period (figure 4).In the initial period the relationship is very fragile and new. Vendor and buyer do not know each other and have not been able to bond yet. The formative period is a rapid stage of customer relationships, trust is gained and the relationship starts to develop quickly. The stable period is the optimal level regarding to customer relationships, whereby the customers are very loyal to the company and purchasing levels are high. In the degeneration period, customers can be lost because of different reasons, of which lowcustomer satisfaction is the main reason. Customers loyalty can decrease because of low switching costs, changed personal preferences, increased competition, or saturation of the product or service.
Acquiring customers is expensive in each industry, but is necessary in order to attain customer relationships. The early periods of the customer life cycle are pricey but costs of serving loyal customers fall in later years because of the rise of the volume of their purchases; big returns can be generated (Reichheld & Schefter, 2000). Reichheld and Schefter (2000) emphasize costs for acquiring customers are considerably higher in e-commerce than in traditional retail channels. On top of that, the authors state that new customers tend to cost twenty to forty percent more for internet companies than for traditional retailers with both physical and on-line stores. The customer life cycle can also be broke down in different steps instead of periods, by which the goal of CRM is to get the customer to move through the cycle again and again. The first step is reaching the customer, then to get their attention and show what the company can offer. Thirdly the potential target should be transformed into a paying customer, which is followed by keeping them as a loyal customer whose satisfaction with the product or services urges other customers to join the cycle.
The customer life cycle (CLC) can be divided into steps or periods, however a different point of view comes from splitting up different phases by customer characteristics, and consists of six phases(Gao, 2014). The first phase of the CLC is filled up by prospective customers. In this phase prospects’ (potential customers) interest is peaked and the next task is to provide trust, security, and incentives to ensure prospects to overcome any barriers or obstacles and become a registered or paying user or customer (customer acquisition). The second phase consists of new customers or users. Vendor and buyer try to develop a long-term relationship because ideally you do not want a customer who purchases one time and then never returns. The key is to interact with the customer in order to develop the relationship wanted. The third phase consists of active customers or users. A prospective customer has been converted into a paying or registered customer. This phase is not only about showing the customer the quality of the products or services offered but focuses on building a relationship as well. Showing customers they are important; communicate with respect and offer them interesting promotions.The fourth phase of the CLC is made up by repeat or loyal customers or users. This phase is all about offering incentives to customers to remain loyal since they are already repeat customers; you want them to keep buying even more (often). Different channels can help to keep an ongoing dialogue with your loyal customers in order to retain them. The fifth phase consists of lapsed customers or users. A customer receives the tag “lapsed” whenever contact or interest is loosed by a loyal or repeat customer; the time to transform into a lapsed customer is defined by the company itself and can therefore differ between companies. Key in this phase is to identify these customers by the time they did not purchase, then you can decide what actions are appropriate and necessary to get them buying again. The last phase includes inactive or abandoned customers or users. Lapsed customers can turn into inactive or abandoned customers that in fact do not have any purchases or contact with your company. By the use of different campaigns some customers might be coerced to get back to phase one and the cycle starts all over again. If you know the likely life cycle or pattern of a customer, changes can be made to customer communications or marketing strategy to try to optimize the length of time and the value that a customer brings to the business (Gao, 2014).
2.2.3 Influencing repurchase behavior
Much research in the area of customer retention is done in an offline context. Gustafsson, Johnson & Roos (2006) studied customer retention at telecommunications services and consider three prominent drivers of customer retention: overall customer satisfaction, affective commitment, and calculative commitment. Customer satisfaction is an overall evaluation of performance to date, affective commitment captures the trust and reciprocity in a relationship, and calculative commitment captures the existence of switching costs or lack of viable alternatives (p.215). Another study by Verhoef (2003) on customer retention with data from financial services in an offline setting displays positive influence of affective commitment, satisfaction, and loyalty programs on customer retention. Julian, Ahmed, Che Wel, & Bojei (2015) test the influence of different variables on customer retention which include: customer service, loyalty/rewards programs, customization, personalization, and brand/store community. The results indicate that customer retention is influenced by brand/store community, personalization, customization, customer service, and loyalty/rewards programs (p.199). Increasing switching costs increases the threshold of customers to leave, and makes it more likely customers stick to the same company. Different retention strategies make this concept implementable, such as loyalty programs or discounts for long time customers. “A loyalty program is a structured marketing effort which rewards, and therefore encourages, loyal behavior of customers, which is presumably beneficial to the vendor” (Enzmann & Schneider, 2005). A loyalty program is a good tool for increasing customer’s purchases and for high customer retention levels (Julian, Ahmed, Wel, & Bojei, 2015).
“Companies that succeed in their e-business initiatives are adept at creating and maintaining a long-term sustainable relationship with loyal customers” (Cheung, Chan, & Limayem, 2005, p. 5).This exemplifies why research in the consumer continuance behavior (repurchase behavior) has risen sharply, and why research on this subject becomes increasingly salient. Moreover, the increased competition in the online shopping business compels companies to focus on maintaining existing customer bases and therefore cherish long-term relationships (Kim, Galliers, Shin, Ryoo, & Kim, 2012). Buchanan and Gillies elucidate that long-term customers are more profitable for six reasons: 1) regular customers place frequent, consistent orders and, therefore, usually cost less to serve; 2) longer-established customers tend to buy more; 3) satisfied customers may sometimes pay premium prices; 4) retaining customers makes it difficult for competitors to enter a market or increase their share; 5) satisfied customers often refer new customers to the supplier at virtually no cost; 6) the cost of acquiring and serving new customers can be substantial (p. 524). Repeated customer purchasing behavior and a long-term relationship focus reflect customer loyalty. An increase in customer loyalty in most cases means increased customer shopping value and drives customer retention. Tsai and Huang (2007) investigated the drivers of customer retention in an online setting executing an empirical study. The authors found that customers are motivated to remain with a provider due to one or more of four attachments: constraint-based (they “have to”), desire-based (they “want to”), customization-based (they can “specify modifications”), community-based (they ”flock to”) (Bansal, Irving, & Taylor, 2004; Bendapudi & Berry, 1997; Burnham, Frels, & Mahajan, 2003; Jones, Mothersbaugh, & Beatty, 2000; Wathne, Biong, & Heide, 2001). Tsai and Huang found that community-based drivers, desire-community-based drivers, and constraint-community-based drivers significantly influence repurchase intentions, while customization-based drivers only indirectly influence repurchase intentions. Community building, overall satisfaction, switching barriers and customization were respectively tested. Online business seems to have advantages over offline business but the emergence of e-commerce can make the retention of existing customers even more difficult (Tamaddoni Jahromi, Sepehri, Teimourpour, & Choobdar, 2010). Competition is just “one click away” and unprecedented customer empowerment, the churn rate of customers is likely to amplify (Peng, Quan, & Zhang, 2013).
The Theory of Reasoned Action (TRA)(Ajzen & Fishbein, Belief, attitude, intention and behavior: An introduction to theory and research, 1975), Technology Acceptance Model (TAM)(Davis, 1989), Theory of Planned Behavior (TPB)(Ajzen, 1985) and to a lesser extent Innovation Diffusion Theory (IDT)(Rogers, 1995), and Expectation – Confirmation Theory (ECT)(Oliver, 1977) control the area of online consumer behavior research. ECT focuses on post-purchase behavior and is, particularly, in online repeat purchases literature a common theme. Oliver (1977) developed the concept of this model and suggests that if the perceived performance meets one’s expectations, confirmation is formed. Confirmation, as part of utilitarian shopping value, will eventually lead to consumer satisfaction. On top of that both hedonic and utilitarian shopping value are assigned to influence customer satisfaction. Zeithaml (1988) states that individuals’ satisfaction with online shopping is the overall assessment of what is received and what is given, and Kotler (1994) already emphasized that customer satisfaction is the key to customer retention (p.20).
2.2.4 Socio-economic influences on customer behavior
Socio-economic status reflects the position people have on the social ladder in combination with prestige and status. The societal status of a region is depending on several aspects of the civilians living in that region: education, income, and position on the labor market (Volksgezondheidenzorg, 2016). In scientific literature, different socio-economic factors influence customer behavior, which mainly has to do with income distribution. Nevertheless, income distribution on its own compels different causes, like residential location, education, and class position. The Marxist theory already stated that class position has a pervasive and systematic impact on income determination, which is at least as important as race, education, occupational status, or seks(Wright, 1979).
According to Leonhardt (2013) location plays a major role in income distribution. Even though location much less mattered to well-off families than for middle-class and poor families. Perotti (1996) divided society in equal and unequal societies, in which unequal societies tend to be politically and socially unstable. As a result lower rates of investment are signalized and therefore lower rates of growth. Lower rates of growth relate to lower rates of income.On the other hand, more equal societies have lower fertility rates and higher rates of investment in education, which is a stimulant for higher income (Perotti, 1996). Education gives the possibility to accumulate higher income, and therefore spending possibilities (Spilimbergo, Londoño, & Székely, 1999).
It is likely that customers from low valued socio-economic locations purchase orders with lower values than customers who come from high valued socio-economic locations. Simply because the expenditure possibilities are higher in regions with better socio-economic circumstances. Looking at the location, it is possible to check above-mentioned assumption by postal codes. Volksgezondheidenzorg, a Dutch institution, is responsible for mapping the SES score in the Netherlands. The SES score is the Social-Economic Status score which is an indication for the geographical distribution of socio-economic status.
2.3
Theoretical framework
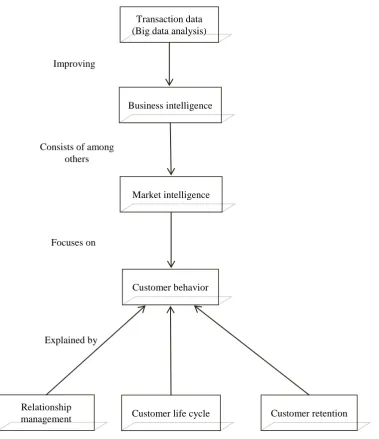
[image:17.595.90.470.207.647.2]Small to medium-sized companies often tend to have large databases of transaction data without the knowledge, capacity or will to effectively analyze the database. This study tends to improve market intelligence, as part of business intelligence by analyzing the big data within these databases. In the light of focus, the field of market intelligence is tackled to improve business intelligence. The field of market intelligence is strongly associated with the discipline of customer behavior. Customer behavior insight should be improved by analyzing transaction data, results are supported and can be improved by different marketing concepts. These concepts are discussed thoroughly; relationship management, customer life cycle and customer retention.
Figure 5: Theoretical framework
Transaction data (Big data analysis)
Business intelligence Improving
Market intelligence Consists of among
others
Customer behavior
Relationship
management Customer life cycle Customer retention Focuses on
2.4
Research questions developed from the theoretical framework
The literature discussed the value of large databases of transaction data for creating business intelligence from a theoretical, non-practical point of view. It is known that customer retention, the customer life cycle and relationship management influence customer behavior in different ways. To find out how large databases of transaction data can improve business intelligence, customer behavior is a practical concept to be investigated. As mentioned before, market intelligence can improve by examining customer behavior more closely. At the same time, increasing market intelligence knowledge increases business intelligence. It completes the theoretical model which states that big data analysis improves business intelligence, which consists of among others; market intelligence. Market intelligence focuses primarily on customer behavior, which is influenced by three concepts; relationship management, the customer life cycle and customer retention, which also overlap mutually. Increasing knowledge, by big data analysis, on these three concepts can eventually improve business intelligence. As a consequence of the theoretical model, this study added a case which raises challenges or matters on the field of customer behavior, with the focus on improving business intelligence.
Customer retention is a comprehensive concept and focuses on repeat purchases. There are many different situations, and starting point from which to investigate the broad field of customer retention. In this case, the limited insight on important data such as order information, is the cause of research. Order information from customer retention after the first purchase. Understanding of important data can be crucial to the position of a company. As soon as deeper understanding of important order information is created, it would be preferable to know how to steer customers in a certain wanted direction (type of purchase). Therefore the following research question is to be investigated by means of the case:
How can returning customers be pushed in the desired direction?
Deeper understanding of customer behavior quickly points towards exploring the customer life cycle. Logically, companies like to know of each of their customers the phase of the customer life cycle their customers are located in. Since, insight in the customer life cycle can improve customer retention and, at least as important, improve and endure customer loyalty and satisfaction(Yue & Xiang, 2012). Customer profiling allows customers to be grouped by similar characteristics, which makes analyzing customers and locating them in the customer life cycle. The customer life cycle can improve the companies decision-making. Therefore the following research question is set up to be investigated though the case:
How can the customer life cycle be used for decision-making?
In order to establish solid relationships between companies and customers, customer behavior patterns from past purchases can be analyzed. After analyzing previous customers who have returned to converse again (customer retention), more insight can be created. As a consequence, newly acquired customers can be treated better, since the probabilities of the possible reactions are (more) clear. CRM influences customer behavior by, among others, creating more customer insight. Analyzing customer behavior from previous customers, newly acquired customers can be welcomed better and current customers can be treated better. As a result, the following research question is set up to be investigated by means of the case:
How can CRM influence customer behavior by analyzing past customer behavior patterns?
In addition to customer profiling, the socio-economic status is investigated to give the research its causal research part. Customer behavior depends, as self-evident, partly on the purchasing power of the relevant customer. It is plausible that customers who do not have the same level of socio-economic status, which covers among others education and income, will have different customer behavior patterns. That is exactly the reason why the next research question is formulated:
Does socio-economic status influence customer behavior?
3
Methodology
The methodology is divided into three parts. The first part considers the research design, divided in structure and the data collection methods. The first part focuses on the overall setup and intention of the research and is therefore more general of nature. The second part includes the introduction of the case Webprint and the third part focuses on the case-oriented methodology. Practical problems at the case are linked to the theoretical research questions. The section includes detailed descriptions and further deepening of the methodology used to solve or improve relevant situations at Webprint.
3.1
Research design
3.1.1 Structure
A research design is the framework or plan for a study, used as a guide in collecting and analyzing data. In fact there are three types of research designs; exploratory, descriptive and causal. In this study the emphasis is on the discovery of ideas and insight, which is directly linked to exploratory research (Babbie, 1998). It attempts to find the value of large databases of transaction data for creating business intelligence. On top of that, the study also includes descriptive research, since it attempts to find out how insight in customer behavior can be improved to eventually create business intelligence.
There are different types of exploratory research, such as literature research, experience surveys, focus groups and analyses of selected cases (Babbie, 1998). During this study exploratory research is executed in the form of literature search. It is a quick way of spitting in existing research published by highly reputable and respected authors. Different findings from several publications have been merged into one continuing framework.
Complementary, the descriptive part of the research contains cross-sectional analysis. Principally this means that variables of interest are viewed at a single point in time, in contrast to longitudinal studies. In this research different variables will be examined at a single point in time. To illustrate, customers will be analyzed at their first, second and third purchase, the frequencies will be described with regards to, for example, order value. More details on this subject can be found in section 4.2. To conclude, in longitudinal research the distances between the different purchases do have to be equal, which means this part of the research is not longitudinal.
A causal study typically takes the form of experiments in order to determine cause and effect. A causal relationship between two variables is investigated in the last research question; whether socio-economic status influences customer behavior. Each of the three research designs participate in this study, although the causal research design is by far the smallest part.
3.1.2 Quantitative data collection methods with secondary data
The research design is discussed and explained. The purpose of the research is to create and improve business intelligence by analyzing large databases of transaction data.
Secondary data is used in this study, which means the case did not gather the data for the immediate study at hand but for other purposes. Primary data, in contrast, are originated by the researcher for the purpose of the investigation at hand (Babbie, 1998). Since data from Webprint is stored in databases held for different purposes, the data used in this study can be labeled as secondary data. One of the reasons to use this kind of data is the cost and time advantage, but the main argument is the added value for the company by using their own data. After all, the company aims to improve data knowledge; business intelligence. Secondary data often does not fit immediately, since the data is not collected to serve research goals. The secondary data used can be labeled as internal data because of the source. “Internal data are those found within the organization for whom the research is being done, whereas external data are those obtained from outside sources” (Churchill G. A., 1999, p. 221).
The source of the secondary data used in this study is Copernica Marketing Software. “Copernica is an online multichannel platform to create professional marketing campaigns and engage the audience. Copernica offers manners to store data and really understand the customer” (Copernica, 2016). Disadvantageous, the system only allows limited possibilities of exporting data, and only in certain formats. In return, this means that the data exported demands refinement in order to be able to use data in this research. Otherwise it is not able to convert data to the statistical analysis program SPSS (quantitative research), in which issues are tested or checked and insight can be improved.
As mentioned before, the research will combine qualitative and quantitative research. Quantitative data collection methods can contain different types of research instruments. Records are used as research instrument during this study. A record refers to all numbers and statistics that institutions, organizations and people keep as a record of their activities. Sources can be educational records, hospital/clinic records and census data (Nalzaro, 2012). Census data is collected and offers multiple advantages; (1) records often are unbiased, (2) records often cover a long period of time, and (3) records are often inexpensive. The IT-department at the case secured that the data used is unbiased. The records are covered a long period of time (more than three years). But, the database will still not adapt itself to the research. In other words, refinement is needed to use the database in this study. It makes it possible to measure data.
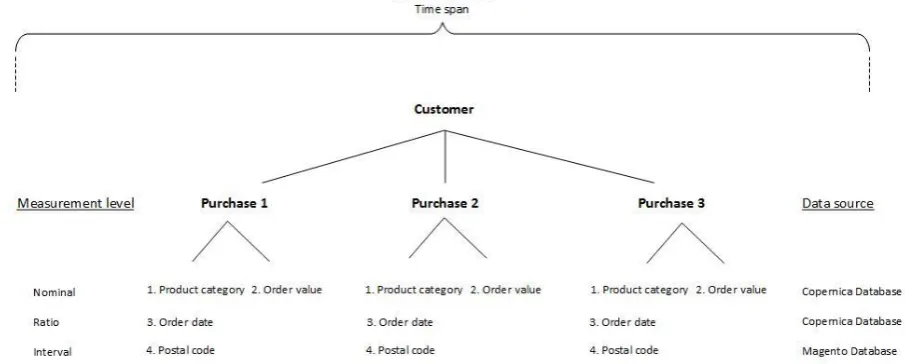
Measurement is the process by which the researcher assigns specific numbers to the collected data (Doebelin, 1990). In scientific methodology literature four different levels of measuring are separated; nominal, ordinal, interval and ratio. Ratio level is defined as the highest level of measurement (Babbie, 1998). Section 4.2 allocates the different variables to measurement levels. There are two key elements in judging the instrument of measurement; reliability and validity. Validity refers to the extent to which an instrument measures what it is designed to measure (Carmines & Zeller, 1979).
3.2
Exploring Webprint
Webprint is founded in 2004 by a private person originating from Saasveld, the Netherlands. The founder realized the process of printing personal photo’s was too expensive, and change was established by founding Webprint. During the heat of the financial crisis (2009-2013) Webprint went through very profitable years. In order to cope with strong growth the need for financial injection was inevitable. As a consequence Webprint was incorporated by investment organization Infestos (and still is). “Infestos is an independent investment organization focused on sustainable investment of capital in participations, (monumental) real estate, project development and minority interests” (Infestos, 2016).
Webprint’s main area of distribution is the Netherlands but the company has different consuming markets. Webprint.de, Webprint.fr, and prentu.co.uk are different domains in different countries. Each of the products sold are manufactured in Oldenzaal, where the company is currently located. Production is done in-house, the same counts for sales, marketing, design, and ICT. All activities are done in-house for different labels, including labels that do not carry the same name (print-things.nl). Webprint is also an external partner for different companies; these relationships characterize on two different levels. The first possibility for an external company is to have their own website, sell products, and send orders directly to Webprint who produces the products (API-production). Secondly, Webprint also maintains websites and manufactures products for other companies, so called white label websites. Under this construction the website-holder is also responsible for the traffic the web site generates; Trekpleister is an example of a white label construction with Webprint.
Webprint attempts to be recognized as the most complete online photo service in the Netherlands. The company is able to offer customers a high quality / high price - ratio because of the low manufacturing costs. Most of the products are produced automatically and mechanically from the start to the end of the production process. Exclusively activities that cannot be mechanized are manually produced by employees. Webprint has grown to a strong and multi-faceted online photo service that had substantial revenue growth rates; with a compound annual growth rate (CAGR) over the last four years of 24%. At the start of 2016 the company employed around 80 FTE. Traditionally the moment of the extreme sale values are to be forecasted; after the summer vacation and school breaks, during the November and December month, and around holidays as Valentine’s Day and Eastern. During the peak times the company runs (close to) full capacity, in contrast to periods where circumstances are not extreme or exceptional. Producing on full capacity can lower product costs (Lipsey & Chrystal, 2007).
The company tracks (aggregately) how customers entered the website after purchasing a product. Channels as television, radio and retail-partnerships are labeled as offline channels. Online channels include online sales and are managed by Google Analytics. The e-commerce platform distinguishes six different channels: (1) e-mail, (2) organic, (3) SEA (Search Engine Advertising), (4) direct traffic, (5) referrals, and (6) affiliates. Each of the channels are managed differently and enquire other decision-making processes. Communication towards customers by e-mail does not enhance the same expectations, processes and strategy as communication by referrals, which illustrates the dynamic of the channels. The ability to track customers by Google Analytics is a tool to understand customer behavior better, in so customers can be targeted better.
3.3
Webprint’s products
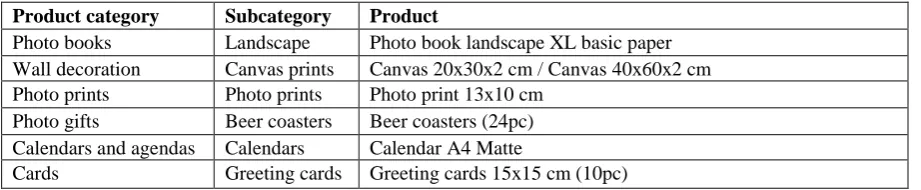
Since customer behavior is studied at a case, the importance of product assortment knowledge is necessary. To start, the online photo service, Webprint, classified their products by six different categories (or worlds, as they are called on the work floor): photobooks, wall decoration, photo prints, photo gifts, calendars and agendas, and greeting cards. Each of the categories have different specifications and, as obvious, accommodate different products. Different statistics regarding product type are tracked. Firstly, the different products each have their own unique identification code, also a stock keeping unit (SKU) code. By the use of these codes Google Analytics is able to track different statistics concerning revenues, selling quantities, conversion rates, bouncing rates, and so on.
Figure 9 (Appendix I) displays different diagrams from each of the six categories. First of all, the stakes of the six categories in relation to each other are shown. The photo book category, the wall decoration category, and the photo print category each demand approximately 25% of the total revenues. As self-evident, this means these three product categories provide for 75% of total sales revenues. Greeting cards, photo gifts, and calendars and agendas provide the remaining 25% of the revenue streams displayed. In order to take a closer look at the specific categories and to support figure 9 (Appendix I), table1 is brought to life.
Table 1 reflects which stock keeping units are of great importance to the revenue share of the category in question. Landscape photo books do generate most of the revenue within the photo books category. Product-wise, the proportion of revenue coming from sales of the photobook landscape XL with basic paper is the largest. Canvas prints are generating the most revenue in the wall decoration category. Specifying further, two dimensions of canvas prints are most popular: 20x30x2 cm and 40x60x2 cm. Photo prints have the biggest quantity share in total sales while the revenue share in total sales is equal to wall decoration and photo books. Especially the photo print 13x10 cm is contributing hugely to the revenue stream coming from the photo prints. Photo gifts, calendars and agendas, and greeting cards are the remaining 25% of total revenues. Beer coasters are most popular based on revenues in the photo gifts category. Within calendars and agendas the calendars is the best-performing subcategory, and the calendar A4 Matte is the best performing calendar. Looking at the greeting cards product category there are two types of subcategories; postcards and greeting cards. Greeting cards are much more popular, in particular during December, because of the Dutch habit of sending greeting cards with Christmas. The size 15x15 cm in a package of ten pieces is most contributing to the revenues in the cards product category.
In order to gain more insight in the selling processes of Webprint, I would recommend to read the additional information, which can be found in Appendix II, section A, B, and C. In these sections the online channels are discussed thoroughly, and it will become clear how products are sold to customers in an online setting.
Insofar the study of the case. The case-oriented methodology is discussed next.
Product category Subcategory Product
Photo books Landscape Photo book landscape XL basic paper Wall decoration Canvas prints Canvas 20x30x2 cm / Canvas 40x60x2 cm Photo prints Photo prints Photo print 13x10 cm
Photo gifts Beer coasters Beer coasters (24pc) Calendars and agendas Calendars Calendar A4 Matte
[image:22.595.70.531.541.636.2]Cards Greeting cards Greeting cards 15x15 cm (10pc)
3.4
Case-oriented methodology
3.4.1 Case data
The data is generated from Copernica, as mentioned before. It lists around 407.000 different orders from customers who were registered and bought products from Webprint.nl. Customers who did not have three orders, in other words less than three, were excluded. The file was reduced to around 260.000 different orders. This file still included customers’ fourth and older purchases. In order to set focus, these particular orders were excluded as well. The dataset is reduced to 37.668 unique customers. Each of the customers’ first three orders were displayed, together with the order date, product category and order value. In conclusion, the dataset included 113.001 purchases made by 37.668 unique customers. At last, the residential information of the customers is generated from Magento database.
Copernica was only able to export data to a certain degree, which means that the format of the data was not prepared for the tests in this study. Transforming data into usable data was time-consuming and not convenient. Macro’s in Microsoft Excel and calculations in formulas enabled data to be structured appropriately. Columns and rows needed to be exchanged, and data was continuously filtered in order to work with a complete and correct file.
3.4.2 Units of analysis
Each of the research questions, besides the non-case related research questions, include the same units of analysis. It involves customers from Webprint.nl, which means only from the Dutch domain, not from Germany, Belgium, the UK or France. The customer needs to be registered at Webprint.nl and will therefore have a customer account and profile. Besides that, to be part of this research, customers need to have fulfilled at least three separate purchases. The time span in which the units of analysis are observed or tracked is around three years. There are no other constraint variables for customers to be part of this research. To compete in this study the following criteria need to be matched:
- Customers from Webprint.nl
- Customer need to have an account at Webprint.nl, registration is necessary - Customers need to have at least three purchases at Webprint.nl since June 2013
3.4.3 Tackling issues at the case
[image:23.595.68.521.571.753.2]How can returning customers be pushed in the desired direction?
The research question as outlined above will be answered by investigating customer behavior patterns at Webprint. One of the goals of Webprint is to increase their photobook sales. The company aims to sell more photobooks because this product type associates with the values of the company, and should become the core business. As mentioned before, the data covers the first three purchases of the customers. Therefore, the purchases before the purchase of a photobook will be analyzed. This means when the second purchase is a photobook, the preceding purchase is examined. At the same time, when the third purchase contains a photobook, the preceding two purchases are analyzed. As a consequence, cross tables will be set up which increase insight into the customer behavior before purchasing a photobook. As soon as the customer behavior before purchasing a photobook is analyzed, it might become more clear for Webprint to steer customers towards the purchase of a photobook (desired direction). Knowledge on the field of customer retention is gained.
How can CRM influence customer behavior by analyzing past customer behavior patterns?
Previous customers’ behavior patterns will be analyzed to uncover the influence of CRM on customer behavior. To address this research question, attempted is to find the customer roads with the lowest and highest frequency. In the context of this study, a customer road refers to the possibilities customers have in the first three purchases on the variable product type. As self-evident different combinations are possible and by determining the least and most used customer roads, retention can be enhanced. The customer roads provide insight in the motivation of customers to retain, it offers CRM a chance for a long-term relationship. CRM motivates customers to shop for more and talk positively to their peers about the products provided (Ozok et al, 2007).
How can customers be profiled to position them in the customer life cycle?
After examining customer roads more closely, the case will select customer behavior patterns which are the most interesting for their business. Webprint can choose this pattern with different motives, which can be in the light of revenues or the future direction of the company. As a consequence customers, selected for their interesting behavior, are profiled on base of average subtotal, coupons codes used, average amount paid and residence. It offers a starting point for locating customers in the customer life cycle, which creates deeper understanding of customer behavior and eventually improves business intelligence.
Does socio-economic status influence order value?
In addition to customer profiling, a test is enhanced to examine the relationship between socio-economic status and order value. A random sample of n=50 is taken, which is declarable. The number of units investigated in this test is not high, because this test is performed to give an indication of the relationship. It attempts to show what the database is capable of generating. The socio-economic status (SES) statistics for the Netherlands, per postal code, is available at the Sociaal en Cultureel Planbureau. The output contains scores that are determined by a few characteristics; education, income and position on the labor market. To be more precise, the SES score is calculated by four percentages: average income per postal code, average percentage of residents with low income, average percentage low educated residents and the average percentage of residents who do not work. By the use of a factor-analysis of these characteristics the final SES score is determined. A status score of 0 (SES = 0) implies an average score; the average in the Netherlands overall tracked is zero. The higher the SES the better the societal status, reversely the lower the SES the worse the societal status.
3.4.4 Drawback of the dataset
Secondly, the most expensive product is put forward, this product will be in most cases the motivation behind the order. It downsizes the influence of the drawback discussed above.
4
Results
4.1
Structure of the results section
The dataset consists of 37.668 unique customers who have at least three purchases in the store Webprint.nl. The main variable in this study is product category, whereby order value, order date and postal codes are the other three variables. Findings are shown on the base of product category frequencies from purchase one, two, and three. Statistics around the main research variable provide insight and understanding of the purchase rank and purchase content of customers at their first three acquisitions. A structured way of increasing customer insight is developed and can be translated in different chapters, categorized by customer retention, CRM and the customer life cycle. The structure of the results are discussed next, starting with customer retention.
Customer retention
In section 4.2.1 purchase one is fixed; calculated is the possibility the second order contains products from the same product category as in purchase one. Section 4.2.2 applies a different approach, and examines the other possibilities besides the same product category. This means the section tends to find out what the other possibilities are, if the second purchase does not contain products from the same product category as purchase one. Cross tabulations are used to gain customer insight and database understanding.
The same counts for the visual representation of the structure of the calculations for sections 4.2.3 and 4.2.4. In section 4.2.3 and 4.2.4 the same happens as in section 4.2.1 and 4.2.2. However, there is one difference, the first sections show findings on purchase one and two, while the latter focuses on purchase two and three. Cross tabulations are used to gain customer insight and database understanding. It is tested for each of the seven product categories.
Section 4.2.5 combines different sections in so the possibility a customer buys three products from identical product categories can be calculated. This is calculated for each of the seven product categories.
Section 4.2.6 focuses on the photo books category. Photo books are set up as fixed in the second purchase, from there on purchase one (the preceding purchase) is variable. It means this section attempts to find out the distribution of purchases before the purchase of a photo book. In section 4.2.7 the same is tested, but focuses on purchase two and three, in which purchase three is fixed (photo book category) and purchase two is variable.
Customer relationship management
Section 4.3 examines the most frequent customer roads from the first three purchases. This is also done for the least frequent customer roads. Ten of the most and least frequent customer roads are displayed in section 4.3. By the use of SPSS the function AGGREGATE is used. The function creates variables holding statistics over cases (Van den Berg, 2013). It enables analyses on combinations of different variables with different measurement levels. Purchase one, purchase two, and purchase three were assigned to be BREAK variables, in so the customer road were displayed.
The customer life cycle
Section 4.4 shows findings based on customer profiles from the most interesting customer roads found. It is an addition to section 4.3 in which the customer roads are revealed.
4.2
Calculations in the field of customer retention
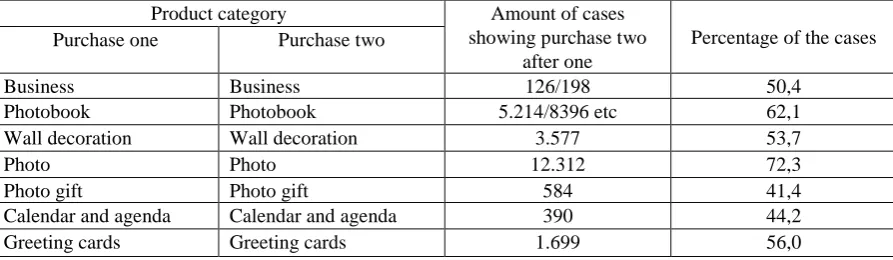
4.2.1 Customers who buy the same product in purchase one and purchase two
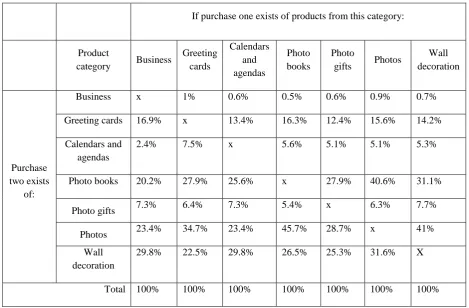
To calculate the amount and shares of possibility of equality between purchase one and two on the base of product category, cross tabulations are set up (appendix III). In appendix III, two cross tabulations are displayed; both tables have the same content but table 13 shows row percentages while table14shows column percentages.
The percentage of the cases displayed in table 2, shows the possibility of a second purchase to be a product from the business category if the first purchase contained a business item. Self-evidently, this counts for the percentage of the cases of each of the seven product categories. The amount of cases includes the statistical presence of the second purchase to be the same (on the base of product category) as the first purchase.
Product category Amount of cases showing purchase two
after one
Percentage of the cases Purchase one Purchase two
Business Business 126/198 50,4
Photobook Photobook 5.214/8396 etc 62,1
Wall decoration Wall decoration 3.577 53,7
Photo Photo 12.312 72,3
Photo gift Photo gift 584 41,4
Calendar and agenda Calendar and agenda 390 44,2
[image:26.595.75.522.251.381.2]Greeting cards Greeting cards 1.699 56,0
Table 2: Calculations on purchase one and two
Five out of seven assumptions are above 50%, two assumptions showed results less than 50%. The results of customers who bought products from the same products category in purchase one and two were: business (50,4%), calendars and agendas (44,2%), cards (56%), photo books (62,1%), photo gifts (41,4%), photos (72,3%), and wall decoration (53,7%). The strongest relationship was displayed by the photos category.
4.2.2 Customers who do not buy the same product in purchase one and two
This section shows results per product category from customers that bought a fixed first purchase, but the second purchase is variable and not the same as the first purchase. Results of the seven product categories are shown in appendix III, section B, and in table three below. Findings worth mentioning are summed up next. But, before mentioning results on this topic, the following underlying statistics has to be kept in mind:
In overall order frequencies and in order frequencies per purchase, photos are on top, secondly photo books, and thirdly wall decoration items.
In the following results, purchase one is fixed and second purchases that contain an item from the same product category as in purchase one are excluded. This also counts for the displayed percentages.
Business items are by far the least ordered product, both in terms of order frequencies and in terms of revenues, this is why business items are only considered in the analysis as fixed first purchase, and not as variable second purchase.