Abstract 3
Abstract
Acknowledgements
First, I would like to thank my two daily supervisors, Khiet Truong and Randy Klaassen for their support of this research, for their input and knowledge about the subject. I am also grateful to my third supervisor Dirk Heylen for taking the time to grade my work. Finally, I want to thank my fellow students from the HMI master and CreaTe bachelor, who helped me with my experiments and gave their (unasked) advice when needed.
Pim Willems,
Acknowledgements 5
Table of Contents
Abstract ... 3Acknowledgements ... 4
List of Figures ... 8
1. Introduction ... 10
1.1. Research goal ... 10
1.2. Structure and methodology ... 11
1.3. 4TU Scope ... 12
2. Literature review ... 13
2.1. Mood and emotions ... 13
2.2. Mood measuring methods ... 14
Facial expressions ... 15
Speech and Language ... 17
Movement ... 17
Bio signals ... 17
Conclusion ... 18
2.3. Empatica E4 ... 18
Physiological signals ... 19
Mapping physiological data to existing affective states ... 20
Single subject physiological profile ... 21
2.4. Self-reported mood measuring ... 21
Pick-A-Mood ... 22
Alexithymia ... 23
2.5. Lighting and ambiences ... 24
Biological and Psychological level ... 25
Ambient Lighting ... 26
Phillips Hue ... 27
2.6. Inducing mood ... 28
2.7. Target group ... 30
Interviews with caregivers ... 30
Caregiver overview and persona ... 33
Physiological signals at elderly persons ... 34
3. Methodology and experiments setup ... 35
3.1. Design ... 35
3.2. Participants and sampling ... 36
3.3. Materials ... 38
TAS-20 ... 38
Pick-A-Mood ... 38
Philips Hue ... 39
Empatica E4 ... 41
Mood induction ... 41
Context mapping ... 42
Mood controlled ambient lighting system ... 44
Living room ... 53
Participant’s own living room ... 54
3.4. Procedure ... 55
Experiment 1 ... 55
Experiment 2 ... 57
3.5. Data analysis ... 60
Experiment 1 ... 61
Experiment 2 ... 62
4. Results for Experiment 1 ... 67
4.1. Pick-A-Mood ... 67
4.2. Physiological data (E4) ... 69
4.3. Atmosphere perception ... 71
5. Results for Experiment 2 ... 74
5.1. Context mapping ... 74
5.2. Baseline ... 74
5.3. Baseline + Context mapping ... 76
5.4. Event detection ... 80
5.5. Peak detection algorithm ... 81
Performance of the algorithms ... 82
The implemented algorithm ... 84
5.6. Atmosphere perception ... 84
Acknowledgements 7
5.8. Interview results ... 89
The process ... 89
The results ... 90
6. Discussion and Limitations ... 92
6.1. Experiment 1 ... 92
6.2. Experiment 2 ... 93
6.3. In general ... 95
7. Conclusion ... 97
8. Future work ... 101
9. Bibliography ... 103
10. Appendix ... 108
10.1. Consent form first user test ... 108
10.2. Questionnaire after the first user test ... 109
10.3. Context mapping diary results ... 110
10.4. Physiological data with context mapping results for day 4 and 5 ... 113
List of Figures
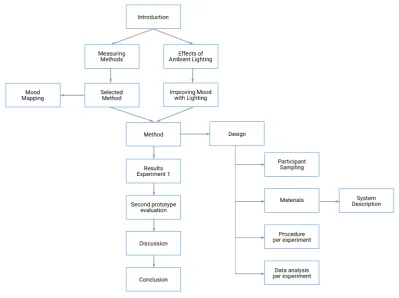
Figure 1 - Visual overview of this report ... 12
Figure 2 - Two versions of the eight mood states expressed in Pick-A-Mood ... 23
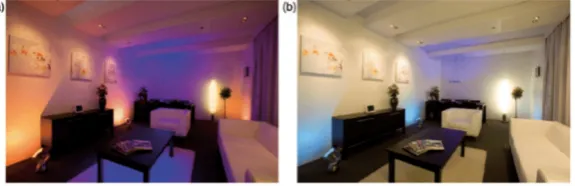
Figure 3 - The two examples of lighting used in the interviews: ... 30
Figure 4 - Senior Mood Model by Huldtgren et al. ... 32
Figure 5 - Lighting settings for experiment 1 ... 40
Figure 6 - Four pages of the developed context mapping diary ... 43
Figure 7 - Difference between natural and non-natural peaks ... 46
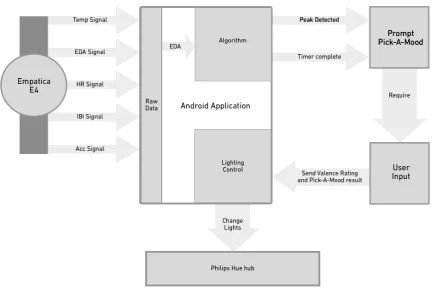
Figure 8 - Data flow of the android application ... 49
Figure 9 - System data flow overview for experiment 1 ... 51
Figure 10 - Screen 1, the idle situation ... 52
Figure 11 - Screen 2, the Pick-A-Mood Interface ... 52
Figure 12 - Screen 3, the error screen ... 53
Figure 13 - Living room test setting (pictures + map) ... 54
Figure 14 - Map of the participant's living room during experiment 2 ... 55
Figure 15 - Visual overview of the procedure of the second experiment ... 60
Figure 16 - Boxplot of the means of the EDA signal during and after the video ... 69
Figure 17 - Boxplots of the mean EDA signal per ambient lighting setting ... 70
Figure 19 - Physiological data with the context mapped events marked for first three days .. 78
Figure 20 - Two example context mapped events ... 79
Figure 21 - Peaks without context map reference on day 3 ... 80
Figure 22 - Context mapping, EDA Explorer and Algorithm put on the EDA ... 83
Figure 23 - The four atmospheres tested in the second experiment ... 85
Figure 24 - E4 measurements in the evening, with the ambient lighting activated. ... 87
List of Figures 9
List of Tables
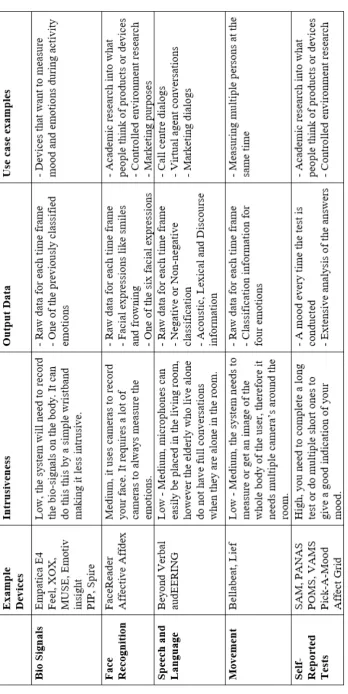
Table 1 - Overview of the mood measuring methods ... 16Table 2 - A persona of an elderly person who might use the system ... 34
Table 3 - Participant profile for experiment 2 ... 37
Table 3 - Overview of which materials are used per experiment ... 38
Table 4 - Overview of the used Philips Hue settings per atmosphere for experiment 1 ... 39
Table 5 - Schematic overview of the test procedure ... 56
Table 6 - Schematic overview of the procedure of the second experiment ... 59
Table 7 - The used atmosphere item words per dimension. ... 62
Table 8 - Pick-A-Mood results from experiment 1 (each row being a different participant) .. 68
Table 9 - Negative self-reported moods per lighting setting. ... 68
Table 10 - Descriptive overview of the mean EDA signal per lighting setting ... 71
Table 11 - Average atmosphere items rating per lighting setting ... 72
Table 12 - Atmosphere rating per dimension ... 72
Table 14 - Overview of the physiological baseline for the participant during experiment 2 .. 76
Table 15 - Algorithm performance, Z score versus EDA explorer ... 84
1.
Introduction
With the ageing of the population the percentage of elderly in the world grows each year. For example, in the Dutch elections of March 2017 over a quarter of the people that are allowed to vote are the age of 65 and over (NOS, 2017). One of the biggest problems with this group is the feeling of loneliness (Botek, 2014). A lot of elderly still live independent or live in an assisted living residence, which most of the time results in returning home to an empty living room in which they need to entertain themselves. By combining several small improvements to the home of the elderly it is possible to improve the negative mood (for example loneliness) of the elderly and make their living room a positive experience again. One of the simpler ways to do this, is to change the ambient lighting inside the living room to an interactive version which can measure the mood of the resident and change the lighting accordingly. This autonomous system should be able to do at least two things, namely measuring the mood of the person living in this room and controlling the Lighting around the house. This research area is a combination between two areas, namely Mood recognition and adaptive Lighting, which are combined into Emphatic Lighting. Emphatic Lighting is the kind of lighting that can automatically adapt to how the users feels or behaves when they are present in the room it is installed in. The emphatic lighting discussed in this thesis focusses on a system that can measure the negative affective states or moods, such as loneliness or gloominess, and improve these states. The improvement of these states is done by building on existing research on the effect of lighting and the colours of lighting to improve the negative states.
1.1.
Research goal
Introduction 11
- How can a system be developed to automatically measure and increase the mood of the elderly by changing the lighting in their living room?
And the sub research questions are:
1. Which mood measuring method can be best used to measure the effect of light on the mood of the elderly?
2. How can the measured signals be mapped to mood models?
3. What is the user experience and how do the elderly respond to the ambient lighting in the room?
4. In what way does the lighting in the living room need to change to improve the mood of the elderly?
1.2.
Structure and methodology
Figure 1 - Visual overview of this report
1.3.
4TU Scope
Literature review 13
2.
Literature review
The research area of adaptive lighting in combination with mood recognition is a wide research area in which different kinds of subjects and theories need to work together to develop a functioning system. It is a combination of recognizing and defining mood, measuring the changes and events in mood, the effect of ambient lighting on mood and the different ways of combining all this at the home of the elderly. This chapter will investigate the existing research in adaptive lighting and mood recognition, starting with the definition of mood and measuring methods and ending with the effect of (ambient) lighting on mood.
2.1.
Mood and emotions
Before continuing with the literature background on mood and measuring mood, a clear definition for mood needs to be selected. There are different definitions available which explain what mood is and how it is related to other affect states like emotions and affect itself. In research by Ekkekais (2012) he explains that there are three main categories when looking at the affective domain, namely Mood, Emotions and Affect. These three terms are used interchangeably in such a way that the distinction is not always clear. Ekkekais therefore comes with the following definition of the three terms: Affect is the neuropsychological state that is accessible to person, meaning that the person experiences effect constantly in the shape of pleasure, displeasure, tension, relaxation or tiredness. Emotions are a "complex set of interrelated sub-events concerned with a specific object", meaning that an emotion is a reaction to something which can be in the shape of anger, fear, jealousy, pride and love. He shortly mentioned mood as something that is not per se about a specific thing.
are episodes of coordinated changes in several components in response to external or internal events of major significance to the organism. With this definition, Scherer tries to compare affective states to each other in a small table. He compares Emotion with Mood, but also with Interpersonal states, Attitudes and Personality Traits. The biggest difference between mood and emotions lie in the intensity and the duration. While emotions are relatively short lived, mood lasts a lot longer and can stay unchanged for a whole day. The emotions however are more intense, because of their event focused nature and their impact on the behaviour of the person itself. Using this research from Scherer, Frijda and Ekkekais results in the following definition for mood, which will be used throughout this thesis: “Mood is the affective state that does not have to be about a specific event, is less intense than an emotion and has a long duration (ranging from parts of the day till weeks)”. During the thesis, the focus will not only lie on mood, but also on shorter affective states. The term mood will only be used when speaking of an affective state that lasts longer than 8 hours. When considering different affective states during the day, we call these emotional states. These are affective states which last shorter than moods, but at least last for an hour.
Most researchers use two measurements to define the mood a person is in. They use a valence and arousal rating. Valence says something about the pleasure or displeasure the person experiences (higher valence means a more positive mood) and the arousal ratings tells how activating the mood is (a low arousal indicates sleepiness). By combing valance and arousal into one scale, every existing or known mood can be mapped and compared to each other. Valence and Arousal were first mentioned in the research by Russel on the circumplex affect model (1980). More recent mood measuring scales take the circumplex affect model further and use only the valence and arousal ratings to indicate the mood of a person, examples of this are Pick-A-Mood and the SAM scale (Bradley & Lang, 1994; Desmet, Vastenburg, & Romero, 2016).
2.2.
Mood measuring methods
Literature review 15
of situations, while the automatic methods are relatively new and are not yet supported with the same amount of research (especially the bio signals). Each of the different measuring methods is discussed per type in the preliminary research (Willems, 2017). The preliminary research concluded with a table that gives an overview of the researched measuring methods, see Table 1. By using the preliminary research on the research methods, a choice can be made for a suitable mood measuring method which can be used to measure the effects of lighting on the mood of the elderly. The discussed methods are facial expressions, speech and language, movement and bio signals. These methods are all automatic, meaning that they do not require any input from the user to measure the mood, in comparison to the self-reported methods discussed in Chapter 2.4.
Facial expressions
Literature review 17
Speech and Language
Speech and Language mood measurements use the acoustic, lexical, and discourse information to measure the positive or negative affect within the speech of the elderly (Lee & Narayanan, 2005). There are already products that can be used to measure the affect within speech which could be implemented into an emphatic lighting system, but this only works when there are conversations within the living room of the elderly (Beyond Verbal, 2017). Unfortunately, this is not always the case; one of the biggest reasons of the negative feelings at the elderly is loneliness. This does not mean that there are not visits to these elderly, but it does mean that the do not have a conversation on a regular basis, making it not the right choice for this project.
Movement
Movement is a mood measurement method that focusses on the movement of a (group of) person‘s body (Crane & Gross, 2007). This type of mood measurement is mostly used to measure the mood or emotions of more than one person. When implementing the movement measurement at the home of an elderly person it would require them to move around a lot, or at least more the upper part of their body while sitting. This is not something which happens a lot when they are for example watching the television. Thereby another disadvantage is, like with the facial expressions method, having a lot of cameras around to house to track the body movements, which can again give the elderly the idea that they are being watched.
Bio signals
A less intrusive affective state measurement method uses bio signals. Measurements via bio signals use a combination of signals, which consist out of electrodermal activity (EDA), heart rate (HR), heart rate variability (HRV), accelerometers, skin temperature and the time. In the past, the measurements of bio signals were done by placing sensors on the fingers (with some gel in between) and have them wired to a computer, but with the introduction of wristbands that can do the same it has become easier to implement this in an autonomous system. By using bio signals the user is not restricted in his or her movement and it can even measure the signals outside the living room, giving a better overview of the mood during the day.
human’s electrodermal activity (2015). In the research by Picard it shows that there is not one single emotion or event that triggers electrodermal activity or arousal, but that it can happen as a reaction to a lot of things, for example stress, excitement, fear, pain, anticipation, events, startle/orientation or emotional engagement. By combining the EDA information with other bio signals it is possible to detect more specific emotions, however each combination works differently and might differ per person. The electrodermal activity, for example, may vary depending on the state of the sweat glands in the skin. When the state of the sweat glands start to change, for example when you start to sweat a little, it is a direct indication that the person is aroused in a psychological or physiological way. But this state might differ per person, while one person will start to sweat a lot when for example in doubt, another’s sweat glands might not respond at all.
Conclusion
Comparing each of the existing methods for mood detection it becomes clear that measuring the affective state via bio signals has more advantages than the other measuring methods. The biggest reason for this is the use case for desired system. In this system, the elderly need to be able to move around their house freely, while being tracked by the system. This can be implemented using some of the other methods as well, but that will require a bigger setup for the system (for example more cameras to record most facial expressions). Existing products likes like the Feel and the Empatica E4 can be used to get a good overview of the bio signals of the user, and are not limited to camera positioning (Willems, 2017). Unfortunately, the Feel wristband is not yet available, making the Empatica E4 the only option that measures all five bio signals at the same time.
2.3.
Empatica E4
Literature review 19
Physiological signals
When people are scared or frightened, they do not only notice this emotionally, but they also notice changes to their bodies. We, for example, start to sweat, our breathing becomes rapid and our muscles tense (Haag A. , Goronzy, Schaich, & Williams, 2004; Kandel, Schwartz, Jessell, Siegelbaum, & Hudspeth, 2000). These effects have in common that they are all mediated by the autonomic nervous system, according to Haag et al. These body reactions can be monitored and measured, which are then named the humans bio signals. These measured signals can give insight into the affective state of the user when they are measured correctly. Each of the E4’s sensors has a unique bodily reaction or physiological response that it measures (Haag A. , Goronzy, Schaich, & Williams, 2004).
Heart Rate Variability. The heart rate is used to determine the heart rate variability (HRV). A low HRV can indicate a state of relaxation in comparison to a state of stress or frustration, which is indicated by a high HRV (Haag A. , Goronzy, Schaich, & Williams, 2004).
Blood Volume Pulse. The blood volume pulse (BVP) is a measure that can indicates the amount of blood which is running through the blood vessels of a person. This can be used to measure the vasoconstriction and the heart rate (Haag A. , Goronzy, Schaich, & Williams, 2004).
Skin Temperature. Skin temperature indicates the temperature of the surface of the skin. When the body and the muscles are tense, they will contract the blood vessels, making the skin temperature a little lower (Haag A. , Goronzy, Schaich, & Williams, 2004). This can give a good indication of the muscle tensions, but unfortunately it is a relatively slow indicator of changes in the emotional state. Thereby it is influenced by the external factor temperature, which should be considered when using the electrodermal activity signal.
Accelerometers. Accelerometers are used to measure the bodily movements. This can be used to for example explain the difference in bodily temperature or electrodermal activity, because when a person works out those two measurements will also increase (Empatica Inc., 2016).
Mapping physiological data to existing affective states with Machine Learning
When measuring each of the five physiological signals stated above, there is no information about the actual mood or affective states yet. It is necessary to first define a method to map the output data coming from the five sensors into specific affective states. Unfortunately, there does not exist a perfect bio signals mapping methodology. This has two reasons: First, it’s a relatively new research area. Second, each person has his or her own response to emotions and mood, a so-called bio signals baseline, making it impossible to create one map which fits perfectly to each person (Villon & Lisetti, 2006; Picard, Vyzas, & Healey, 2001). According to Picard et al. (2001) there are several problems when you want to measure the baseline affective state of the user. First, there is almost no way of knowing whether the person was truly in a specific emotional state which is needed to begin a test. Thereby the user can be irritated by something which he or she remembers suddenly, but has nothing to do with the experiment itself. Another option is to ask the person how he or she feels, but this depends on their emotional awareness and might differ per affective state and person.
Literature review 21
There are also approaches in which the researchers do not investigate how the bio signals can indicate a specific emotion or mood, but how it can indicate emotional arousal. The most used algorithm to do this is the EDA explorer, which is made freely available through the web by Taylor et al. (2015). This algorithm uses machine learning to look for features in an EDA signal to find natural skin conductance responses or peaks. Other algorithms can also be tested to detect peaks in the EDA signal, a more basic algorithm is the smoothed z-score algorithm (Jean-Paul, 2014) which functions without machine learning. This algorithm, discussed on StackOverflow, is not developed specifically for an EDA signal, but is focussed on real-time data and peak detection nevertheless.
Single subject physiological profile
Another approach to the mapping of physiological data is discussed in research by Picard et al. (Picard, Vyzas, & Healey, 2001), in which they approach the mapping by following a single-subjects over many weeks of time and recorded their bio signals during different parts of the day. They chose to follow a single subject because some forms of emotions are not only person-independent, but also have different interpretations across cultures. By using only one person, Picard et al. hope to maximize the chance of getting consistent measurements for each emotion. The method used can be used for other subjects as well, the results are subject-dependent which makes them less useful for the machine learning algorithms. By following the single subject for a couple of weeks and having daily measurement moment they achieved a classification accuracy on eight classes of emotions of 81%.
2.4.
Self-reported mood measuring
machine learning algorithms and bigger sources of bio signal data. To do this, there needs to be another measurement method which can be used to decide the valence rating of the participant’s mood. In the preliminary research, there are different types of self-reported mood measurements discussed (Willems, 2017). These mood measurement methods can be used without a lot of effort and only require the user to answer the given question(s) to map their mood. There are two types of self-reported mood measurement tools, the first uses a questionnaire to let the participant answer questions about his or her mood and the second uses a visual questionnaire of one or more questions. The visual questionnaire takes a lot less time in comparison to the questionnaire type because it only requires the participant to select on image. The visual questionnaire is less precise in defining the mood of the participant and relies more on the participant’s input, while the longer questionnaires use specific questions to define the user’s mood. Because of the speed of a visual self-reported method, the choice was made to use a visual self-reported mood measurement tool. In the preliminary research, the SAM scale, Pick-A-Mood, the Affect Grid and VAMS are discussed and compared. All four are verified to measure the mood of a participant, making the choice more a personal preference. In the end, the Pick-A-Mood scale was chosen, which is the newest of the four visual self-report mood measurement methods. In comparison to the other methods, Pick-A-Mood combined both the valence and the arousal dimension of the participant’s mood into one choice. This makes it faster for a participant to select his or her mood, because it only takes one step in comparison to for example the SAM scale which takes two steps.
Pick-A-Mood
Literature review 23
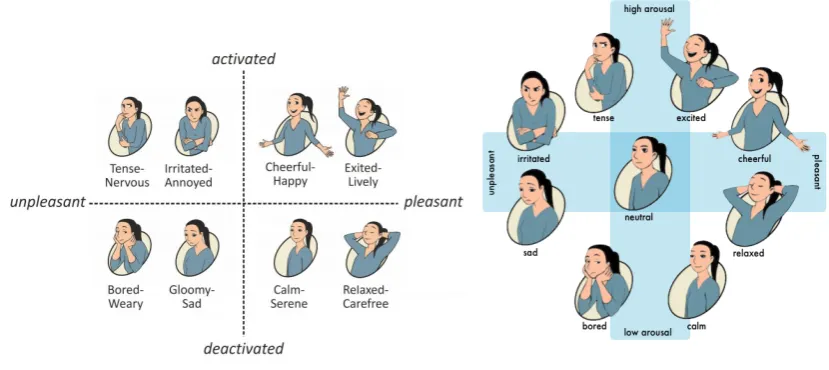
[image:23.595.89.504.117.302.2]in the mood of the participant. The visual representation of the moods can be found in Figure 2.
Figure 2 – Two versions of the eight mood states expressed in Pick-A-Mood
In the A-Mood manual the researchers behind the visual scale explain how to use Pick-A-Mood in new research (Desmet, Vastenburg, & Romero, 2016). They advise to use the eight images in one selection process, meaning that you will show the images all at once so that the user can compare them to each other. Thereby the choice between the different characters (female, male or robot) is a personal choice, because according to the validation research of Desmet et al. (2016) there is no character-effect in the resulting mood reporting. The two visual representations from Figure 2 differ in the fact that one uses a neutral state and the other does not. It is not necessary to use a neutral state to measure the mood states, but you can implement one if it is needed for the specific research. When doing so the researcher should keep the clear design and have the neutral state really at the middle of the other states (like the right image with the blue cross).
Alexithymia
One way to rule out people with Alexithymia is to test a user beforehand with the Toronto Alexithymia Scale (TAS-20). The goal of the TAS-20 is to measure if a person has difficulty describing or identifying emotions and if the person is used to focus their attention externally (and not internally) (Taylor, Ryan, & Bagby, 1985; Association for Contextual Behavioral Science, 2017). The TAS-20 is a self-report scale which consists of 20 items, which each use a 5-point Likert scale from 1 till 5. After filling in the TAS-20 scale, the user gets a score between the 0 and 100 with a cut-off scoring: a score between 0 and 51 means non-alexithymia, a score between 52 and 60 is possible alexithymia and a score above 61 indicates alexithymia.
2.5.
Lighting and ambiences
Light and ambient lighting can influence persons in a wide range of ways, from becoming happy when seeing the sun to a specific shade of red that reminds you of your first love. Light itself is an electromagnetic radiation within a part of the electromagnetic spectrum, but the words light and lighting focus mostly on the visible light which has a wavelength in the range of 400 – 700 nanometres (between ultraviolet and infrared which we humans both cannot see) (International Commission on Illumination, 1987). Light exists out of several properties, of which hue (or the wavelength), brightness and saturation are the most important ones for this research. Hue is the property that gives light its colour, meaning that if the wavelength of the light is between the 620 and 645 the light will have the colour red, while a wavelength between the 460 and 490 will have the colour blue. Brightness is the property that describes the intensity of the light. Most lightbulbs and other light sources use the lumen scale to show how much light the user can expect from the light. Saturation focusses on the how the colours look, meaning that some colours can appear more faded than other. This means that if the saturation increases, the colour will become (for example) a purer red, while if the saturation decreases the red becomes less pure and more washed-out to white.
Literature review 25
overcast night sky has 0.0001 lux, an office building has 160 – 400 lux and full daylight gives 10.000 to 25.000 lux of illuminance (Schlyter, 2017; Pears, 1998).
Biological and Psychological level
In the preliminary research, we distinguish two types of lighting influence, namely the effects at a biological level and the effect at a psychological level (Willems, 2017).
Biological level
A direct biological effect is the amount of released melatonin in the body that can change when a person is exposed to bright light (Lewy & Sack, 2009). When the melatonin levels change, it will influence the circadian rhythm, which can cause things like a sleep disorder or mood changes (Boyce & Barriball, 2010; Bedrosian & Nelson, 2013). Researchers continues with this information and looked at the effect of lighting on the melatonin levels. They proved that the melatonin levels are lowered a lot when exposed to blue light, are slightly lowered when exposed to green light and almost does not change at all when exposed by red light (Thapan, Arendt, & Skene, 2001). This means that the amount of light with a short wavelength (like blue light) increases the alertness of the person and therefore is more arousing than green light, which in turn is more arousing than red light.
Psychological level
Not all lighting influences people on a biological level only, it can also influence a person on a psychological level because of association with past experiences. In opposite to the biological influence, red cards are more arousing than blue cards because of the biological influence (Yoto, Katsuura, Iwanaga, & Shimomura, 2007). This is because red is connected to past experiences; red is mostly used for warning signs, while blue is associated with more relaxing memories and blue skies (Kaiser, 1984). Multiple researchers agree with Kaiser and produced research that has the same results (Küller, Mikellides, & Janssens, 2009; Ali, 1972).
Combing Psychological and Biological influences
valence ratings, while the saturation only increases the valence rating (when it does not get too saturated). The mood is also influenced by the appraisal of the lighting by the users themselves. When a person judges the lighting to be just right his self-reported mood would increase, while his self-reported mood would decrease when the light was too bright or too dim.
Ambient Lighting
The found outcomes are mixed (between biological and psychological influences) and while they do show the high potency of influencing mood with lighting, they do not give a clear answer to the question which lighting should be used to improve the mood of the elderly. Kuijsters et al. add to this that the mood is not only influenced by the lighting, but also by other environmental factors (temperature) and personal preferences and already existing mood states (Kuijsters A. , Redi, de Ruyter, & Heynderickx, 2015). Kuijsters et al. argue that the perception of the atmosphere has the biggest influence on the mood. In a different study by Kuijsters, Redi, Ruyther, Sautiëns and Heynderickx (2014) they investigated how ambiences can influence (and improve) the elderly’s wellbeing. They created two different ambiences which would counteract the two negative moods, namely anxiousness and sadness. They created these ambiences by focusing solely on the psychological effects of coloured lighting.
To create the required ambiences, they used the perception of the ambience, for which they rely on the concept of atmosphere. Atmosphere is defined by Vogels as the experience of the surrounding in relation to ourselves, through the perception of external elements and internal sensations (2008). Meaning that the atmosphere has the potency to change the affective state or the mood of the people experiencing it. Vogels mapped the perceived atmosphere of an illuminated room in four dimensions, namely cosiness, liveliness, tenseness and detachment. Based on these four dimension Vogels developed a questionnaire to measure the perceived atmosphere. Using this measurement tool several studies have been conducted on atmosphere (Custers, de Kort, Ijsselsteijn, & de Kruiff, 2010; Vogels, de Vries, & van Erp, 2008). This tool revealed the following perception of the atmosphere:
- Warm white light (2800 K) is perceived as cosier and less tense in comparison to cold white light (6000 K).
- Increasing the illuminance from 40 lx to 400 lx resulted in a less tense, less cosy and a livelier atmosphere.
- There is a negative relation between brightness and cosiness.
Literature review 27
that the mood is measured in the two dimensions: Valence and arousal, which is also used by Russel and Prat (1980) and seems related to the atmosphere model of Vogels. They do note that most studies are performed with young people and do not consider if ageing influences the perception of the ambience. For example, the ageing of the eye will result in a decline of the sensitivity to light. Knez and Kers also found out that older people think a room is less bright and warmer in comparison to younger people (2000). In their studies, they let lighting designers create ambiences and averaged their designs into four testable ambiences. The affective state was recognized by the younger participants, while the elderly ones did not always recognize it. To solve this, they did a photo interview with the elderly and created new ambience upon the results.
The new ambience did work, and they conclude that it is possible to create a pleasant, low arousal ambience and a pleasant, high arousal ambience for the elderly. The first ambience needs functional white lighting with a low colour temperature (red and white light) in combination with a warm coloured accent lighting. The second ambience needs white lighting with a high colour temperature (blue and white light) in combination with a cyan coloured accent lighting. Thereby they concluded that the elderly do not like colour pairs and prefer only one colour in the accent lighting.
In a follow-up research by Kuisters et al. (2015) they set out to verify if the preferred atmospheres do indeed have influence on the mood of the person inside the room. To do this they induce two negative mood states: Anxiety (negative valence, high arousal) and Sadness (negative valence, negative arousal). They combine these two states with two opposite atmospheres, namely cosy (positive valence, low arousal) and activating (positive valence, high arousal). By testing 15 minutes per participant they measure the effectiveness of the atmospheres, using the SAM scale and bio signals. The test resulted in a clear improvement in the mood of the elderly over the recorded 15 minutes. This means that asking the elderly how they perceive the atmosphere is an effective method to find the light settings to increase the mood of the elderly.
Phillips Hue
work via your smartphone or tablet. However, there are existing homemade projects that combine Phillips Hue lamps with basic mood recognition software to make it change colour depending on the emotions of the people in the room. Phillips Hue originates from the Philips Ambilight, which is ambient lighting created to improve the television watching experience. The Ambilight uses backlighting to make the television images more intense. The processor of the Phillips Hue is also used in the research by Kuijsters et al. to create the different ambiences (2014).
The Philips Hue light bulbs and API do not use the Lumen and Kelvin based system to change colour, but they use a combination of four components, namely brightness, saturation, hue and colour temperature. The lightbulbs range from 340 lumens at 2000 Kelvin to 806 lumens at 4000 Kelvin, while they can also reach a higher Kelvin with a lower lumen (550 lumens at 6500 Kelvin). There is no actual table or guide about how the Philips Hue settings can be translated into Kelvin and Lumen values, therefore the brightness, saturation, hue and colour temperature will be reported when the Philips Hue light bulbs are used.
2.6.
Inducing mood
With the research on mood and mood recognizing, there is one aspect that is used in a lot of related literature, namely the induction of mood. The induction of mood focusses on putting a person in a specific, researcher chosen, mood, by exposing the person to a (series of) media that is designed to have a clear influence on the person. Inducing mood is generally done to measure the effect or impact of mood on other processes (like creativity), but it can also be used to measure the impact of for example lighting on the mood. In this chapter, different methods for inducing mood at the participants are investigated.
Literature review 29
IAPS photo set
The IAPS photo set can be used to induce mood and is for example used in the research by Haag et al. (2004; Lang, Bradlet, & Cuthbert, 2001; Center for the study of Emotion and Attention, 2001). This photo set uses over 800 pre-classified photographs, which each have a valence and arousal level. There are photo’s in the set which can be used to normalise the mood, which then can be follow up with photographs with either a higher valence or arousal (or both). Some of the photographs can have a disturbing effect according to Haas et al. making it necessary to increase the arousal levels progressively to minimise the disturbing effects. Thereby they also showed the high arousal, negative valence photographs last, because they were found to be disturbing to let the users return to the normal resting state after seeing them. In the IAPS set each photo is indexed with a valence and arousal rating. The valence and arousal ratings range between 1 and 9; for valence 1 equals very negative and 9 very positive and for arousal 1 equals very low arousal and 9 equals very high arousal.
Gross and Levenson movie set
In the 4TU empathic lighting project (Kuijsters A. , Redi, de Ruyter, & Heynderickx, 2015) they chose to use a mood induction procedure based on viewing movie excerpts. They used two short film segments selected from the database of Gross and Levenson (Gross & Levenson, 1995), which would induce sadness and anxiety. This database was created to provide a set of films that would elicit each of eight emotional states (amusement, anger, contentment, disgust, fear, neutral, sadness, and surprise). They concluded with 16 films that successfully elicited the first seven emotional states and to a lesser extent the eight state, fear.
Combining foreground and background inducing methods
2.7.
Target group
While investigating the different aspects of mood recognition and Emphatic Lighting it is hard to not discuss the influence of the target group. Almost each specific part of the research depends on the user of the product. For example, face recognition cannot measure the mood constantly when the user moves around a lot. The target group for this project are the elderly who live in an assisted living home. The elderly that live alone in assisted living homes often experience negative emotions or moods, such as gloominess due to the distance from their families or anxiety when disoriented (e.g. due to dementia) (4TU Emphatic Lighting, 2017). This chapter will discuss the target group and how they might respond to Empathic Lighting and is based upon the research of the target group in the preliminary research (Willems, 2017).
Interviews with caregivers
[image:30.595.156.444.634.727.2]In previous research by the 4TU Empathic Lighting research group they focused on which things should be considered when designing adaptive lighting to improve the elderly’s mood (Huldtgren, Katsimerou, Kuijsters, Redi, & Heynderickx, 2015). As part of the design process Huldtgren et al. conducted interviews with caregivers from different kinds of care settings (day care, stationary care and home care) to gather requirements for the design of a future system. For the interviews, they started out with caregivers in care homes located in Delft and caregivers from a care home specialized in people with dementia in The Hague. During the interviews, they decided to expand the study by also interviewing caregivers from an organization offering independent living units, and comparing afterwards how the design requirements would differ for each care setting. To give the interviewees an idea about how adaptive lighting could be used to change the mood of the elderly they showed the interviewees two examples of lighting in a living room, one cosy and one activating setting (see Figure 3). At the analysis of the interviews Huldtgren et al. identified recurring ideas and themes, which they categorized in higher level themes, namely Mood and Emotion, Mood in seniors with and without dementia, Mood recognition and Influences on mood.
Literature review 31
The interviewed caregivers identify mood and emotions mostly by their duration. Emotions are a reaction to something that happens, while moods last a longer period. The caregivers know that moods can last days or even more than a week, but when a gloomy mood for example exceeds several weeks the caregivers would consult a doctor. In the case of dementia, the moods are either more negative more often (mild dementia) or the moods change more quickly (severe dementia). One big consideration is the fact that the caregivers for dementia patients talk about single cases, which means that an automatic mood recognition system will have a hard time recognizing these emotions. This might mean that the system needs to be tailored to a specific case.
Mood recognition is something that each caregiver does when he or she enters the room. The mood of the patient changes the way the caregiver interacts with the patient. One thing all the caregivers mentioned is that the longer they know the patient the easier they can recognize the mood state, while this is almost impossible with new patients. The two most important aspects which the caregivers use to recognize the mood are the facial expressions (the eyes) and the voice of the person. The caregivers mainly focus on the negative moods, in which they recognize Gloomy/Depressive, Scares/Nervous and other moods. The caregivers talk about depression when they refer to a medical condition which can be treated and diagnosed by a doctor, while gloominess is something similar but cannot be connected to a medical condition. The biggest difference between the two is that with depression the patient is more withdrawn,
they are more focused on the inside, introverted. The scared of nervous mood is something which happens mostly at the dementia patients. They recognize this by observing that the patient wants to move or when he or she cannot focus on the conversation. Other negative moods are almost never observed, and if they are observed they are almost always connected to a specific disease.
Huldtgren et al. conclude their design considerations with a mood model which displays which factors influence the mood and how this is recognized by the caregivers. This mood model is called the “Senior Mood Model” and can be seen in Figure 4. Overall the caregivers’ reactions to the system were diverse, they were positive towards using light to improve the mood, but they think that it might not work with patients who suffer from dementia (it might bring feelings of anxiety to the surface).
Figure 4 - Senior Mood Model by Huldtgren et al.
Literature review 33
Caregiver overview and persona
By using the interviews Huldtgren et al. did with the caregivers it is possible to create an overview that will sum up this chapter point wise. From the interviews the following requirements come forward:
- Caregivers know the difference between moods and emotions. They say that moods last longer, especially gloomy moods, in comparison to emotions and do not always have a clear reason. This confirms the mood definition set in Chapter 2.1.
- Caregivers focus on mostly the negative moods, because they want to improve the negative ones, which is the same goal as this research has.
- Caregivers find it easier to identify moods when they know the person better.
Caregivers use a combination of facial expressions and speech recognition to identify different mood at the elderly. They gain this ability because of their experience in the elderly care and do not (yet) use any tools for this. In addition to these requirements a persona is created, which will serve to identify the user (group) for the ambient lighting system. The persona will help to define on what kind of person the system and the user experience should focus. A persona is an archetype, which means that it is used as an example for what kind of users will use the system (when finished) (Junior & Filgueiras, 2005). This persona can be used as a model of a user that will benefit most of the system. By comparing the participant(s) with the created persona, it is easier to look at the results in another perspective (and not see them as the ground truth). For this purpose, the persona of “Jannie van Vlissen” was created and is displayed in Table 2.
Jannie van Vlissen
Age: 85Gender: Female
Working status: Retired
Living situation: House within retirement home
Situation Jannie is a retired 85 years old female, who lives in an apartment
A day in the life Jannie lives alone in her apartment in the city next to the village in which she has lived her whole life. She does not have a lot of friends in the retirement home and does not leave her apartment when it is not necessary. She loves to watch television or read a book, but is not as mobile as she used to be. She uses a walker when she needs to walk through the supermarket or goes outside the retirement home for a longer time. Jannie playes board games with a group of friends on Monday and gets visits by one of her children on Tuesday and Saturday. On Wednesday, she visits the game evening at the retirement home (where they play mostly bingo). On Friday she eats in the canteen of the retirement home and on Sunday she does not have a regular event.
Table 2 – A persona of an elderly person who might use the system
Physiological signals at elderly persons
With an elderly participant, the effectiveness of the physiological data measuring with the Empatica E4 should be checked and tested beforehand. This is because the elderly are known to have drier skin, which might influence the skin conductance (iMotions biometric research platform, 2016). When the skin is too dry it might have a skin conductivity which is too low to pick up by the E4, resulting in a EDA signal which is not useable. To make sure the E4 could measure the physiological data from an elderly person, this was tested beforehand. An elderly person (age 83) wore the wristband a whole evening. Fortunately, the data from the elderly person did not differ from the other participants who had participated in the first experiment, showing that it is possible to use the E4 to measure the physiological activity at an elderly person.
2.8.
Conclusion
Methodology and experiments setup 35
3.
Methodology and experiments setup
This chapter describes the method used to answer the research questions of this research. First, the design of this research is explained. Next, the participants, the materials and the procedure of the experiments are described. Finally, the data analysis is described.
3.1.
Design
To answer the research questions of this research, mixed methods are used. First, an experiment is conducted to review the related and used literature from the Chapter 2, which is called the first experiment. Building on this first experiment, experiment 2 is conducted to answer the remaining research questions, including the main question.
To answer the first research question, the first experiment will record the physiological mood measuring method on the background of the user test. This EDA data will not have any influence on the first experiment, but will record the influence each part of the experiment has on the physiological data of the person.
To answer the second research question, the first experiment also focusses on how the physiological EDA data can be used to detect peaks in the arousal state of the participants. The EDA signal will be recorded and stored to be compared to the Pick-A-Mood results and the mood inducing video timing.
To answer the third research question, the second experiment will let the participant interact with the system without guidance of the researcher. The participant uses each part of the system and needs to report her mood when requested by the system. Thereby during the second experiment, the participant will be interviewed about her experience with the system and especially her experience with the changing ambient lighting.
To answer the fourth research question, the findings from related literature about mood affective ambient lighting is reproduced during the first experiment. These findings are analysed on effectiveness and on how the participants perceive the chosen ambient lighting settings. In the second experiment, the outcomes of the first experiment are reproduced in the living room of an elderly person. This setup is tested for longer periods of time to look at the effectiveness of the ambient lighting.
system and automatically measure and improve the mood of the participant using a self-reported mood measuring tool and an ambient lighting setting which is perceived as very positive by the participant beforehand. The self-reported mood measurements, the physiological data and the experiences of the participant are then used to look at the effect of the ambient lighting on the mood of the participant.
3.2.
Participants and sampling
The first experiment does not yet use elderly people as the participant, but first uses younger people to test the system and verify the found literature from Chapter 2. To determine who will be part of the first experiment, the snowball method was used. Snowball sampling is a method that selects several key participants and request them to recruit other people (Biernacki & Waldorf, 1981). These steps were repeated until the needed sample size was found. The criteria for the participants is that they do not test positive for alexithymia. This is tested by the TAS-20 test before the start of the experiment. The TAS-TAS-20 results are anonymized, meaning that the participants did not know if their data was not used because of a too high TAS-20 score. During the first experiment only one participant scored too high on the TAS-20 and this participant’s data was not used. In total, 20 people participated in the user test. In total, 14 were male and 6 females. The average age of the participants is 24, ranging between 18 and 35. The participants all have the Dutch nationality. Beforehand, the participants signed a consent form which is required by the ethical committee of the Faculty Electrical Engineering, Mathematics and Computer Science at the University of Twente, which can be found in Appendix 10.1. This committee approved the setup and procedure of the first experiment.
The participant selection of the second experiment has two sides to it, namely the participant should match the persona created in Chapter 2.7.2 and the participant is recruited via the criterion sampling method. The criterion case sampling is used to select the participant that meets the predetermined criterion of importance. Three criteria were identified: the participant should live alone, like described in the persona and the participant should be able to self-report on everyday experiences, emotions and moods, and thus not have any form of Alexithymia. One participant was selected for this second experiment, because of the explorative part of this research. That way, there are opportunities to learn as much as possible about the research problem and questions on how to develop the system in the future with more possibilities.
Methodology and experiments setup 37
profile of the participant fits almost perfect when compared to the persona from chapter 2.7.2. She is also an elderly woman who lives alone in an apartment. The biggest difference is the location of her apartment. While the participant still does everything herself, the persona makes use of the facilities of the retirement home.
The Participant
Age: 82Gender: Female
Working status: Retired
Living situation: Independent apartment
Situation The participant lives alone in an apartment, which is not a retirement
home. The apartment is in an apartment complex in which mostly people live that are retired (the ages of 60+). The participant has two sons and two grandchildren. She lives in a small village in Overijssel, the Netherlands (approx. 5500 inhabitants) in which she lived for the biggest part of her live (50+ years).
A day in the life The participant does not have a certain daily routine, but does have a weekly routine. The daily routine is focussed on at least seeing one person a day. On Mondays, she plays a game of bridge in a big group, on Tuesdays she plays bridge in a small group of four and eats fish together with her neighbour, on Wednesday she goes to aqua gym together with a friend, on Thursday she visits her daughter in law, on Fridays her son, daughter in law and granddaughter eat at her house, at Saturday both her sons visit her in the morning and on Sunday she always spends the morning with a friend. Furthermore, she is an active iPad user and loves reading books or the newspaper, making jigsaw puzzles and watching television. The participant experiences negative moods in her daily life, but these moods do not always have a clear reason. These negative moods also depend on the week, meaning that some weeks she experiences only a couple of negative emotions or moods, while sometimes the whole week she is in a slightly negative mood.
3.3.
Materials
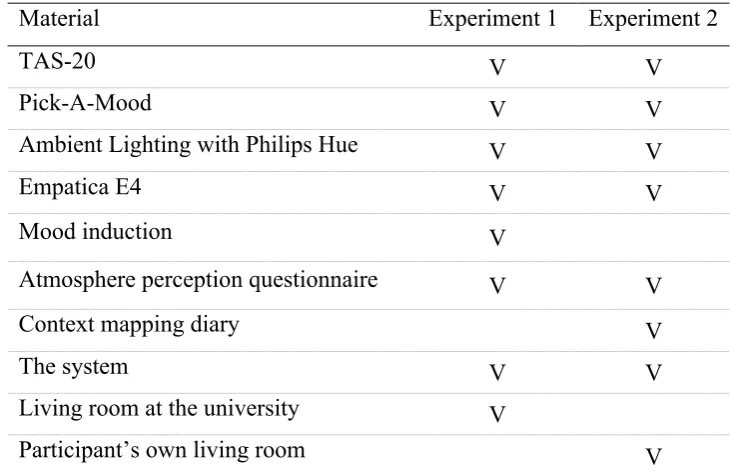
To answer the first two research questions and to investigate parts of the system needed for the second experiment, several materials are used in the first experiment and second experiment. Most materials used in the first experiment are re-used in the second, but also new materials were used. An overview of these materials can be found in Table 4. A thorough explanation of each material is given in this chapter.
Material Experiment 1 Experiment 2
TAS-20 V V
Pick-A-Mood V V
Ambient Lighting with Philips Hue V V
Empatica E4 V V
Mood induction V
Atmosphere perception questionnaire V V
Context mapping diary V
The system V V
Living room at the university V
[image:38.595.113.479.221.458.2]Participant’s own living room V
Table 4 - Overview of the materials used in the experiments
TAS-20
The TAS-20 test will be done before both experiment to test the participants for Alexithymia, which is explained in Chapter 2.4.2. The test results in a score between 0 and 100, of which a score of 52 or higher identifies the presence of Alexithymia. This test is done by using the Dutch version of the TAS-20 test developed by Taylor et al. (1985). The test gives a score between the 0 and 100, of which the participant should score below 52 to be sure he or she does not have possible Alexithymia.
Pick-A-Mood
Methodology and experiments setup 39
Prior to using the Pick-A-Mood self-report mood measurement tool in the experiments, a small test was conducted with participants to test the use of the system. After having used the Pick-A-Mood self-reported mood measurement tool, the participants reported that the tool was easy to use. None of the participants mentioned that he or she did not know which of the eight moods represented their current mood state. This shows that this is a usable and is therefore used for both experiments.
Philips Hue
To investigate the influence of the ambient lighting on the participant during both experiments, a set of Philips Hue lighting is used. This set consists of a Philips Hue Bridge which is connected to the system and three light bulbs. The colour and intensity of these three light bulbs can be controlled by the system.
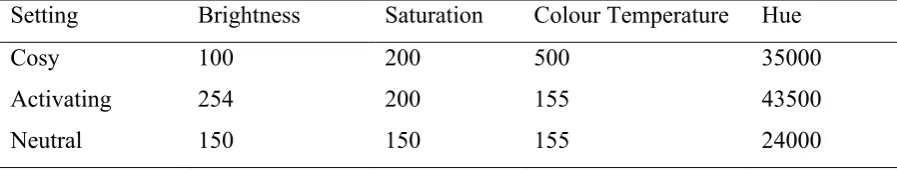
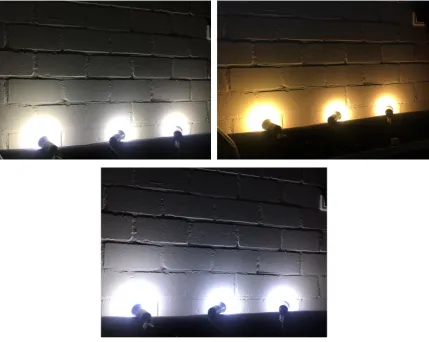
During the first experiment, in addition to the Philips Hue also two other lighting sources are used in this experiment, namely a standing lamp and a desk lamp. These two additional lighting sources both have an incandescence light bulb, emitting a warmer yellow light. For the first experiment three lighting settings are used, that will be described in Chapter 2.5.2. All three settings use the two lighting sources and change the Philips Hue to create a different ambience or atmosphere. The overview of the three settings can be found in Table 5. These settings are also displayed in Figure 5. However, this figure does not show the settings as used in the living room, but only the direct lighting coming from the individual light bulbs.
Setting Brightness Saturation Colour Temperature Hue
Cosy 100 200 500 35000
Activating 254 200 155 43500
[image:39.595.72.521.500.585.2]Neutral 150 150 155 24000
Figure 5 - Lighting settings for experiment 1 (l.r.t.b. Neutral, cosy and activating setting)
In the second experiment, the system controls the same ambient lighting as in the first experiment, consisting of three Philips hue light bulbs and including the Philips Hue Bridge. The lighting which is already present in the living room is used, consisting out of two lighting sources which can be seen in the map of the living room displayed in Chapter 3.3.9. Two different ambient lighting settings were used, namely the neutral and the cosy setting. The neutral setting represents the lighting which the participant normally has in her living room, by making use of the Philips Hue. The cosy setting was chosen together with the participant, using the perceived atmosphere from Vogels (2008), and will be discussed in the procedure of the second experiment in Chapter 3.5.2.
Methodology and experiments setup 41
Empatica E4
In the first experiment and in the second part of the second experiment, the Empatica E4 will connect to the system via Bluetooth and put in streaming mode. In this mode, the Empatica E4 will not store the data on wristband, but will send the data real-time to the system, which will use the data for the peak detection algorithm. The E4 will not send the data real-time towards the system in the first part of the second experiment, but will record and store the data on its flash memory. This data will be uploaded using the build-in functionality, called Empatica connect.
Mood induction
During the first experiment, the participant will get a sad mood induced. This is because the first experiment relies on having the participants in this specific starting mood, which is used to remove as much as possible the differences between the affective state of the participants at the start of the test. By using a method that is already extensively researched and has a high efficiency, the different participants will get into a similar affective state or mood at the start of the experiment.
A sad mood has both a low arousal and low valance, which is the negative mood that occurs the most for the elderly that live alone according to the target group study. To induce a sad mood, emotion indication method by Rottenberg, Ray and Gross (2007) was used. This is an updated version of the original Gross and Levenson (1995) movie set as discussed in Chapter 2.6. There are in total three movie clips recommended to induce a sad mood in this movie set, namely the Champ, Lion King and Return to me. The emotions of these movies (Amusement, Anger, Confusion, Disgust, Embarrassment, Fear, Happiness, Interest, Sadness and Surprise) are indexed on a scale from 1 to 8. From the three recommended sadness movie clips, Return to me gives the highest mean sadness score (7.0 for males and 6.93 for females). Therefore, this clip was chosen to induce the mood of the participants.
two emotional events during the full duration of the clip, namely the moment the happiness turn to sadness (at the hospital) and when the man returns home and tells the dog his wife died.
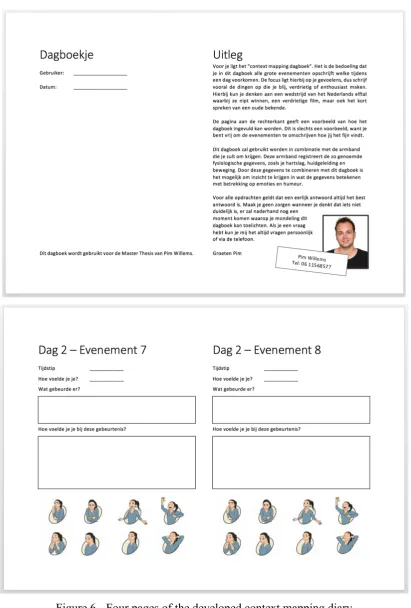
Context mapping
During the second experiment, a context mapping diary is used to get insight into the emotional events that occur to the participant during the day. Context mapping is a method which can be used to gain insight into the everyday experiences, emotions and even moods (Stappers & Sanders, 2003). Most research into context mapping is focussed on mapping how people interact with (new) products (Sleeswijk Visser, Stappers, Van der Lugt, & Sanders, 2005). Designers use context mapping to get more insight in what the users need and how they might use the product. There are different tools and techniques available to map the context of the participant. Sleeswijk Visser et al. (2005) and Gaver et al. (1999) identify four elements that can be used for the mapping: a disposable camera, a workbook, a diary and postcards. This experiment requires the participant to note down all the events in their life that engage them emotionally. This can be done using either a workbook or a diary, of which the diary method is chosen. For this experiment, the participant will need to write down in the diary everything what she experienced during the day that has emotionally influenced her, which will also help the participant to think about what is happening during his or her day.
Methodology and experiments setup 43
Mood controlled ambient lighting system
The main system used during this thesis is called the Mood Controlled Ambient Lighting System (to be referred to as system). This system was developed to measure the physiological data and use this data to change the ambient lighting. This system combines the physiological data measured by the Empatica E4 with the ambient lighting created by the Philips Hue. The system uses a peak detection algorithm to detect changes in the arousal state and uses the Pick-A-Mood self-reported mood measuring method to get the valence of the emotion. Hence, this section will discuss the development of this system.
Requirements
Before starting the development of the system, a list of requirements was made. This list was used to ensure that the system could handle different types of situations that were encountered during this research. These requirements were based on the literature review and the experiment design to answer the research questions.
Requirement 1 - The system should connect to the Empatica E4 and receive the physiological data real-time from the wristband via Bluetooth.
The first and main requirement is the need to create a connection between the Empatica E4 and the system. The system needed to connect to the Empatica E4 wristband and get a real-time stream of data from the E4. This data stream should consist of the full set of sensor data, which can be recorded by the Empatica E4. The data included the heart rate, blood volume pulse, EDA, temperature and accelerometer data. This requirement is related to the first two sub research questions, which require the system to measure the physiological data so it can be mapped to different moods.
Requirement 2 – The system should be able to detect a peak in the EDA signal which indicates emotional arousal at the user.
Methodology and experiments setup 45
requirement relates to the second sub research question, which requires the system to map the physiological data to useable definitions of mood.
Requirement 3 – The system should be able to control the Philips Hue lighting bulbs by connecting to the Hue Bridge via the API.
To change the ambient lighting around the house of the user, the system should change the Philips Hue lightbulbs settings. The light bulbs are controlled via the Philips Hue bridge. The system should therefore be able to connect to the Philips Hue Bridge and change the ambient lighting by changing the individual connected Philips Hue light bulbs via the Bridge. The system connects to the Philips Hue Bridge using the Philips Hue API, which enables the system to change the lighting settings. The main research question and the second and third sub research questions require the system to change the lighting around the house to positively influence the mood of the participants.
Requirement 4 –The system should have a Pick-A-Mood interface with which the user can interact to self-report his or her current affective state.
The system uses peaks to detect changes in the emotional arousal state, it does not give any information about the valence of the emotion or mood. By using the self-reported mood measurement tool Pick-A-Mood the system can ask the user about the valence of his or her mood or emotion. This requires the system to have a Pick-A-Mood interface which is used by the user to pick one of the eight Pick-A-Mood characters.
Requirement 5 – The system should provide the user with a GUI with which the user can interact.
The system should have a Graphical User Interface (GUI) with which the user can interact. The system should give the user the option to change the lights manually. This can be done by giving the user a couple of ambient lighting states to choose from, but also by using the Pick-A-Mood interface to change the light according to his or her affective state. The use of an GUI is required by the third sub research question, and will be used to test the user experience of the participant while interacting with the system.
The device
required for the system. The system can also be installed on other phones or tablets running Android, but only if they have at least Android API level 25. This API level is needed to use the low energy Bluetooth connection required for the Empatica E4 Bluetooth connection.
EDA peak detection algorithm
The first two requirements indicate that a peak detection algorithm is required to be able to detect changes in the mood of the participant. The algorithm which will detect these changes, should rely on the natural peaks in the physiological signal, meaning that the peak should rise slowly and not consist out of one small peak. Boucsein (2012) provides a complete description of the characteristics of an EDA signal and refers to a EDA response that lasts between one and five seconds and has a steep onset and an exponential decay. However, this cannot be directly copied into a working system or algorithm, according to Taylor et al. (2015). Taylor et al. detect peaks with their EDA explorer algorithm using multiple parameters focussed on slopes that are not always perfect. With these parameters, they try to also remove the errors or wrong measurements that occur because of for example the movement of the sensor. In Figure 7, the difference between the natural peaks and non-natural peaks is visualized. The non-natural peaks are most of the time the result of an error in measurement, because it consists of only one or two high values and does not show an increasing slope before the peak or a decreasing slope afterwards.
Figure 7 - Difference between natural and non-natural peaks
Methodology and experiments setup 47
at a derivative, for which a function is required beforehand. Two existing algorithms were discussed in the literature review in Chapter 2.3.1 and will be described in the next paragraph.
EDA Explorer
Research of Taylor et al. (2015) describes the development of a machine learning algorithm for automatically detecting EDA peaks and provide an empirical evaluation of the classification performance of this algorithm. The authors encoded the machine learning algorithm in a web-based version which is free to use with anyone’s data (designed for data from either the Empatica E4 or the Q Sensor by Affectiva) (Taylor, S. et al. 2015). This web-based algorithm does not only detect peaks in recorded EDA data, but is also able to filter noise out a signal and label Epochs. Taylor et al. (2015) focus on pre-recorded epochs (periods) within EDA signals with a length of five seconds. The authors concluded with a classification algorithm that uses the amplitude, the mean, the first and second derivative to detect peaks in the EDA signal.
For the EDA explorer algorithm, different kinds of settings can be changed to detect different kind of peaks, namely the minimum amplitude, the offset, the filter frequency, the filter order, the max rise time and the max decay time (Taylor S. , et al., 2017). The minimum amplitude set the minimum value the EDA signal needs to have before it can be counted as a peak. The offset is the number of second the derivative must be positive before a peak and negative after a peak. This offset is used to detect a natural peak. The filter frequency is a cut off frequency in Hz for the EDA signal. The filter order is the number of poles in the filter. The higher the order, the steeper the cut off on the filter. The max rise time is the maximum number of seconds before the peak reaches its highest point. The max decay time is the maximum number of seconds before the peak decays into 50% of the amplitude.
Smoothed z-score algorithm