Determinants of investment policy of Dutch pension funds
Keywords: pension fund, pension fund investment policy, pension fund determinants,
sponsoring firm determinants, risk management theory, financial distress costs, life-cycle theory, moral hazard and governance
Master Business Administration Specialization Financial Management
Supervisors from University of Twente: Dr. X. Huang and Dr. H. van Beusichem Name and student number: Juliet Kerkhof - S1480448
E-mail: j.a.kerkhof@student.utwente.nl
Table of Content
Chapter 1: Introduction 3
Chapter 2: Institutional setting 7
2.1. Types of pension plans: defined benefit, defined contribution and hybrid schemes 7 2.2. Company-, and industry-wide pension plans and plans for professionals 10
2.3. Dutch pension system: three pillars 11
2.4. Regulatory environment regarding pensions in The Netherlands 12
Chapter 3: Pension fund investment policy 14
3.1. Pension fund investment process 14
3.2. Pension fund asset classes 15
Chapter 4: Pension fund determinants 18
4.1. Average wealth participants 18
4.2. Pension fund’s maturity 18
4.3. Pension fund’s size 19
4.4. Pension fund’s funding ratio 19
4.5. Governance and structure board of trustees 20
Chapter 5: Sponsoring firm determinants 23
5.1. Sponsoring firm leverage 23
5.2. Plan type 24
Chapter 6: Research methods 25
6.1. Regression model 25
6.2. Variables and measures 25
6.3. Data sources and sample criteria 27
Chapter 7: Data 28
Chapter 8: Results 36
8.1. Regression results 36
8.2. Regression results using year-average values 39
8.3. Robustness checks 40
Chapter 9: Conclusion 44
Chapter 1: Introduction
March 2015, the total amount of assets of Dutch pension funds amounts to 1,353 billion euros. This makes pension funds one of the biggest players of the Dutch institutional investment market. The total amount of assets is influenced by the contributions and investment returns, the latter one being the most important. Despite, the fact that the total amount of assets of Dutch pension funds is rising, there are concerns regarding the ability to pay pensions when due (Bikker and De Dreu, 2007; Centraal Bureau voor de Statistiek, 2015). This is due to the fact that the necessary payments increase relatively faster (85% for the period of 2010-2015) than the assets itself (70% for the period of 2010-2015)(Centraal Bureau voor de Statistiek, 2015). Reasons for this are the lower interest percentage that in turn lowers the expected return on investment as well as the ageing population (Centraal Bureau voor de Statistiek, 2015). Due to these current concerns, the topic of pensions is popular nowadays.
Several researchers have studied the relationship between pension plans and financial decisions of firms and pension funds. In particular, the influence of pension plans on financial decisions such as asset allocation, capital expenditures, capital structure, and the likelihood of mergers and acquisitions have been examined before. For example, Shivdasani and Stefanescu (2010) examined the influence of pension plans on sponsoring firm’s capital structure choices. The study focuses on corporate DB pension plans sponsored by US companies and found that firms take into account their pension assets and liabilities in deciding about leverage ratios. They found a 0.36 percentage points decrease in the leverage ratio due to a 1 percentage point increase in the pension liability to total assets ratio. Most of these studies are focused on the US and study the influence of DB type of corporate pension plans only. The Netherlands is different from the US since in The Netherlands mandatory supplementary firm contributions do not exist. Furthermore, the Dutch pension system differs in terms of regulations regarding maximum contributions and the non-existence of public pension benefit insurance (Davis and De Haan, 2012).
meet liabilities. In this way, the strategic investment policy takes into account (future) liabilities. This is also confirmed by the fact that many pension funds base its strategic investment policy on the asset liability management (ALM) study.
In the past, pension funds invested with the perspective that investment returns should exceed an arbitrary benchmark return with no eye for the obligations. However, some economic shocks as the “tech” crash in the early 2000’s, the financial crisis of 2008, and the lower interest rates in the current bond environment changed this approach. Pension funds became to feel the pressure and started to appreciate the importance of taking into account the liabilities for their pension asset management. The goal of taking into account the liabilities is to make assets and liabilities develop in the same way. The inclusion of liabilities for a pension fund’s pension asset management changed the investment portfolio structure of pension funds. E.g. increase in fixed-income securities and diversification into new asset classes such as private placements (Iasplus.com, 2016). The influence of the economic situation and its changes on investment decisions of amongst others pension funds make differences in results compared to previous studies plausible. However, there are opponents of the view that pension fund’s investment policies should match assets to liabilities. Alestalo and Puttonen (2006) argue that pension funds should attempt to increase the spread between assets and liabilities in order to add value.
pension assets for a relatively greater part in equities and less in debt securities. Webb (2007) found that firms with high future pension liabilities are incentivized to make riskier investments. As opposed to this, Davis and De Haan (2012) suggest that more mature pension funds (those with a greater proportion of inactive participants or pensioners) are more risky due to the higher immediate obligations and therefore are motivated to make less riskier investments. Davis and De Haan (2012) investigated the influence of characteristics of the sponsoring firm on the funding and portfolio allocation of corporate pension funds for both the DB type of plan as well as for the DC type of plan. This study examined the interaction from the ‘sponsor’ company to the decisions regarding pension funding and asset allocation. Regarding asset allocation, Davis and De Haan (2012) did not find found a relationship between the leverage of the sponsor company and the pension asset allocation decisions. Davis and De Haan (2012) found that defined benefit funds invest relatively more in riskier assets such as equity and less in less riskier assets such as bonds compared to their defined contribution counterparts.
These previous studies thus took into account firm determinants (such as credit rating, rates of return on investment and leverage) and/or pension fund determinants (such as funding status of the fund, future pension liabilities as well as the type of pension plan in the form of a defined benefit or defined contribution pension plan).
This research is special since it attempts to explain pension fund investment policy by pension plan as well as sponsoring firm determinants. Furthermore, another and more recent period of investment policy of pension funds is studied by this research, namely 2013 till 2015. Data will be retrieved from DNB, annual reports of pension funds and reach. In addition, a detailed spectrum of assets and their riskiness is used. It makes sense to explain pension fund investment policy by both pension fund as well as sponsoring firm determinants since the investment policy and resulting risk return profile is based on the preferences of both the beneficiaries and the sponsoring firm (De Dreu and Bikker, 2012). These preferences will not always be the same for both parties and they are also subject to change. Regression analysis will be conducted to study the research question. The research question of this study is:
This study has practical relevance since policy makers and employees might benefit from the provided insights about the determinants of the investment policy of Dutch pension funds. The risks inherent to the pension funds investment policy influences the ability of pension funds to pay the retirement income to employees.
In order to motivate and examine this research, the theoretical lense will comprise of risk management theory, life-cycle theory, moral hazard issues, financial distress costs and governance theory.
The main results are that the Dutch pension landscape of nowadays is way different to the past, which might be an argument for the insignificant relationships. In general, the results do show some positive relationships between the funding ratio and strategic risk exposure. In addition, a negative relationship between the defined benefit dummy and strategic risk exposure has been found in general.
Chapter 2: Institutional setting
There are several reasons why firms offer pension plans to their employees. First, firms can offer pension plans in order to attract and retain valuable employees. Many people view pension plans and the related income at retirement as a valuable job characteristic. This has also been mentioned in many annual reports of Dutch (listed) firms. For example, AkzoNobel stated: “Our remuneration policy has the objective of providing remuneration in a form which will attract, retain and motivate members of the Board of Management as top managers of a major international company, while protecting and promoting the company’s objectives” (AkzoNobel, Annual Report 2015, p.130). Although, the statement is mainly pointing at managers instead of general employees. Second, pension plans can be a useful tool in lowering a firm’s tax burden. This because contributions to pension plans are often tax-deductible (as interest payments on debt are). Furthermore, employee taxes are deferred and this is beneficial since employee income tax rates are usually lower at retirement compared to employment years (Shivdasani and Stefanescu, 2010). So it can both benefit a firm’s employees as the business itself. There are two basic types of pension plans, namely defined benefit (DB) and defined contribution (DC) pension plans. These two basic types have their own specific characteristics and risks from the perspective of both firms and employees.
2.1. Type of pension schemes: defined benefit, defined contribution and hybrid schemes
Regarding DB plans, there is no risk involved from the perspective of the employees. The employer is responsible for any shortfalls and for the employees specific benefits at retirement are guaranteed. Therefore, the employer bears all the risk as they have to make additional contributions in case of a shortfall. DC plans do only specify the amount of contributions that the employer has to make to the employee’s retirement account. In case of a shortfall, the employer has no obligation to make additional contributions in the employee’s account (Bikker and De Dreu, 2007; Shivdasani and Stefanescu, 2010).
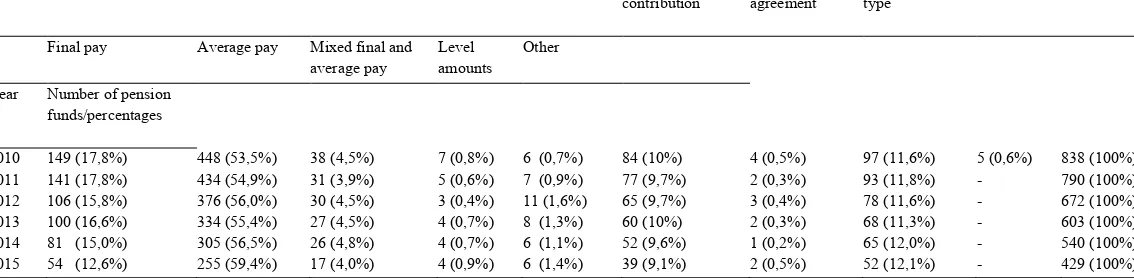
financial debt in the sense that pension contributions are tax-deductible (like interest expenses on debt are) and failure to meet the mandatory pension contributions can lead to bankruptcy (Shivdasani and Stefanescu, 2010). The main types of DB plans are DB final pay and DB average pay plans. 2015, 59,4% of all pension funds were based on DB average pay pension plans ("Pensioenfondsen - De Nederlandsche Bank", 2017). The average pay variant takes the average of the participant’s salary during the entire career. In the end, the pension is dependent upon the total years that the participant has worked for the employer and the course the salary has gone through. The accrued pension is a weighted average of all the pension bases during the working period (TNT, 2015, Annual report). Most DB average pay schemes are conditional defined benefit schemes, which means that the pension rights of the employees as well as those already receiving their pension are revised annually for inflation or increase in wages in the sector. This indexation is conditional on the fund’s financial health (Ponds & van Riel, 2007). Regarding DB final pay plans, the accrued pension rights are increased at each career step to the level of the new pension basis (Dutch Association of Industry-wide Pension Funds (VB) and Dutch Association of Company Pension Funds (OPF), n.d.).
DC plans are pension schemes in which the employee bears the investment risk of the plan and plan assets are independent of the firm's own financial position (Webb, 2007). A DC plan is by definition fully funded and the firm does not have an obligation beyond making its periodic contribution (Bodie et al., 1988). Wealth accumulation depends on the participant’s contributions to the pension scheme, the interest rate at retirement, as well as on investment returns of the accumulation in the account (Bikker and De Dreu, 2007; Bodie et al., 1988; Poterba et al., 2007). For DC plans, the primary risk to an employee is the investment performance of the fund. However, low variance investment strategies can decrease this type of risk. For this type of plan, there is the possibility to select a risk-return strategy that suits the individual employee (Van Rooij et al., 2007).
theory. Under DB plans, market discipline is in fact non-existent since employees have no choice regarding e.g. the risk profile of the pension fund (van Rooij et al., 2007). Other researchers suggest that it is unfavorable for employees to select their desirable portfolio themselves. For example, Thaler and Benartzi (2004) found that if employees have autonomy regarding their pension plan, they save less money than their optimal life cycle savings rate would predict. Regarding portability issues, in practice, DC plans are often favoured compared to DB plans (Bodie et al., 1988). Furthermore, Bikker and De Dreu (2007) found that operating costs of DC plans were lower compared to those of DB plans.
Currently, many listed firms in The Netherlands do apply DC (Defined Contribution) pension plans in addition to DB (Defined Benefit) pension plans. The DB pension plans are often frozen, meaning not available to new employees. In The Netherlands, the shift to DC plans is due to the insufficient funding ratios of many pension funds. This because the transition to DC plans transfers part of the risk associated with the pension plan from the employer to the employees (Bikker and De Dreu, 2007). However, in 2015, DB (defined benefit) pension schemes do still dominate the Dutch market regarding pension funds. About 78,32% of the pension funds in The Netherlands were DB type of plans compared to 9,1% of DC (defined contribution) type of plans. 12,1% belongs to the hybrid form (mixed-scheme type). The number of pension funds in The Netherlands have been decreased for the period of 2010-2015. In 2010, 838 pension funds existed, compared to 429 in 2015, which amounts to a decrease of 48,81%.
In addition to DB and DC type of plans there exist some other variations. Collective defined contribution (CDC) plans concern a hybrid type between DC and DB plans. For CDC plans the sponsoring firm’s liability is limited and participants’ benefits are fixed.
Table 1: Pension scheme types in The Netherlands, source: DNB.
2.2. Company-, and industry-wide pension plans and plans for professionals
Pension funds in The Netherlands can be divided into three different types. First, company-wide pension plans are pension plans for employees of the sponsor company provided by company funds. Although these company funds are separate legal entities, they are run directly by the sponsor company and often the labour union of the employees. Second, industry-wide pension plans are pension plans for employees in a certain industry provided by industry funds. The basis for these plans is the collective labour agreement (CLA) between labour unions that represent the employees in a certain industry and an industry’s companies. These pension funds can be compulsory and non-compulsory, where the compulsory funds are based on a CLA that makes participation for all employers and employees of a certain industry mandatory. Non-compulsory funds are based on a CLA that makes participation a choice for the employers. Third, pension plans for professionals are pension plans for employees of a certain profession provided by a professional group fund. Here, the professional group fund directly deals with workers instead of their employers. Next to these three types of pension funds there are saving funds and insurance companies that also offer pension plan (Bikker and De Dreu, 2007).
In The Netherlands, the majority of pension funds belong to the company-wide type of pension funds, also called corporate pension funds. Both, the employer (also called ‘sponsor’ company) and company’s employees make contributions in the pension scheme. Responsibility for pension fund management is also shared by both the employer and the company’s employees, since they are both represented in the pension fund’s board (Davis and De Haan, 2012).
Defined benefit Defined
contribution
Capital agreement
Mixed-scheme type
Other Total
Final pay Average pay Mixed final and average pay
Level amounts
Other
Year Number of pension funds/percentages
There are some researchers that studied differences between the types of pension funds. For example, Bikker and De Dreu (2007) studied the determinants of operating costs (administrative and investment costs) of pension funds and suggest that industry-wide pension funds are operating significantly more efficient compared to company-wide pension funds and other funds.
2.3. Dutch pension system: three pillars
2.4. Regulatory environment regarding pensions in The Netherlands
In The Netherlands, the government has assigned the task to supervise the pension administrators, to two regulators, namely the AFM (Authority for the Financial Markets) and DNB (Dutch Central Bank).
The task of the AFM is to monitor the behaviour of pension funds, in particular the AFM checks whether the pension funds do provide sufficient information to their members. For example, pension funds are required to inform people in writing when joining the pension scheme. Furthermore, participants must receive an annual pension statement. This requirement to properly disclosure certain information is stipulated in the Pensions Act and is established in order to help people assess their financial situation and to make conscious decisions regarding retirement (Dutch Association of Industry-wide Pension Funds (VB) and Dutch Association of Company Pension Funds (OPF), n.d.).
contributions in case of underfunding, as is the case in the United States (Davis and De Haan, 2012). Next to the task to examine the financial position of the pension funds, DNB is responsible for substantive regulation, such as monitoring that pension funds comply with certain standards. The Dutch Pension Act sets requirements and conditions for pension plans. For example, it is required to integrate the plan into either a recognized pension fund or with a recognized pension insurance company. “In principle, a pension fund must be able to continue functioning for the benefit of all existing participants even if the sponsoring company ceases to exist. In general, the sponsoring firm is not liable to the pension fund when the former goes bankrupt. However, the pension fund’s board may be found liable for mismanagement. Some pension funds reinsure, fully or partly, their pension obligations via a reinsurance company. In that case a premium is paid to the reinsurer who guarantees the payment of pension benefits. In contrast to the US, there is no public pension benefit insurance of any sort in the Netherlands” (Davis and De Haan, 2012, p.11).
The government is also reconsidering the pension system and thereby adjusting or implementing regulations, which influences pension funds and thereby the pension system in The Netherlands. For example, 16th December 2014 the Dutch government voted for the nFTK, an adjustment of the financial assessment framework, that came into force in the beginning of 2015. The most important adjustment were the implementation of the “beleidsdekkingsgraad”, the adjustment of the assessment framework regarding the required equity capital and rules related to the surcharge policy (Towers Watson, 2015, Annual report).
Next to the official regulators as the AFM and DNB is The Pensioenfederatie an organization that preserves the quality of the Dutch pension system. It has been established at the end of 2010 and secures the interests of the Dutch pension funds. The Pensioenfederatie promotes the development, preservation and execution of a reliable pension system with good quality. Risks are indispensable for a good, payable and persistent pension, which makes integrated risk management an important issue for this federation (Pensioenfederatie.nl, 2017).
Chapter 3: Pension fund investment policy
Since the total amount of pension fund’s assets is influenced by the contributions and investment returns were the latter one is the most important, the pension fund’s investment policy is important. Pension funds do make investments in order to be able to satisfy the needs of their beneficiaries. This section explains the investment process of pension fund investment policy as well as the different asset classes pension funds can choose from.
3.1. Pension fund investment process
funds do not continuously rebalance their portfolios’ (Bikker et al., 2012, p. 1-2 and Bikker et al., 2010).
Pension funds do consider several factors when deciding upon their (strategic) investment policy. The pension fund considers the obligation of regular payments by taking into account the asset liability management study. Furthermore, the risk attitude of the pension fund is important. The ultimate goal of pension funds is to be continuously able to pay their liabilities. Therefore, pension funds do invest in different asset classes and take associated risks in order to grow their assets. Pension funds can choose to invest in a variety of asset classes. Different asset classes go along with distinct risk-return characteristics. Different opinions on the suitability of each asset class exist based upon preferences regarding those risk-return characteristics and issues. For example, Alestalo and Puttonen (2006) argue that pension funds should attempt to increase the gap between assets and liabilities in order to add value, which means that pension funds should try to increase assets by investing in high-return asset classes. On the other hand, Bodie (1995) argues that pension funds should focus on aligning assets to liabilities by means of investing in fixed-income securities.
3.2. Pension fund asset classes
Dutch pension fund portfolios often exist out of the following asset classes: equity, fixed-income securities, real estate, private equity, hedge funds and commodities. The following will explain certain issues and characteristics of these asset classes and its impact for pension funds.
Equity
Different opinions regarding the appropriateness of investing in equity or stocks for pension funds exist. Generally, stocks are characterized by high risks and high returns. Therefore, the debate regarding its suitability for pension funds is dependent on the view whether pension funds should try to match liabilities and assets or attempt to add value by increase the gap between assets and liabilities.
time, which makes equity an interesting security for parties that have a long-term investment horizon (Hoevenaars et al., 2008; Spierdijk and Bikker, 2012). Since pension funds do have a long-term investment horizon, equity becomes an attractive asset class. However, Bodie (1995) argues for the opposite. Bodie (1995) measures the risk of the investment by taking the cost of
insuring against earning less than the risk-free rate of return over the investor’s time horizon.
The argument for this is that the commonly used measure of risk, the probability of a shortfall, ignores the magnitude of the shortfall. Bodie (1995) found that in the long run, the cost of insuring against earning less than the risk-free rate of interest increases as the lengths of the investment horizon increases. Based upon this finding, Bodie (1995) contradicts the point of view that people with a long-term investment horizon (e.g. young people) should invest more in stocks.
Fixed-income securities
With fixed-income securities as corporate and government bonds, pension funds have the possibility to match assets with liabilities. This is due to the characteristic that fixed-income securities go along with fixed periodic payments and possibly the return of the principal at maturity. This substantially reduces risk for the pension fund. However, the ability to perfectly match assets to liabilities is mitigated by the possibility of changing wages and inflation rates, which in turn affects the liabilities.
Real estate
Similar to equity, investments in real estate are also characterized by a long-term nature. Again, different opinions regarding the appropriateness of investing in real estate exist. Brounen et al., argue that pension fund investments in real estate are not effective in hedging against interest and inflation risks were pension obligations are subject to. On the other hand, Brounen et al., (2010) concluded that real estate investments are attractive due to risk-reward issues and the possibility of portfolio diversification.
Private equity
go along with investing in private equity. An advantage of private equity is the high returns, which makes the asset attractive (Kaplan and Schoar, 2005; Ljungqvist and Richardson, 2002). A negative characteristic pertains to the volatility of returns. For example, Cochrane (2005) argues that venture capital returns are highly volatile, especially in early stage deals.
Hedge funds
Ackermann et al., (1999) characterizes hedge funds as having a relatively unregulated organizational structure, flexible investment strategies, sophisticated investors, and large managerial incentives. Ackermann et al., (1999) also found that pension funds are associated with high returns (as compared to mutual funds), which are at the same time highly volatile. Malkiel and Saha (2005) examined hedge fund returns and argue that it is relatively easy for hedge funds to report biased returns. When they corrected for the biases, the returns were lower than supposed before. In addition, Malkiel and Saha (2005) suggest hedge funds to have diversification potential for an all-equity portfolio (as hedge funds have low correlations with general equity indices). However, riskiness results from “cross-sectional variation and the range of individual hedge fund returns that are far greater than they are for traditional asset classes” (Malkiel and Saha, 2005, p.87).
Commodities
Chapter 4: Pension fund determinants
There are different pension fund determinants with the potential to influence the investment policy or strategic asset allocation decisions for (Dutch) pension funds. This chapter will outline these different pension fund determinants and the development of the hypotheses.
4.1. Average wealth plan members
Bikker et al., (2012) found a positive relationship between the wealth of individual plan members and the strategic equity allocation or risk exposure of the pension fund. This finding is similar to the behavior of private individuals who are also willing to take higher risks regarding their investments when they are wealthier. Regarding risk management, it is expected that wealthy individuals are better able to manage risks. Thus, in case pension funds do take into account the risk management issues of individuals such as their wealth, a positive relationship between the average wealth of participants and strategic risk exposure will be expected.
H1: There is a positive relationship between the average wealth of plan members and the riskiness of the pension fund investment policy.
4.2. Pension fund’s maturity
between age of participants and risk exposure is expected (Bikker et al., 2012). The reason for this is that “young workers have more human capital than older workers. As long as the correlation between labor income and stock market returns is low, a young worker may better diversify away equity risk with their large holding of human capital” (Bikker et al., 2012, p. 2). The assumption for this relationship between maturity and riskiness of the pension fund investment policy is based upon the assumption that human capital is almost risk free or not correlated with capital return (Bikker et al., 2012). This result has been supported by Alestalo and Puttonen (2006). The second hypothesis is therefore as follows:
H2: There is a negative relationship between pension fund’s maturity and the riskiness of the pension fund investment policy.
4.3. Pension fund’s size
Professionalism often comes with size and thus larger funds are often associated with a higher degree of professionalism. De Dreu and Bikker (2012) argue that size is related to investor sophistication and investor sophistication is related to risk-taking. In addition, size is positively related to economies of scale, which can result in decreasing marginal costs of human capital or expertise. As a consequence, it is more efficient to hire managers with good knowledge of investing in equities or other high-risk assets. Thus, based upon the relationship of professionalism and economies of scale, a positive relationship between size and investment in risky assets is expected. Other researchers also suggested a positive relationship between size and the proportion of equity investments and a negative relationship between size and the proportion of bond investments (Bikker and De Dreu, 2007 and Davis and De Haan, 2012). Therefore, the third hypothesis will be the following:
H3: There is a positive relationship between size and the riskiness of the pension fund investment policy.
4.4. Pension fund’s funding ratio
(2009) also finds that pension funds have less risky pension fund asset allocations when their financial condition is weaker. More specifically, Rauh (2009) found that a lower credit rating of the sponsor company and a corporate pension plan that is less funded results in allocations of pension fund assets to safer assets (debt and cash). Rauh (2009) suggests that this result is based upon the motivation of corporate pension funds to limit financial distress costs.
H4: There is a positive relationship between a pension fund’s funding ratio and the riskiness of the pension fund investment policy.
4.5. Governance and structure board of trustees
The pension fund’s board of trustees has the power to decide upon the fund’s investment decisions (Hess, 2005).
policy. However, there are also arguments that suggest a negative relationship between corporate governance and risk-taking. For example, better investor protection goes along with less fear that managers will pursuit their self-interest. In this situation, monitoring is less beneficial and shareholders become less prevalent across firms, which gives greater discretion to managers to reduce risk-taking. Moreover, Faccio et al., (2016) suggest that female CEO’s are associated with lower leverage, less volatile earnings and a higher chance of survival. Their result shows that female CEO’s thus avoid riskier investment and financing opportunities and that this risk-avoidance behavior of female CEO’s leads to distortion in corporate investment policies. Thus, this study implies that women tend to be more risk-averse than men and consequently do not prefer to take on profitable investment opportunities that are associated with high risk. This study treats CEO gender as a trait that is able to explain corporate choices and ultimately influence corporate outcomes. Moreover, Barber and Odean (2001) found that men trade 45% more compared to women and this might be due to overconfidence and in turn that men are less risk-averse. Huang and Kisgen (2013) found similar results regarding the relative overconfidence of men compared to women in making corporate decisions. Bernasek and Shwiff (2001) also found that women are more conservative investors compared to men. Sundén and Surette (1998) examined whether people differ systematically by gender in the allocation of assets in DC pension plans and found that when controlling for some demographic variables, gender indeed plays a role. Francoeur et al., (2007) found a positive relationship between inclusion of women in the board and stock market returns for firms within a turbulent environment. Extending this line of reasoning to pension funds leads to the expectation that there is a negative relationship between a female CEO and the riskiness of the pension fund investment policy. Thus, women can both have a positive as well as negative relationship with the riskiness of the pension fund investment policy. Based upon these lines of reasoning, the following two hypotheses regarding pension fund’s board of trustees will be examined:
H5: There is a positive relationship between pension fund’s board diversity regarding age and the riskiness of the pension fund investment policy.
Chapter 5: Sponsoring firm determinants
In addition to the potential of pension fund determinants to influence the investment policy or strategic asset allocation decisions for (Dutch) pension funds, characteristics of the sponsoring firm might be relevant as well. This because the sponsoring firm has the obligation to contribute fixed or variable payments to the pension fund. These payments are fixed for DC type of plans and variable for DB type of plans. In addition, halve of the board of trustees of the fund exist out of sponsoring firm employees. Furthermore, although the pension fund is an independent, separate legal entity, the ultimate risk of bankruptcy is for the employer. Lastly, the performance of the corporate pension fund might influence the image of the firm as well. Therefore, the sponsoring firm might have an influence on both strategic as well as actual investment decisions. Due to the relationships between the sponsoring firm and the pension fund it makes sense to investigate sponsoring firm determinants as well.
There are different sponsoring firm determinants with the potential to influence the investment policy or strategic asset allocation decisions for (Dutch) pension funds. This chapter will outline these different sponsoring firm determinants.
5.1. Leverage
Friedman (1982) found that firms with a higher leverage ratio invest pension assets so as to balance the total risk to the firm. Firms with a higher leverage ratio invest a relatively greater part of their pension assets in debt securities compared to investments in equity.
H7: There is a negative relationship between a sponsoring firm’s leverage ratio and the riskiness of the pension fund investment policy.
5.2. Plan type
Based upon the aforementioned differences between DB and DC pension plans, with a DB plan the sponsor company can be motivated to take more risk by the fact that higher returns may lead to lower necessary contributions. For a DC plan this motivations does not exist since the sponsoring firm has to pay fixed contributions independent of the investment return. In addition, pension plan characteristics have the potential to influence the motivation for risk shifting, which can introduce moral hazard problem by inducing risk-taking in the pension fund (Rauh, 2009; Davis and De Haan, 2012). Moral hazard is the risk that a party does not take into account the trade-off between risk and incentives because the party does not incur the losses itself. Davis and De Haan (2012) suggest that moral hazard can exist since the sponsor firm of a defined benefit pension plan owns a put option, which means that if the pension fund fails to meet its liabilities, the existing assets will be transferred to the pension beneficiaries as payments and the fund will be liquidated. In this case, higher value is created by riskier underlying assets. Due to this, the sponsoring firm might have the motivation to increase the risks by investing in securities with higher risks. Thus, combining these two lines of reasoning, a positive relationship between a defined benefit pension plan and the riskiness of pension fund investment policy is expected.
H8: There is a positive relationship between defined benefit pension plans and the riskiness of the pension fund investment policy
Table 2 provides an overview of the hypothesis that this research will study. Were size (hypothesis 3) will function as a control variable.
H# Formulation Theoretical references
1 There is a positive relationship between the average wealth of plan members and the riskiness of the pension fund investment policy.
Risk management
2 There is a negative relationship between pension fund’s maturity and
the riskiness of the pension fund investment policy.
Risk management and life-cycle theory
3 There is a positive relationship between size and the riskiness of the pension fund investment policy.
Risk management, economies of scale and professionalism
4 There is a positive relationship between a pension fund’s funding ratio
and the riskiness of the pension fund investment policy.
Risk management and financial distress costs
diversity regarding age and the riskiness of the pension fund investment policy.
6 There is a positive relationship between pension fund’s board
diversity regarding gender and the riskiness of the pension fund investment policy.
Governance and risk attitude related to gender
7 There is a negative relationship between a sponsoring firm’s leverage
ratio and the riskiness of the pension fund investment policy.
Risk management and financial distress costs
8 There is a positive relationship between defined benefit pension plans
and the riskiness of the pension fund investment policy.
Risk management, risk-shifting and moral hazard
Table 2: Hypotheses formulation and theoretical references
Chapter 6: Research methods 6.1. Regression model
The regression model is similar to the model used by Bikker et al., (2012) and is as follows:
Strategic risk exposure = α + β average wealth plan members + β maturity + β fratio + β
leverage ratio + β type of plan + β size + Board diversity1 + β Board diversity2 + ε
This method can be used to estimate the amount of variance in the dependent variable explained by the independent variables, indicated by the (adjusted) R2. Furthermore, the influence of the independent variables separately on the dependent variable are estimated and indicated by the coefficients. Several assumptions need to be checked before conducting the analysis, e.g. multicollinearity, normality, heteroscedasticity and linearity issues. SPSS will be used to conduct the statistical analysis (Hair et al., 2013; Huizingh, 2007; De Veaux et al., 2014). In order to comply with the assumptions, some variables were re-expressed to make them more normally distributed. Only for the variables ‘maturity’ and ‘sponsoring leverage’ this was not needed.
6.2. Variables and measures
Dependent variables
certain asset class multiplied by the risk (beta) percentage for that specific asset class established by Jin et al., (2006). Jin et al., (2006) assumed certain betas for the various asset classes and used those to compute the total risk for pension funds.
The following asset classes will be considered:
1. The proportion of the investment policy dedicated to equity (Davis and De Haan, 2012). 2. The proportion of the investment policy dedicated to fixed-income securities (incl. bond holdings) (Davis and De Haan, 2012).
3. The proportion of the investment policy dedicated to private equity. 4. The proportion of the investment policy dedicated to hedge funds. 5. The proportion of the investment policy dedicated to commodities. 6. The proportion of the investment policy dedicated to real estate.
Independent variables
The following variables will be used as independent variables:
1. Average wealth of plan members will be measured via the total assets divided by the total number of participants (Bikker et al., 2012).
2. Maturity will be measured by the ratio of active to total minus passive pension plan participants. As a result, a high ratio will indicate a relatively young fund. Active participants are participants that currently build up a pension with the pension fund. Passive participants are participants that have built up their pension rights with the pension fund, but do not do this anymore. An example of a passive participant is someone who has changed his or her job. 3. Funding ratio as measured by the pension fund’s available assets divided by its liabilities (Rauh, 2009; Davis and De Haan, 2012). The funding ratio is given in the fund’s annual report and therefore no calculations were made. From 2015 onwards the nFtk introduced the “beleidsdekkingsgraad,” which is measured by taking the average funding ratio of the whole year. However, for this research the “normal” funding ratio was used to measure the solvency. This in order to reach consistency, since data has to be collected from several years and pension funds did not report the “beleidsdekkingsgraad” retrospectively.
5. DB/DC type of plan will be measured via a defined benefit dummy variable, for which 1 indicates a defined benefit fund and 0 indicates a defined contribution type of pension fund. 6. Board diversity1 will be measured by a dummy variable, for which 1 indicates a diverse age distribution and 0 indicates no diverse age distribution regarding the pension fund’s board of trustees. Here, diverse means 1 or more members of the pension fund’s board of trustees are below 40 years old.
7. Board diversity2 will be measured by a dummy variable, for which 1 indicates a diverse gender distribution and 0 indicates no diverse gender distribution regarding the pension fund’s board of trustees. Here, diverse means 1 or more members of the pension fund’s board of trustees are female.
Control variable
Size will be the control variable and will be measured by the natural logarithm of total assets of the pension fund.
6.3. Data sources and sample criteria
industry-wide pension fund. Combining sponsoring firm characteristics with pension fund decisions for company-wide or corporate pension funds has also been done by other researchers, such as Friedman (1982), Webb (2007), Rauh (2009), Shivdasani and Stefanescu (2010), and Davis and De Haan (2012). After filtering for the corporate pension funds, 156 pension funds remained. However, many (small) pension funds are liquidated nowadays and since information for those pension funds is often lacking, a total data set of 118 remained per year. Those 118 pension funds will be the sample for all the three years as the dataset of DNB has been used as the basis data set and is available for 2014 and 2015. The sample period will pertain to 3 years, namely 2013, 2014 and 2015.
In addition to the DNB data set, data regarding the sponsoring firm (firm characteristics) will be taken from van Dijk’s database REACH.
Furthermore, data regarding asset allocation of Dutch pension funds will be collected manually from the annual reports of the pension funds, which are available online. Missing data from the DNB data set will also be supplemented with data from the annual reports. Furthermore, some data that is available in both the DNB data set as well as in the annual reports will be double-checked. Similar to what Davis and De Haan (2012) did, fund and sponsor data will be connected into one dataset.
Chapter 7: Data
dedicated towards asset classes such as private equity, commodities, hedge funds and cash was very low.
The dependent as well as the independent variables that were based upon data retrieved from the pension funds annual reports do represent end of the year values. For example, IKEA did report in their 2014 annual report their strategic investment portfolio per January 2015 and the actual investment portfolio anno end 2014. The independent variables such as total participants, total assets and funding ratio were also end of the year values. This means a good match between independent and dependent variables. However, some pension funds that only base their strategic investment policy upon an asset liability study that does not take place every year did hold on to their strategic investment policy established during the year of the most recent ALM study. For example, in the 2014 annual report of Heineken the strategic investment policy was still based upon the ALM study of 2011, which the fund takes once every three years (Heineken, 2014, Annual report). In this situation, it is harder to devote the strategic investment policy to the independent variable values of 2014.
Based upon this observation this research has tried to investigate whether it makes sense to establish year-average values for the independent variables. This in order to see whether there is a stronger relationship between the averages of the independent variables and the strategic risk exposure dependent variable. However, this will reduce the sample period with one year and a final sample size of 104 resulted. The results for this method, using year-average values for investigating the relationship between the independent variables and the strategic risk exposure can be seen in the results section.
gender and age of board and committee members. The norms dictate that at least one woman should be included in the board of trustees as well as one member below the age of 40 years. In order to comply with the diversity norms, pension funds do need to include at least one women and one member below the age of 40 years in the board of trustees and in their committees. This research intends to see whether compliance with the diversity norms do influence the strategic investment policy of the pension funds.
However, this implies that the presence of women and/or members below the age of 40 years will by itself influence the investment policy, regardless of their relative share of the total members in the board of trustees. In other words, this method assumes that there is no difference in influence whether the board consists of 10 or 90 percent of women or people below the age of 40 years. Therefore, this research also attempts to see whether the relative proportion of both diversity indicators do influence the willingness to take risk regarding the strategic investment policies of pension funds in The Netherlands. Unfortunately, it appeared that many pension funds did not comply with the diversity standards in 2015, or did do so to a little extent. As a result, it was not suitable to use the variables Board Diversity 1 (age) and Board Diversity 2 (gender) in the regression analyses. What can be concluded regarding governance and diversity issues from the data collection is that pension funds do not apply the norms to any significant extent. Some pension funds did mention their willingness to take into account the norms in the coming years, however, experience and knowledge will be the most important criteria.
to the different participating employers. Often pension funds were unable to do so and had to report as if the plan was a DC type of plan. Due to ambiguity in the classification of a pension plan another method had been implemented. In order to classify the pension plan, it has been checked whether the risks of the investments were for the participant, the fund or for both. For this the relative proportions of investments with risk for participant and investments with risk for the fund have been considered. In case the risk of investments was for both, the plan has been classified as a hybrid plan. In case the risk of investments was for the participant, the plan has been classified as a DC plan. Whenever the risk of investments was for the fund, the plan has been classified as a DB plan.
The dataset has been checked for outliers, which were deleted. For example, outliers regarding assets per participant will be excluded since this probably points towards funds for board members instead of regular employees. In addition, abnormal funding ratios will be excluded from the sample. Table 3 shows the descriptive statistics.
Mean Median Std.
Deviation
Minimum Maximum N
Dependent Variables
Strategic Risk Exposure
0.449 0.441 0.093 0.240 0.800 235
Actual Risk Exposure 0.434 0.437 0.082 0.210 0.740 286
Equity holdings strategic
0.328 0.305 0.113 0.090 0.760 235
Equity holdings actual 0.309 0.310 0.100 0.040 0.680 285
Independent Variables
Average Wealth Per Participant
Average Wealth Per Participant (ln)
175.884
4.958
149.747
5.026
158.275
0.718
0.160
2.720
1497.170
7.310
309
Table 3: Descriptive Statistics
Comparing the descriptive statistics with prior studies shows that the pension landscape is way different nowadays. Some interesting differences were found. First of all, the pension funds in the sample of this research are more mature compared to the samples used in previous studies. For example, Davis and De Haan (2012) had a sample with a mean of 34.2 percent inactive participants, whereas the mean of inactive participants of this study was 57.25 percent. Thus, the pension funds in this study were relatively more mature compared to previous studies. This study also had a smaller standard deviation of 24.6 compared to the study conducted by Davis and De Haan (2012) of 34.2. Secondly, the pension funds in the sample of this research have relatively low funding ratios compared to funding ratios of prior studies. Davis and De Haan (2012) for
Maturity 0.573 0.562 0.246 0.000 1.000 335
Funding Ratio
Funding Ratio (ln)
111.666 4.713 110.000 4.701 8.747 0.077 81.500 4.400 163.000 5.090 307 307 Sponsoring Firm Leverage
0.615 0.629 0.254 0.000 1.000 313
Defined Benefit Dummy
0.648 1.000 0.478 0.000 1.000 332
Board Diversity 1 (age)
0.223 0.000 0.418 0.000 1.000 103
Table 4: Pearson correlation matrix
SRE ARE E (S) E (A) AWPP M FR SFL DB BD 1 BD 2 Size
SRE .508***
(220) .995*** (235) .512*** (219) .069 (206) -.026 (234) .086 (229) .095 (208) -.057 (232) -.042 (79) .010 (79) -.059 (215)
ARE .504***
(220) .985*** (285) -.016 (250) -.011 (283) .048 (276) -.022 (257) -.118** (282) .116 (89) .121 (89) -.058 (260)
E (S) .513***
(219) .063 (206) -.023 (234) .074 (229) .095 (208) -.038 (232) -.038 (79) .004 (79) -.067 (215)
E (A) -.023
(250) .002 (282) .026 (275) -.011 (257) -.124** (281) .068 (89) .136 (89) -.083 (259)
AWPP -.291***
(298) .020 (272) .118** (270) -.16*** (291) .075 (99) .014 (99) .417*** (298)
M .014
(304) .055 (301) .065 (328) .059 (103) -.138 (103) -.273*** (307)
FR .099
(274) .057 (300) -.076 (92) .073 (92) .172*** (280)
SFL .056
(296) -.059 (95) -.010 (95) .109 (286)
DB -.254**
(103)
-.118 (103)
-.223*** (303)
BD 1 .210**
(100)
.078 (102)
BD 2 .271***
(102)
Size
Chapter 8: Results 8.1. Regression results
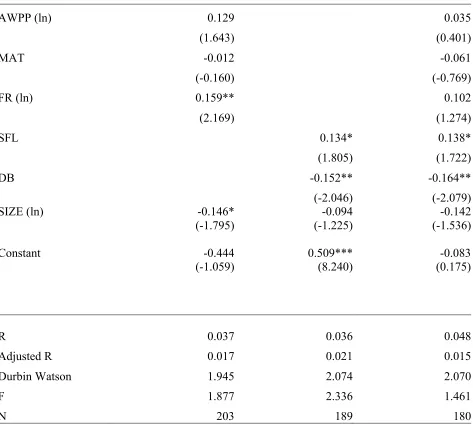
[image:36.612.69.542.234.659.2]In the following table the regression results are shown. Three models have been distinguished, namely: one model regarding pension fund determinants only, one model regarding sponsoring firm determinants only and the full model including all pension fund as well as sponsoring firm determinants.
Table 5: Regression results Dependent variable: Strategic Risk Exposure
AWPP (ln) 0.129
(1.643)
0.035 (0.401)
MAT -0.012
(-0.160)
-0.061 (-0.769)
FR (ln) 0.159**
(2.169)
0.102 (1.274)
SFL 0.134*
(1.805)
0.138* (1.722)
DB -0.152**
(-2.046) -0.164** (-2.079) SIZE (ln) Constant -0.146* (-1.795) -0.444 (-1.059) -0.094 (-1.225) 0.509*** (8.240) -0.142 (-1.536) -0.083 (0.175)
R 0.037 0.036 0.048
Adjusted R 0.017 0.021 0.015
Durbin Watson 1.945 2.074 2.070
F 1.877 2.336 1.461
N 203 189 180
In general, the hypothesis did not show the expected relationships between independent and dependent variables. The following will describe these results and discuss potential underlying reasons.
Average wealth per participant
The hypothesized relationship between average wealth per participant and strategic risk exposure has not been supported by the regression analysis. The sign is positive, as hypothesized. However, the result is insignificant.
Maturity
Based upon the risk management and life cycle theory it was hypothesized that the relationship between maturity and strategic risk exposure would be negative. As a consequence, we would expect a positive sign between maturity and strategic risk exposure, as this would indicate a negative relationship. However, the relationship of maturity and strategic risk exposure is negative and also insignificant. Prior literature did found a significant (negative) relationship between the maturity of the pension fund and the capital allocation structure. However, this research did not find a significant relationship between the maturity of the pension fund and the strategic risk exposure. A reason for the different results might be the aforementioned differences in the sample regarding the maturity of the pension fund. Pension funds in this sample are more mature compared to samples used in other studies. In addition, this study had a smaller standard deviation compared to samples in other studies.
Funding ratio
Partly due to the persistent low interest rate the funding ratio of many pension funds came under pressure. The relatively lower funding ratio’s of pension funds in the sample of this study compared to previous studies might explain the less significant or insignificant results of some models. In addition, the standard deviation of the funding ratio of the sample of this study is way smaller compared to previous studies. This might have influenced the results as this might diminish the effect of funding ratios on asset allocation decisions.
Sponsoring firm leverage
The results for the relationship between sponsoring firm leverage and strategic risk exposure are significant and positive. This is an interesting result since the opposite was hypothesized. It thus appears that sponsoring firms that have a relatively high leverage ratio were more inclined to take risks regarding the pension fund asset allocation decisions. More specifically, the results suggest that a 1 percent increase in sponsoring firm leverage will increase the strategic risk exposure by 13.4 percent holding all other variables constant.
Type of plan
For DB plans, higher returns will lead to lower future contributions that the sponsoring firm needs to make. Therefore, it is in the sponsor interest to take more risk. Based upon this the assumption is that pension funds with DB type of plans in a setting (country) with a pension benefit insurance will have a higher incentive to take risks (based on moral hazard and risk-shifting ideas). However, in The Netherlands this relationship will be less significant since there is no pension benefit insurance. This can be an explanation for the fact that the hypotheses were not confirmed. Also, increasing regulations have disciplined pension funds to invest responsibly. In addition, Davis and De Haan (2012) also argued that pension funds with DB schemes could be motivated to invest less in equity (lowering the strategic risk exposure) due to tax advantages of holding debt securities in the pension fund. Thus the negative relationship between DB pension schemes and strategic risk exposure could be due to stronger regulations and tax incentives.
Size
tend to invest more in bonds. A possible explanation for the different result might be that the sample of this research did contain of relatively larger pension funds with a smaller variation regarding size compared to the size and variation in the other studies.
[image:39.612.66.540.234.663.2]8.2. Regression results using year-average values of the independent variables
Table 6: Regression results using year-average values of the independent variables Dependent variable: Strategic Risk Exposure
Average AWPP (ln) 0.199** (2.039) 0.059 (0.510)
Average MAT -0.007
(-0.073)
-0.105 (-0.965)
Average FR (ln) 0.176*
(1.913)
0.146 (1.374)
Average SFL 0.128
(1.267)
0.141 (1.301
DB -0.058
(-0.573)
-0.049 (-0.464) Average SIZE (ln)
Constant -0.131 (-1.325) -0.786 (-1.259) -0.003 (-0.030) 0.420*** (5.194) -0.083 (-0.682) -0.572 (-0.783)
R 0.067 0.019 0.049
Adjusted R 0.036 -0.010 -0.010
Durbin Watson 1.782 1.824 1.769
F 2.192 0.659 0.833
N 127 107 104
As the results in table 6 show, most of the hypotheses are not significant when using year-average values for the independent variables. A reason for this can be the reduced sample size. However, the hypothesis regarding the average wealth per participant is positively significant in the pension fund determinants model only. This will mean that a 1 percent increase in the average wealth per participant (using year-average values) will increase the strategic risk exposure of pension funds with 19,9 percent. Furthermore, some support has been found for the hypothesis regarding the relationship between funding ratio and strategic risk exposure. Overall, the results using year-average values are not that convincing, probably due to the lower sample size.
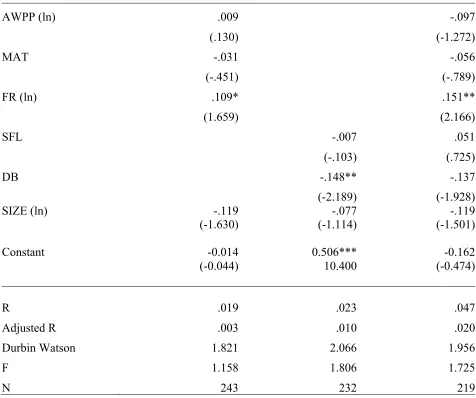
8.3. Robustness checks
Table 7: Regression results Dependent variable: Actual Risk Exposure
AWPP (ln) .009
(.130)
-.097 (-1.272)
MAT -.031
(-.451)
-.056 (-.789)
FR (ln) .109*
(1.659)
.151** (2.166)
SFL -.007
(-.103)
.051 (.725)
DB -.148**
(-2.189)
-.137 (-1.928) SIZE (ln)
Constant
-.119 (-1.630)
-0.014 (-0.044)
-.077 (-1.114)
0.506*** 10.400
-.119 (-1.501)
-0.162 (-0.474)
R .019 .023 .047
Adjusted R .003 .010 .020
Durbin Watson 1.821 2.066 1.956
F 1.158 1.806 1.725
N 243 232 219
Table 8: Regression results Dependent variable: Strategic Equity Holdings
AWPP (ln) .128
(1.622)
.035 (.406)
MAT -.006
(-.074)
-.054 (-.675)
FR (ln) .146**
(1.990)
.085 (1.053)
SFL .137*
(1.841)
.138* (1.724)
DB -.139*
(-1.864)
-.147* (-1.861) SIZE (ln)
Constant
-.150 (-1.841)
-0.658 (-1.293)
-.101 (-1.318)
0.406*** (5.414)
-.140 (-1.505)
-0.193 -0.337
R .034 .034 .042
Adjusted R .014 .019 .009
Durbin Watson 1.966 2.083 2.080
F 1.727 2.196 1.259
N 203 189 180
Table 9: Regression results Dependent variable: Actual Equity Holdings
AWPP (ln) 0.010
(.138)
-.106 (-1.385)
MAT -.034
(-.499)
-.065 (-.910)
FR (ln) .092
(1.400)
.123* (1.774)
SFL .012
(.180)
.075 (1.057)
DB -.159**
(-2.354)
-.150** (-2.115) SIZE (ln)
Constant
-.141* (-1.931)
-0.123 (-0.310)
-.104 (-1.517)
0.417*** (6.973)
-.144* (-1.809)
-0.232 (-0.551)
R .021 .028 .049
Adjusted R .004 .015 .022
Durbin Watson 1.831 2.060 1.958
F 1.261 2.195 1.833
N 243 232 219
Chapter 9: Conclusion
The goal of this research was to examine whether the hypothesized pension fund and sponsoring firm determinants were able to explain the strategic investment policy of Dutch pension funds for the period of 2013 till 2015. Therefore, the research question has been formulated as follows: What are the determinants of the investment policy of Dutch pension funds?
The sample used consists of Dutch corporate pension funds of both the DB as well as DC type of funds. Regression analyses were conducted to analyze the relationships between the dependent and independent variables that were hypothesized. The results have contributed to the existing literature by providing insights in the pension landscape of nowadays. These results might be relevant for stakeholders such as employees, policy makers and investment parties. Overall, some positive relationships between the funding ratio and strategic risk exposure have been found. In addition, a negative relationship between the defined benefit dummy and strategic risk exposure has been found in general. As already explained, the negative relationship between DB pension schemes and strategic risk exposure could be due to stronger regulations and tax incentives. Overall, the regression results did not show very significant relationship as hypothesized. Therefore, there are probably other determinants of pension fund’s strategic investment policies nowadays. As already explained in chapter 8 “Results”, the pension landscape of today is way different from a decade ago. The number of pension funds, its size and structure are all subject to change. This might explain the different findings regarding the hypotheses of this research. In addition, other determinants that pension funds do take into account when deciding upon their strategic investment policy nowadays can be investigated in future research. The following will describe possible reasons.
extensively). In order to investigate this possibility, qualitative research that assesses the knowledge and or experience of the people that make the investment policy is needed.
this way, the macroeconomic situation might also be an influence of pension fund’s investment policy.
Furthermore, the return per asset class of the previous year(s) might influences the strategic investment policy of the pension fund. Past performance might be a factor that influences the willingness to take risk regarding the investment policy.
References
Ackermann, C., McEnally, R., and Ravenscraft, D. (1999). The Performance of Hedge Funds: Risk, Return, and Incentives. Journal of Finance, 54(3), 833-874.
Alestalo, N., and Puttonen, V. (2006). Asset allocation in Finnish pension funds. Journal of Pension Economics and Finance, 5(1), 27.
Barber, B. and Odean, T. (2001). Boys will be Boys: Gender, Overconfidence, and Common Stock Investment. The Quarterly Journal of Economics, 116(1), 261-292.
Bernasek, A. and Shwiff, S. (2001). Gender, Risk, and Retirement. Journal of Economic Issues, 35(2), 345-356.
Bikker, J.A., Broeders, D. W. G. A., De Dreu, J. (2010). Stock Market Performance and Pension Fund Investment Policy: Rebalancing, Free Float, or Market Timing? International Journal of Central Banking, 53-79.
Bikker, J. A., Broeders, D. W. G. A., Hollanders, D. A., and Ponds, E. H. M. (2012). Pension Funds’ Asset Allocation and Participant Age: A Test of the Life- Cycle Model. Journal of Risk and Insurance, 79(3), 595-618.
Bikker, J. and De Dreu, J. (2007). Operating costs of pension funds: the impact of scale, governance, and plan design. Journal Of Pension Economics And Finance, 8(01), 63-89.
Bodie, Z. (1995). On the risk of stocks in the long run. Financial Analysts Journal, CFA Institute, 18-22.
Brinson, G. P., Singer, B. D., and Beebower, G. L. (1991). Determinants of portfolio performance II: An update. Financial Analyst Journal, 40-48.
Brounen, D., Prado, M. P., and Verbeek, M. (2010). Real Estate in an ALM Framework: The Case of Fair Value Accounting. Real Estate Economics, 38(4), 775-804.
Carter, D., Simkins, B., and Simpson, W. (2003). Corporate Governance, Board Diversity, and Firm Value. The Financial Review, 38(1), 33-53.
Centraal Bureau voor de Statistiek. (2015). Totale pensioenaanspraken van Nederland in beeld: AOW vergt meer geld dan aanvullend pensioen. 1-20.
Cochrane, J. (2005). The Risk and Return of Venture Capital. Journal of Financial Economics, 1-39.
Davis, E., and De Haan, L. (2012) Pension fund finance and sponsoring companies. Journal Of Pension Economics And Finance, 11(03), 439-463.
De Dreu, J., and Bikker, J. A. (2012). Investor sophistication and risk taking. Journal of Banking & Finance, 36(7), 2145-2156.
De Veaux, R., Velleman, P., and Block, D. (2014). Stats Data and Models. (3), Pearson Education Limited.
Dnb.nl. (2015). Nieuw Financieel Toetsingskader pensioenfondsen vangt rentedaling geleidelijk op - De Nederlandsche Bank. [online] Available at: https://www.dnb.nl/nieuws/nieuwsoverzicht-en-archief/dnbulletin-2015/dnb320215.jsp [Accessed 5 May 2017].
Faccio, M., Marchica, M., and Mura, R. (2016). CEO gender, corporate risk-taking, and the efficiency of capital allocation. Journal of Corporate Finance, 39, 1-49.
Financial Times, 2017, Aantal pensioenfondsen trotseert aanhoudend lage rente. [online].
Francoeur, C., Labelle, R., and Sinclair-Desgagné, B. (2007). Gender Diversity in Corporate Governance and Top Management. Journal of Business Ethics, 81(1), 83-95.
Friedman, B. (1982). Pension funding, pension asset allocation, and corporate finance. (1), MA: National Bureau of Economic Research, Cambridge, 107-152.
Guercio, D. (1999). The motivation and impact of pension fund activism. Journal of Financial Economics, 52(3), 293-340.
Hair, J., Black, W., Babin, B., and Anderson, R. (2013). Multivariate data analysis. (7), Pearson.
Hess, D. (2005). Protecting and Politicizing Public Pension Fund Assets: Empirical Evidence on the Effects of Governance Structures and Practices, 187-222.
Hoevenaars, R. P. M. M., Molenaar, R. D. J., Schotman, P. C., and Steenkamp, T. B. M. (2008). Strategic asset allocation with liabilities: Beyond stocks and bonds. Journal of Economic
Dynamics and Control, 32(9), 2939-2970.
Huang, J. and Kisgen, D. (2013). Gender and corporate finance: Are male executives overconfident relative to female executives? Journal of Financial Economics, 108(3), 822-839.
Huizingh, E. (2007). Applied statistics with SPSS. London: SAGE, (1),290-318.