University of Warwick institutional repository: http://go.warwick.ac.uk/wrap
This paper is made available online in accordance with publisher policies. Please scroll down to view the document itself. Please refer to the repository record for this item and our policy information available from the repository home page for further information.
To see the final version of this paper please visit the publisher’s website. Access to the published version may require a subscription.
Author(s): I. Atkinsona, I. Teoreanu, O.C. Mocioiu, M.E. Smith, M. Zaharescu
Article Title: Structure property relations in multicomponent oxide systems with additions of TiO2 and ZrO2 for glaze applications Year of publication: 2010
Link to published article:
http://dx.doi.org/10.1016/j.jnoncrysol.2010.04.054
I. Atkinson1,3, I. Teoreanu2, O.C. Mocioiu1, M.E. Smith3 and M. Zaharescu1
1. Institute of Physical Chemistry of the Romanian Academy Bucharest, 202 Splaiul Independentei, 060021 Bucharest Romania
2. University “Politehnica” Bucharest, 1 Polizu Street, District 1, Bucharest, Romania 3. University of Warwick, Physics Department, Coventry, CV4 7AL, UK
Abstract
The influence of the additives (10 weight% rutile, anatase and zirconia) on the atomic scale structure and microstructure of a base glaze (60 wt% feldspar, 15 wt% quartz, 8 wt% kaolin, 12 wt% dolomite and 5 wt% zinc oxide) are investigated. The morphology and structure of the glazes were determined by Scanning Electron Microscopy, X-ray diffraction, infra-red spectroscopy, as well as 27Al and 29Si magic angle spinning (MAS) NMR. Microscopy and X-ray diffraction revealed that the opacity was caused by crystals formed during thermal treatment. Although there are clearly crystalline phases present NMR shows that the heat treated glazes are dominated by the glassy component meaning the opacity is largely conveyed by the added oxide. The relationship between composition, structure and thermal expansion coefficient of the glazes is examined.
1. Introduction
There is significant use of glazes on ceramic products with nowadays a drive to develop glaze compositions that produce an acceptable quality product, but at lower cost. Ceramic glazes are obtained from a variety of raw materials. These include clay minerals, alkaline earth oxides (from carbonate precursors) together with feldspars (which function as source of alkali oxides), alumina and silica [1]. Materials such as ZrO2, TiO2, SnO2
and ZrSiO4, which give opacity to the glaze, can also be present [2-5]. Understanding and
predicting the properties and behavior of glazes, and the effect of additives can be aided by a knowledge of the atomic-scale structure of such materials. Glazes are chemically complex and it is important to have a better understanding of the relationship of compositional parameters, structure and properties in order to satisfy both aesthetical (gloss, transparency or opacity and color) and technical requirements (compatibility with the clay ceramic substrate, with the firing schedule, chemical resistance and good mechanical properties) [6,7]. Many of the glaze properties such as viscosity, thermal expansion coefficient, optical and mechanical are intimately related to the glaze composition since the overall structure results from the contribution and interaction of each component oxide.
Ca, Na, K, etc.). Network formers are four-coordinated and bonded to oxygen (e.g. Si–O bonds). The framework and rigidity of such glasses is provided by oxygens that are bonded to two network formers (e.g. Si–O–Si) which are called bridging oxygens (BO). Network modifier oxides break apart this structure through the formation of non-bridging oxygens (NBO), which are bonded to only one network former leaving network modifiers to balance the remaining valence charge of the NBO [7]. Although by definition, silicate glasses contain no long-range order, varying degrees of order may be present locally. This short- to intermediate-range order has been observed directly by magic angle spinning (MAS) nuclear magnetic resonance (NMR), vibration spectroscopy as well as X-ray diffraction.
Here opaque glazes are studied which are those with sufficiently low light transmittance that they effectively hide the ceramic substrate from view [8]. The factors that control the opacity in glazes include the refractive index difference between the glass and opacifier, the number, size, shape and distribution of the opacifier particles, incident light wavelength and glaze thickness. The high refractive indices for TiO2 (rutile 2.76
and anatase 2.52) and ZrO2 (2.20) compared to that of typical glaze materials (1.50–
1.55) make them a good choice for potentially inducing opacity of glazes. TiO2 addition
to ceramic glazes also improves their acid resistance and decreases their viscosity [9]. Monoclinic zirconia (baddeleyite) might be used in complex ceramic glaze formulations as a nucleating agent, with the aim to promote zircon devitrification, which confers opacity and/or an improvement of mechanical properties [5].
The purpose of the work here is to understand how the effect of additions (10 wt%) of rutile, anatase and zirconia, influence the structure and microstructure of a base oxide glaze. Previous studies [10,11] have shown that higher content of opacity additives leads to better aesthetic glaze properties. Since the opacity of glazes is obtained by crystallization of the glass system, SEM studies were additionally performed in order to evaluate the crystals and microstructure formed during the thermal treatment. This study looks at the crystal formation and local structure of the glazes for different additives. The structural characteristics determined are compared to dilatometry results. This information should provide a basis for improving such glazes for ceramic products.
2. Experimental
2.1. Preparation of glazes
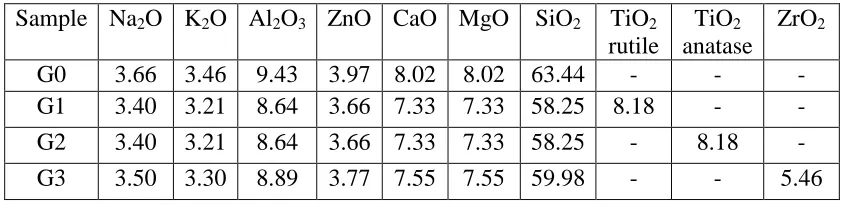
A standard raw ceramic glaze with the base chemical composition (expressed in weight%) 60 wt% feldspar, 15 wt% quartz, 8 wt% kaolin, 12 wt% dolomite and 5 wt% zinc oxide) [10] had in separate samples 10 wt% of three opacifiers TiO2 (rutile and
anatase) and ZrO2 (baddeleyite) added. The overall oxide composition of the individual
Table 1 Oxide composition of the prepared glazes (% molar)
Sample Na2O K2O Al2O3 ZnO CaO MgO SiO2 TiO2
rutile
TiO2
anatase ZrO2
G0 3.66 3.46 9.43 3.97 8.02 8.02 63.44 - - -
G1 3.40 3.21 8.64 3.66 7.33 7.33 58.25 8.18 - -
G2 3.40 3.21 8.64 3.66 7.33 7.33 58.25 - 8.18 -
G3 3.50 3.30 8.89 3.77 7.55 7.55 59.98 - - 5.46
2.2. Methods of characterization
X-ray diffraction studies were performed on the powdered samples using Cu Kα X-ray radiation, = 1.5406 Å, in the 2θ range of 10–90o, on a PANalytical diffractometer.The X-ray tube was operated at 40 kV and 30 mA. The microstructure of the glazes was inspected using a Zeiss SUPRA 55VP Scanning Electron Microscope equipped with energy dispersive analysis of X-ray (EDAX) capability. Infrared transmission spectra were carried out using the same weight of the glaze powder dispersed in KBr pellets. The data were recorded by Nicolet 6700 spectrophotometer 400-1400 cm 1 domain.
The 29Si magic angle spinning (MAS) NMR spectra were recorded using a Varian InfinityPlus spectrometer with a 7.05 Tesla (T) magnet at a Larmor frequency of 59.6 MHz. The powder samples were packed into 7 mm zirconia rotors and spun at 4 kHz. All the spectra were referenced externally referenced to tetramethylsilane at 0 ppm. The data acquisition conditions were a pulse width of 1.5 s (corresponding to a tip angle of ~30o), a pulse delay of 20 s, which produced relaxed spectra, with 800 scans co-added.
27
Al MAS NMR spectra were recorded using a Bruker Advance II+ spectrometer equipped with a 14.1 T magnet (156.37 MHz for 27Al). For the experiment the samples were packed into 3.2 mm zirconia rotors and spun at 18 kHz. Y3Al5O12 (YAG) was used
as reference with the AlO6 resonance set to 0.7 ppm. The data acquisition conditions were
a pulse width of 0.7 s (corresponding to a tip angle of ~15o), a pulse delay of 1 s with 1800 scans co-added.
The thermal expansion coefficient (α) of the glazes was measured in a quartz dilatometer up to 1000 ºC, at a heating rate of 2 ºC/min.
3. Results
3.1. Structural characterization
3.1.1. X-Ray Diffraction
are quartz, plagioclase and with some broad underlying intensity indicating residual glassy phase. The plagioclase series ranges from albite to anorthite (with respective composition NaAlSi3O8 to CaAl2Si2O8), where sodium and calcium can substitute for
each other in this structure. In both glazes with 10% rutile and anatase, rutile was additionally identified in the glaze. In the glaze opacified with baddeleyite, ZrO2 could be
[image:5.612.100.514.175.327.2]identified besides plagioclase, quartz and zircon.
Fig. 1 XRD patterns of the studied glazes
3.1.2 Scanning Electron Microscopy
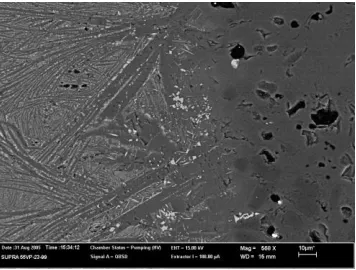
SEM examination of the glaze-ceramic substrate interfaces shows very good ceramic substrate-glaze adherence. Also, crystalline phases at the glaze-ceramic substrate interfaces can be distinguished. SEM corroborated the XRD indication of different phases present, indicating that the opacity of glazes is due to the presence of different crystalline phases. In the figures 2-4 the micrographs of glaze-ceramic substrate interfaces are presented. In fig. 3(b) EDAX analysis of the interfacial layer for G2 with 10% TiO2
anatase is also presented.
[image:5.612.217.395.485.620.2]
a)
b)
Fig. 3 a) SEM micrograph of the glaze-ceramic substrate interface for G2 glaze and b) EDAX result of the interface analysis
The interface for the glazes with 10% TiO2 (rutile and anatase) exhibits acicular
[image:6.612.186.438.66.408.2]crystals of rutile embedded in the glassy phase. EDAX analysis of the glaze-ceramic substrate interface shows a higher Si and Al content and lower quantity of Ti.
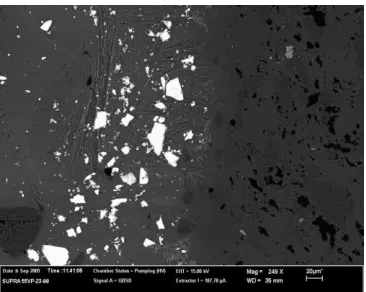
Fig. 4 SEM micrograph of the glaze-ceramic substrate interface for G3 glaze
The interface for G3 glaze shows the presence of ZrO2 (prismatic crystals) and
[image:6.612.248.431.486.632.2]3.1.3. Infra-Red Spectroscopy
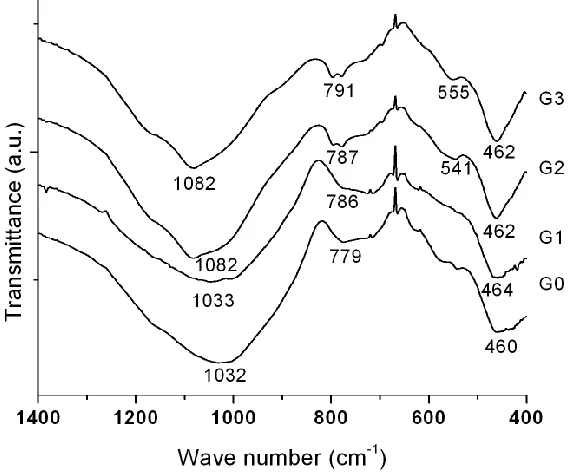
[image:7.612.181.465.217.453.2]In figure 5 IR spectra of the studied glazes are presented which show broad bands due to overlapping effects of vibration and rotation of structural groups which are characteristic of solids in the vitreous state. Various authors have reported infrared spectra of alkali silicate, aluminosilicate, and alkali aluminosilicate glasses and tried to interpret the observed bands in relation to the glass structure. The general agreement is that all these silicate glasses exhibit at least three bands in the 1100 cm 1, 800 cm 1 and 500 cm 1 regions, and insome cases another weak band appears at about 950 cm 1 [12].
Fig. 5 IR spectra of the studied glazes
In all spectra, the broad bands at 1032 cm 1 for G0 and G1 glazes and at 1082 cm 1 for G2 and G3 glazes are assigned to Si-O stretching motion in SiO4 units. The 1100
cm 1 band reported for pure silica shifts to a lower frequency asaluminum is introduced in place of silica. There are no sharp peaks in the present glazes, and all the bands are quite broad. From this observation it may be said that the glazes studied here exhibit a somewhat disordered structure [12]. At around 790 cm 1, the characteristic symmetric Si-O-Si stretching vibrations of SiO4 units are observed [12]. The band at 460 cm 1 is
assigned to asymmetric deformation vibrations (δ) of SiO4 units [13].
In the case of the addition of the opacifiers supplementary vibration bands have been observed. In the case of ZrO2 addition, based on the literature data indicates the 574
and 732cm−1 bands as being characteristic of the monoclinic phase of zirconia [14], the band at 555 cm−1 could be ascribed to this component in these samples [15]. The band of the monoclinic zirconia phase that occurs at 732 cm 1 overlaps the symmetric Si-O-Si stretching vibrations of the SiO4 units.
In the FT-IR spectra, the presence of the TiO2 rutile phase identified by XRD,
G1 to the shoulder that appear in the same region. The peak is assigned to TiO6 units
according to the literature data [16].
3.1.4. 29Si MAS NMR
29
Si MAS NMR spectroscopy provides direct information about the structure of materials from measurements of the isotropic chemical shift. The chemical shift for SiO4
units occur in the range 60 to 120 ppm (with respect to TMS). The chemical shift is influenced most significantly by the coordination number of the Si. 29Si NMR spectra are sensitive to changes in local environment and 29Si resonances can yield isotropic chemical shift characteristic of various Qn structural groups, where Q denotes silicon in four-fold coordination and n = 0 to 4 representing the number of these oxygens bridging to other tetrahedra of the network. The silicate monomer Q0 occurs at the most positive shift, followed in a regular sequence by Q1 to Q4 groups shifted by about 10 ppm to higher field for each Si-O-Si bond [17-19]. The second factor that influences the chemical shift is the number and the type of first cation neighbor. The silicon environment in aluminosilicates can be designated as Qn(mAl), where n denotes the number of BO for each Q unit and m represents the number of attached AlO4 (m n). The
substitution by Al of each of the four silicons surrounding the central Si of a Q4 group results in a change in the chemical shift of about 5 ppm towards less negative values. As a result five distinct chemical shift ranges for Q4(0Al), Q4(lAl), Q4(2Al), Q4(3A1) and Q4(4Al) are observed [17,20].
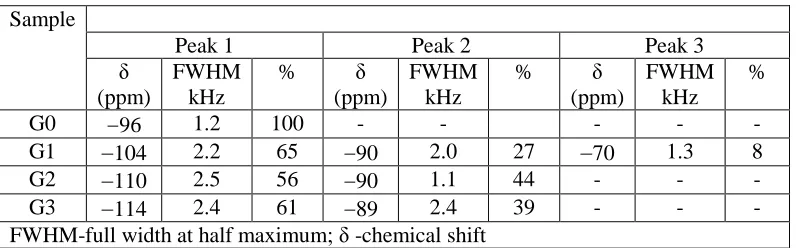
Figure 6 presents 29Si MAS-NMR spectra of the obtained glazes. All the spectra are considerably broader than the base glaze with no opacifier. Very broad lines are observed for highly disordered systems such as amorphous or glassy materials, whereas narrow peaks are obtained for perfectly ordered systems [17]. The key point here is that although XRD shows the presence of crystalline components there are no sharp lines present in the corresponding 29Si MAS NMR spectra. This indicates just how low the content of silicon-containing crystalline phases is in these glazes. The increase in the 29Si peak width of the glasses (glaze) relative to aluminosilicate crystals is probably due to both an increase in the range of aluminium next nearest neighbors of silicon and an increase of the range of bond angles and bond distance for each type of silicon site. Murdoch et al. [21] showed that the 29Si NMR line widths of alkali and alkaline-earth aluminosilicate glasses increase as the cation polarization power (Z/r:charge/radius) increases, at fixed Si/Al ratios.
Fig. 6 29Si MAS NMR spectra of the studied glazes
[image:9.612.155.508.309.642.2]Table 2 Solid state 29Si MAS NMR data
Sample
Peak 1 Peak 2 Peak 3
δ (ppm)
FWHM kHz
% δ (ppm)
FWHM kHz
% δ (ppm)
FWHM kHz
%
G0 96 1.2 100 - - - - -
G1 104 2.2 65 90 2.0 27 70 1.3 8 G2 110 2.5 56 90 1.1 44 - - - G3 114 2.4 61 89 2.4 39 - - - FWHM-full width at half maximum; δ -chemical shift
Standard glaze G0 gives a chemical shift of 96 ppm which could be assigned to Q4(2Al) site [23]. Alkali and alkaline earth aluminosilicate glasses generally show peaks that can be assigned to Q4(2Al) and Q4(3Al) sites [24]. Chemical shifts of 110 ppm and 114 ppm corresponding to Q4(0Al) could be assigned to Si in a vitreous silica-like phase. The chemical shift of 104 ppm correspond to Q4(1Al). The peaks at around 89 to 90 ppm, could be assigned to Q4(3Al) indicating further ordering of the aluminosilicate network [23]. The peak of 70 ppm for G1 glaze can be assigned to Q1.
3.1.5. 27Al MAS NMR
27
Al MAS NMR is used for examining the coordination of aluminum atoms in both polycrystalline and amorphous materials, but a detailed quantitative analysis of the spectra is more difficult to due second-order quadrupole effects [17]. The chemical shift for aluminum is around 50-80 ppm for AlO4, 10-15 ppm for AlO6 and 30-40 ppm for
AlO5, in well crystallized compounds [17]. In aluminosilicates, AlO4 groups are bonded
exclusively to Si tetrahedra (Lowenstein’s rule [25]). In glasses, the three chemical shift ranges characteristic of the Al spectrum are obtained only in the case of rapid cooling, while in the case of slower cooling the glasses usually contain only AlO4 and AlO6.
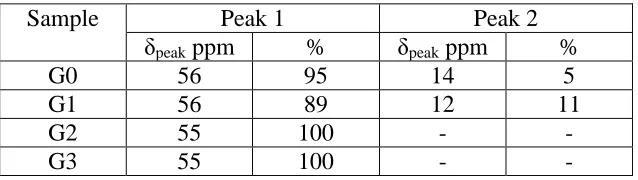
In fig. 8 27Al MAS NMR spectra of the studied glazes are presented. The 27Al spectral data are given in table 3. The FWHM of 27Al peaks are not reported, because this nucleus experiences second-order quadrupolar peak broadening [26]. The precision and accuracy is about ±1 ppm for the chemical shift and ±2% for the intensity.
The spectra of G0 and G1 glazes exhibit two peaks, one at around 55 ppm corresponding to AlO4 and at around 13 ppm corresponding to AlO6. The spectra of G2
and G3 glazes consist of a peak at 55 ppm which is assigned to AlO4 [27]. The broader
low intensity peak around 0 ppm in these samples is a spinning sideband.
Al3+ ions are glass network intermediates such that they can act as both network formers and network modifiers. When Al3+ ions enter as network formers as AlO4 , there
Fig. 8 27Al MAS NMR spectra of the studied glazes
Table 3 Solid state 27Al MAS NMR data
Sample Peak 1 Peak 2
δpeak ppm % δpeak ppm %
G0 56 95 14 5
G1 56 89 12 11
G2 55 100 - -
G3 55 100 - -
3.1.6 Dilatometry results
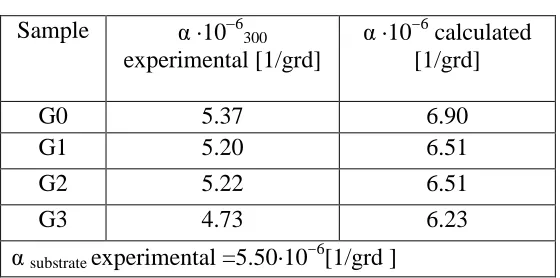
In order to investigate if there is a relationship between thermal expansion coefficient (α) and the chemical composition of glazes, α was determined experimentally and calculated using the additivity law (Appen method) Eq. (1) [28]. This law assumes that each oxide has a different contribution to the final α value. This contribution is described by an oxide characteristic coefficient (αi) and, thus, α can be estimated by Eq.
(1):
7
10 100
1
i
ip (1)
[image:11.612.148.467.355.445.2]Table 4 Dilatometry results
Sample α ·10 6
300
experimental [1/grd]
α ·10 6
calculated [1/grd]
G0 5.37 6.90
G1 5.20 6.51
G2 5.22 6.51
G3 4.73 6.23
α substrate experimental =5.50·10 6[1/grd ]
It can be observed that the calculated values in Table 4 show some deviations from experimental values since the glazes are not homogeneous (i.e. crystallization occurs). The difference between thermal expansion coefficient of the glazes and thermal expansion coefficient of the ceramic substrate should ideally be less than 15% to allow good adherence during thermal cycling. A difference in expansion coefficient between body and glaze of more then 15% creates stress in the cold glaze [8]. The obtained data indicates that the additives decrease the thermal expansion coefficient values of the glazes compared to that free of additives.
4. Discussion
XRD and SEM comparative studies reveal the presence of supplementary phases besides quartz and plagioclase when the additives are used. In the case of glazes with TiO2 (anatase and rutile) the presence of rutile was observed, explained by the
anatase-rutile transformation during the thermal treatment [9]. From a melt the high temperature stable phase always crystallizes, that is rutile here. In the glaze opacified with baddeleyite (ZrO2), ZrO2 could be identified along with plagioclase, quartz and zircon. The presence
of the acicular crystals with low dimensions could be assigned to the crystallization of ZrSiO4 during cooling of the glazes, while the crystals of large size represent ZrO2
particles that have not melted during the glaze preparation.
For glazed ceramic products the adhesion of the cover layer is of high importance. The adhesion characteristics are formed during the thermal treatment when a reaction between the glaze and the ceramic body takes place. The interaction layers can be formed containing crystals which may or may not be thermally compatible with either body or glaze and they would thus affect the overall strength of the system. The glaze-ceramic interactions depend on the chemical composition of the ceramic substrate and glaze, the thickness of the glaze layer, the thermal treatment and the viscosity of the molten glazes [29]. In the thin layer between the ceramic body and the glaze surface no pores are visible. This interaction layer can influence glaze properties, especially thermal expansion coefficient and the occurrence of defects such as pin-holes and cracks.
FT-IR spectra confirm the results obtained by XRD and SEM, and show that the glazes containing additives have supplementary vibration bands characteristic of zirconia and TiO6 units. The shift of the main band maximum from 1100 cm 1 to lower
[30]. In terms of the effect of composition on the glaze properties it is known that ZrO2
improves the wear rate of the glazes and TiO2 decreases the glaze viscosity and improves
acid resistance [9,31,32].
29
Si MAS NMR results show that the glazes have a tetrahedral framework structure with a wide range of local coordinations Q4(0Al), Q4(1Al), Q4(2Al) and Q4(3Al) present producing broad spectral lines. The structure of the most silica-rich aluminosilicate glasses (Si/(Si+Al) = 0.9), as in the case of the studied glazes, are dominated by Q4(0Al) and Q4(1Al) sites [27]. A key observation is despite XRD revealing crystalline plagioclase phases that there are no corresponding 29Si MAS NMR signals. This apparent contradiction is readily explained as XRD strongly favours any crystalline component. 29Si NMR is directly quantitative and shows that the silicate-content of the glaze is effectively all in the glassy phase despite the XRD results. 27Al MAS NMR spectra of G2 and G3 glazes indicate that they have a fully polymerized tetrahedral framework structure. For these glazes, the only 27Al signal detected was for AlO4. For G0 and G1 glazes a signal around 15 ppm indicating the presence of AlO6 was
observed probably indicating that some of the aluminum could be charge balancing some of the AlO4 .
The influence of the composition and structure of the obtained glazes on their properties was evaluated by dilatometry. Dilatometry results show good glaze-ceramics substrate adherence for all the studied glazes. The thermal expansion of glass is not only a function of temperature, but also depends among other factors such as composition, structure of the glass, e.g., degree of polymerization, type of structural units, the nature and contribution of the different cations and whether they occupy forming or modifying positions in the glass network [33,34]. The crystallization process greatly altered the thermal expansion of the glazes. Therefore, the polycrystalline materials may have high or low coefficients of expansion depending on the expansion coefficient and elastic properties of the crystal phases formed and the residual glass matrix [33].
5. Conclusions
Glazes for sanitary ceramics, opacified with 10% TiO2 (rutile and anatase) and
ZrO2, respectively were obtained. The crystallization behavior and microstructural
evolution of the glazes showed the development of rutile and zircon crystals as indicated by XRD, SEM and FT-IR within the glassy matrix. The opacity of these glazes is largely due to the presence of the crystals formed which is dominated by the added oxides. IR indicates that the glazes are in general highly disordered. 29Si MAS NMR data clearly shows that on addition of the opacifiers the glaze becomes much more highly disordered and although XRD shows silicon-containing crystalline phases, the silicon is effectively contained within the glassy phase. This indicates that using the complementarity of XRD and NMR is essential so as not to get a misleading impression of the actual distribution between glassy and crystalline components. Aluminum largely acts as a network former in these glazes, with the majority of the aluminum as AlO4, but in some samples small
amounts of AlO6 form. The dilatometry results demonstrated good adherence of the
Acknowledgements
I. (Gresoiu) Atkinson gratefully acknowledges the financial support from the European Commission for a Marie Curie scholarship “Solid State NMR of Inorganic Materials” to the University of Warwick, UK. MES thanks EPSRC for partial funding of the NMR facilities at Warwick.
References
[1] A.P. S. Mandair and W. R. McWhinnie, Polyhedron, 9 (1990) 1709.
[2] E.Bou, A. Moreno, A. Escadrino, A. Gozalbo, Journal of the European Ceramic Society 27 (2007) 1791.
[3] M. Romero, J. Ma. Rincon, A. Acosta, Journal of the European Ceramic Society 23 (2003) 1629.
[4] N. M. Bobkova, L.V. Boloban, S. A. Gailevich, Glass and Ceramics 54 (1997) 17 [5] S. A. El-Defrawi, M. A. Serry, W. I. Abd El-Fattah and W. Weisweiler, Ceramics International 21 (1995) 69.
[6] M. Llusar, G. Monro´sa, C.M. Rodriguesb, J.A. Labrinchac, Ceramics International 31 (2005) 181.
[7] C. I. Merzbacher, B. L. Sherriff,S. J. Hartman, W. B. White, J. Non-Cryst. Solids 124 (1990) 194.
[8] R. A. Eppler, D. R. Eppler, Glazes and Glass Coatings, The American Ceramic Society, Ohio, 2000
[9] S. Teixeira, A. M. Bernardin, Dyes and Pigments 80 (2009) 292.
[10] V. Burghelea, I. Gresoiu, M. I. Popescu, D. Nicolae, Romanian Journal of Materials 36 (2006) 171
[11] I. Atkinson, I. Teoreanu, M. Zaharescu, Romanian Journal of Materials, 39 (2009), 202.
[12] B. N. Roy, J Am Ceram. Soc,, 73 [4] (1990) 846.
[13] A. N. Moreva, I. A. Levitskii, Glass and Ceramics, 63 (2006) 122. [14] S. K. Saha, P. Pramanik, J. Non-Cryst. Solids 159 (1993) 31
[15] J. Chandradass, K.-S. Han, D. S. Bae, Journal of Materials Processing Technology 206 (2008) 315
[16] M. Crisan, A. Jitianu, M. Zaharescu, F. Mizukami and S. Niwa, Journal of Dispersion Science and technology, 24 (2003) 129
[17] K. J. D. MacKenzie, M. E. Smith. Multinuclear Solid State NMR of Inorganic Materials. Pergamon Press, Oxford, 2002
[18] L. Olivier, X. Yuan, A.N. Cormack, C. Jager, J. Non-Cryst. Solids, 293-295, (2001), 53.
[19] E. Lippmaa, M. Magi, A. Samoson, G. Engelhardt, A.-R. Grimmer. J. Am. Chem. Soc. 102 (1980) 4889.
[20] M. Magi, E. Lippmaa, A. Samoson, G. Engelhardt, A.-R. Grimmer, J. Phys. Chem. 88 (1984) 1518.
[22] D. Massiot, F. Fayon, M. Capron, I. King, S. Le Calvé, B. Alonso, J.-O. Durand, B. Bujoli, Z. Gan, G. Hoatson, Magn. Reson. Chem., 40 (2002) 70.
[23] A. P. S. Mandair, W. R. McWhinnie, Polyhedron, 10 (1991) 55.
[24] G. Engelhardt and D. Michel, High Resolution Solid NMR of Silicates and Zeolites, (Wiley, New York, 1987).
[25] W. Lowenstein, Am. Mineral. 39 (1954) 92.
[26] M. E. Smith, E. R. H. van Eck, Prog. Nucl. Magn. Reson. Spectrosc. 34 (1999) 159. [27] R. Oestrike, W. H. Yeang, R. J. Kirkpatrick, R. L. Hervig, A. Navrotsky, B. Montez, Geochimica Cosmochimica Acta, 51 (1987) 2199.
[28] M. G. Rasteiro, T. Gassman, R. Santos , E. Antunes, Ceramics International 33 (2007) 345.
[29] A. Kara, R. Stevens, J. Eur. Ceram. Soc., 22 (2002) 1095. [30] I. A. Levitskii, Glass and Ceramics, 60, (2003), 111
[31] K.J. Hong, J.M. Kim, H.S. Kim, J. Eur. Ceram. Soc., 23 (2003) 2193. [32] W. Heimsoeth and F.R. Meyer, J. Am. Ceram. Soc. 34(1951) 366.
[33] S.N. Salama, E. A. Saad, H. Darwish, H.A. Abo-Mosallam, Ceramics International 31 (2005) 559.