Lake remediation by top-down and bottom-up management:
An ecosystem-scale experiment in the English Lake District
Amy M. Anderson BSc. (Hons.)
Lancaster Environment Centre
Faculty of Science and Technology
Lancaster University
This thesis is submitted in partial fulfilment of the requirements for the degree of
Doctor of Philosophy
Lake ecosystems face a variety of pressures arising from catchment-based anthropogenic activities and long-term changes in background environmental conditions, which greatly threaten their structure, function and the sustainable provision of essential ecosystem services. The response of lakes to external perturbations is controlled by a complex interaction of top-down (predation) and bottom-up (resource availability) food web processes. A better understanding of how these processes interact is vital if they are to be effectively manipulated in the remediation of degraded lakes. In this study, Esthwaite Water, a eutrophic lake in the English Lake District, was used as the model ecosystem to investigate the relative importance of these two opposing forces in determining water quality changes in response to anthropogenic pressures, specifically eutrophication and climate change.
The research is presented as three studies which address the historical, contemporary and future impact of stressors on the ecological structure and function of Esthwaite Water. Analysis of long-term monitoring data determined that phosphorus availability was the main driver of water quality degradation throughout the study period (1970 to 2014). Despite substantial reductions to the external phosphorus load in later decades, water quality improvements were not observed. Phosphorus release from lake sediments and the effects of climate change on phytoplankton community structure appear to have buffered against the desired impact of reduced external nutrient loads. Analysis of contemporary surface sediments revealed a legacy of phosphorus enrichment from years of high external loading, including from aquaculture cages previously installed on the lake. Much of the sediment phosphorus was determined to be stored in release-sensitive forms.
I declare that the thesis presented here is the result of my own independent work, except where stated otherwise by reference or acknowledgment. It has not previously been submitted for the award of a higher degree at another university or institution.
First and foremost, I wish to thank my supervisors: Prof Stephen Maberly, Dr Steve Thackeray and Dr Bryan Spears (NERC Centre for Ecology & Hydrology), and Prof Jon Grey (Lancaster University) for their guidance, knowledge and support throughout this project. I am especially grateful to Stephen and Steve for their kindness, encouragement and infinite patience.
Completion of this project would not have been possible without the work and support of the Lake Ecosystems Group at the Centre for Ecology & Hydrology (CEH), Lancaster. Over many years, group members past and present have collected environmental data from Esthwaite Water, the use of which was integral to my research. They have also provided me with technical advice, useful discussion and motivation. Deserving of special mention are: Ellie Mackay for providing the maps of Esthwaite Water used in this thesis, Ian Winfield for conducting the fish survey of Esthwaite Water and acting as my advisory panel chair, and Ian Jones for being a constant source of moral support and sweeties. Last but not least, a huge thank you to Alex Elliott for putting-up with me in his office, for his guidance with PROTECH and for many insightful discussions, albeit they were more often concerning Game of Thrones theories than lake ecology!
I was very fortunate to find so many people willing to accompany me on fieldwork to an often wet and windy Lake District: Ben, Janice, Alex, Mike, Ellie, Alanna, Jess, Iestyn, Joey, Mikkel, Angela, Sam, Toby, Rob, Ceri and Kamillo
–
Thank you all! I also owe thanks to Paddy Keenan, Heather Carter and the rest of the CEH Analytical Chemists for instructing me in various analyses and allowing me to use their facilities. Furthermore, I am grateful to Nigel Woodhouse and Dave Coleman of Esthwaite Water Trout Fishery for providing useful data and information about their aquaculture operations and stocking practices.Thank you to my friends and family for their encouragement and for offering the occasional reprieve from PhD life. Finally, it is impossible to express the depth of my gratitude and appreciation for everything that my parents, Margaret and Neil, have done
to support me throughout this process. If it wasn’t for their unwavering belief in me, I
certainly would not have managed this.
Abstract . . . i
Declaration . . . ii
Acknowledgements . . . iii
List of Figures . . . v
List of Tables . . . viii
Notation . . . ix
Chapter One General Introduction . . . 1
Chapter Two Study Site: Esthwaite Water . . . 11
Chapter Three Long-term changes in phytoplankton indicators of lake water quality in response to multiple anthropogenic stressors . . . 22
Chapter Four Impact of salmonid cage aquaculture on phosphorus content and fractionation in lake sediments: A case study in Esthwaite Water, UK . . . 57
Chapter Five Modelling the response of phytoplankton communities in Esthwaite Water (UK) to changes in nutrient load, grazing pressure and air temperature . . . 91
Chapter Six General Discussion . . . 137
Bibliography . . . 159
Figure 1.1 Schematic representation of bottom-up and top-down forced trophic cascades . . . 6
Figure 2.1 Location of Esthwaite Water and its catchment area in the UK . . . 13 Figure 2.2 Average monthly weather patterns for the period 1965 to 2014
at Laurel Bank, Ambleside . . . 15 Figure 2.3 Annual winter SRP concentration, Esthwaite Water, 1946 to 2014 18
Figure 3.1 Mean annual phosphorus loads to and from Esthwaite Water, 1970 and 2014 . . . 37 Figure 3.2 Mean monthly external phosphorus load, sediment phosphorus
flux and water column chlorophyll a concentration, 2013 to 2014 . . . 38 Figure 3.3 Time series plots of annual mean values of water quality indicator
variables, 1970 to 2014 . . . 40 Figure 3.4 Time series plots of annual growing season mean values of water
quality indicator variables, 1970 to 2014 . . . 41 Figure 3.5 Time series plots of annual mean values of potential water quality
driving variables, 1970 to 2014 . . . 42 Figure 3.6 Time series plots of annual growing season mean values of
potential water quality driving variables, 1970 to 2014 . . . 43 Figure 3.7 Statistically significant relationships between water quality
response and driving variables at the annual scale . . . 44 Figure 3.8 Statistically significant relationships between water quality
response and driving variables during the growing season . . . 47 Figure 3.9 (a) Annual external phosphorus load, annual net sediment
phosphorus flux and ΔChl. (b) The correlative relationship
between ΔChl and sediment phosphorus flux . . . 48
Figure 4.1 Pathways of phosphorus transfer across the sediment-water interface under oxic and anoxic conditions . . . 60 Figure 4.2 Bathymetric map of Esthwaite Water showing sampling locations
. . . 64 Figure 4.3 Monthly water column depth profiles of physico-chemical
variables for Esthwaite Water, 2014 . . . 70 Figure 4.4 Monthly mean dissolved oxygen saturation depth profile for
Esthwaite Water, 2014 . . . 71 Figure 4.5 Monthly volume-weighted mean total phosphorus concentration
Figure 4.6 Mean AEP concentration of sediments from the northern control basin and central impact basin, before and after aquaculture cage removal . . . 74 Figure 4.7 Monthly mean surface sediment TP concentration . . . 75 Figure 4.8 Variation with water depth of the (a) TP and (b) AEP
concentration of surface sediments sampled from Esthwaite Water, 2014 . . . 77 Figure 4.9 Mean concentrations of phosphorus fractions sequentially
extracted from sediments of the northern control basin and the central impact basin . . . 79 Figure 4.10 Box and whisker plots of the difference between sediment
phosphorus concentrations determined by single-step extraction and by sequential extraction of fractions . . . 80
Figure 5.1 Mass of phosphorus exchanged between the water column and lake sediment for 12 approximately month-long periods, 2014 . . 101 Figure 5.2 Trajectories of PROTECH input data used for the 30-year
simulations of phytoplankton community . . . 105 Figure 5.3 Comparison between observed and PROTECH simulated
environmental data for Esthwaite Water, 2014 . . . 107 Figure 5.4 Annual mean chlorophyll a and percentage cyanobacteria
abundance, derived from 81 different scenarios of nutrient load and grazing rate . . . 109 Figure 5.5 Spring mean chlorophyll a and percentage cyanobacteria
abundance, derived from 81 different scenarios of nutrient load and grazing rate . . . 110 Figure 5.6 Summer mean chlorophyll a and percentage cyanobacteria
abundance, derived from 81 different scenarios of nutrient load and grazing rate . . . 112 Figure 5.7 Autumn mean chlorophyll a and percentage cyanobacteria
abundance, derived from 81 different scenarios of nutrient load and grazing rate . . . 114 Figure 5.8 Winter mean chlorophyll a and percentage cyanobacteria
abundance, derived from 81 different scenarios of nutrient load and grazing rate . . . 115 Figure 5.9 Box plots of mean chlorophyll a concentrations derived from
PROTECH simulations of phytoplankton community at four different annual mean air temperatures . . . 118 Figure 5.10 Simulated time series of annual mean modelled chlorophyll a
concentration . . . 119 Figure 5.11 Simulated time series of cyanobacteria chlorophyll a
concentration . . . 121 Figure 5.12 Simulated time series of annual mean non-cyanobacteria
Figure 5.13 Simulated time series of the annual mean percentage of total phytoplankton biomass accounted for by cyanobacteria . . . 123 Figure 5.14 Simulated time series of the number of days per year that the
WHO cyanobacteria concentration threshold is exceeded . . . 124
Figure 6.1 Sensitivity analysis of PROTECH simulated phytoplankton chlorophyll a to individual phosphorus loads . . . 149
Figure A.1 Annual and monthly mean catchment phosphorus loads, 1970 to 2014 . . . 188 Figure A.2 Annual and monthly mean WwTW phosphorus loads, 1970 to
2014 . . . 191 Figure A.3 Annual and monthly mean fish farm phosphorus loads, 1970 to
2014 . . . 193 Figure A.4 Annual and monthly mean rainfall phosphorus loads, 1970 to
2014 . . . 195 Figure A.5 Annual and monthly mean outflow phosphorus loads, 1970 to
List of Tables
Table 2.1 Timeline of lake remediation efforts and other significant anthropogenic activities in Esthwaite Water and its catchment area since 1946 . . . 21
Table 3.1 Timeline of significant anthropogenic changes and lake remediation efforts in Esthwaite Water and the surrounding catchment area since 1970 . . . 30 Table 3.2 Results of the global linear mixed-effects models used to investigate
the effect of potential driving variables on water quality at the annual scale . . . 45 Table 3.3 Results of the global linear mixed-effects models used to investigate
the effect of potential driving variables on water quality during the main growing season . . . 46
Table 4.1 Sediment phosphorus extraction procedures . . . 65 Table 4.2 Summary of Wilcoxon-Mann-Whitney tests to compare the
historical (1986 to 2001) and contemporary (2014) AEP concentrations of surface sediment . . . 73 Table 4.3 Results of the two-way ANOVAs to compare AEP concentrations of
sediments from the central impact basin and northern control basin before (1986, 1992 or 2001) and after (2014) the removal of the aquaculture cages, using a BACI design . . . 73 Table 4.4 Results of the best-fit general linear models used to investigate
spatial variation in sediment phosphorus concentration . . . 76 Table 4.5 Summary of Pearson product-moment correlations between
sediment AEP concentration, water column TP concentration, meteorological variables and water column physico-chemical variables . . . 82 Table 4.6 Summary of the Pearson product-moment correlations between
meteorological and physico-chemical variables . . . 83
Table 5.1 The morphological and phylogenetic characteristics of the eight simulated phytoplankton . . . 102 Table 5.2 Summary of PROTECH instructions governing the vertical
movement of the eight modelled phytoplankton . . . 102 Table 5.3 Results of the general linear models used to investigate the effect of
Notation
A Area
AEP Alkali-extractable phosphorus AIC Akaike information criteria
AICc Second-order Akaike information criteria ANOVA Analysis of variance
BACI Before-after-control-impact
BB Black Beck
CEH Centre for Ecology & Hydrology Chl Chlorophyll a
D Phytoplankton loss rate due to dilution
Dep Depth
d.f. Degrees of freedom
DO Dissolved oxygen
DW Dry weight
ELA Experimental Lakes Area
Est. Estimate
F F-statistic
FBA Freshwater Biological Association
FF Fish food
G Phytoplankton loss rate due to grazing GAM Generalized additive model
GLM Generalized linear model
GM Geometric mean
GPS Global Positioning System
IPCC Intergovernmental Panel on Climate Change K Conversion factor (per second to per month) Kd Eddy diffusivity
LMM Linear mixed-effects model LOD Limit of detection
Mean Sq. Mean of squares
MTP Mass of total phosphorus
n Sample size
p p value
PEG Phytoplankton Ecology Group
PROTECH Phytoplankton Responses to Environmental Change model
Q Discharge
r Pearson product-moment correlation coefficient r' Phytoplankton growth rate
RWB Rossby wave breaking
S Phytoplankton loss rate due to settling SD Standard deviation
SRP Soluble reactive phosphorus St. Err. Standard error
Sum Sq. Sum of squares
t t-value
T Time
TP Total phosphorus
UK United Kingdom
V Volume
WFD Water Framework Directive WHO World Health Organisation
WW Wet weight
WwTW Wastewater treatment works
Chapter One
1.1
Overview
Although they only contain 0.3 % of all the world’s water (Shiklomanov & Rodda 2003), freshwater ecosystems are disproportionality important for humanity and key contributors to global biodiversity. Approximately 77 % of the liquid surface freshwater on Earth is contained in natural and artificial lakes (Shiklomanov 1993). Lakes cover more than 4.2 million km2 worldwide, and in the United Kingdom (UK) there are more than
43,000 lakes and ponds with a surface area greater than one hectare (Hughes et al. 2004). As a habitat for a wide range of plant and animal species, lakes are a valuable source of biodiversity at a local, regional and national scale (Dudgeon et al. 2006; Moss et al. 2009). Freshwater lakes also provide numerous essential provisioning, regulating, supporting and cultural ecosystem services upon which humankind depends. Direct contributions of lake ecosystems to human well-being and way of life include, but are by no means limited to: water for domestic and industrial purposes, irrigation, fisheries, transport of commercial goods, flood regulation, energy generation, recreation and tourism (Maltby & Ormerod 2011; Millennium Ecosystem Assessment 2005; Wilson & Carpenter 1999). Indirectly, lakes support our survival by regulating the biogeochemical cycle of carbon, and consequently global climate change (Cole et al. 2007; Maberly et al. 2013; Tranvik et al. 2009). An assessment by Costanza et al. (2014) estimated the combined economic value of ecosystem services provided by lakes and rivers at US$ 2.5 trillion per year globally.
usually act independently, but rather interact to produce combined impacts on biodiversity and ecosystem functioning (Craig et al. 2017; Moss et al. 2011; Vinebrooke, Rolf et al. 2004).
Eutrophication is the enrichment of waterbodies with nutrients and its effects. Nutrients are essential for the growth and reproduction of aquatic plants, but when a waterbody becomes enriched with nutrients it typically leads to an increase in biological productivity and a decrease in biodiversity (Smith et al. 1999; Wetzel 2001). Although the process of eutrophication is naturally occurring, the urban, industrial and agricultural use and subsequent disposal of plant nutrients since the Industrial Revolution have accelerated and amplified the process in many lakes (Harper 1992). Consequently, eutrophication has been the paramount stressor on lake ecosystems since the mid-twentieth century (Maltby & Ormerod 2011; Moss et al. 2011; Smith 1998, 2003).
The Redfield ratio suggests that phytoplankton require carbon, nitrogen and phosphorus in a ratio of 106:16:1 for optimal growth (Redfield 1958). Where concentrations of these nutrients are below the levels required by primary producers, they place a limit on the rate of growth and reproduction (Hecky & Kilham 1988). As concentrations of phosphorus are often relatively low compared to those of other essential nutrients in lakes, it is widely considered to be the main limiting factor (Marsden 1989; Schindler et al. 2016). This assumption is validated by the meta-scale relationship between concentrations of phosphorus and chlorophyll a, a proxy for phytoplankton biomass (Vollenweider 1968). The elevated input of a limiting nutrient disrupts the natural stoichiometry of the lake and results in changes to the primary producer community.
microbial mineralisation at the sediment surface, thereby increasing the probability of hypolimnetic anoxia and the release of sediment-bound phosphorus to the overlying water column (Phillips et al. 1994; Ripl 1986). Conditions of hypoxia or anoxia may be further exacerbated by the night-time respiration of algal blooms (Paerl et al. 2001). Consequently, populations of species less tolerant of reduced oxygen levels (e.g. salmonids) decline. In extreme cases, the combination of hypolimnetic hypoxia or anoxia and toxic algae has been reported to cause fish kills (Muller & Stadelmann 2004).
Dealing with the consequences of nutrient enrichment can be costly. For example, Pretty
et al. (2003) estimated that responding to eutrophication problems in England and Wales
costs US$ 105 to 160 million per year. This estimate accounts for the reduced value of waterfront dwellings, increased drinking water treatment costs for the removal of cyanotoxins and decomposition products, reduced recreational and amenity value of waterbodies and economic losses from the tourist industry, among others.
Recognition of the threat that eutrophication and other stressors pose to the sustainable use and development of vital ecosystem services has led to the introduction of legislative programmes in some regions to improve water quality and prevent further degradation. In states of the European Union, the Water Framework Directive (EU WFD) was implemented in the year 2000. It stipulates that unmodified, natural waterbodies should be returned to Good Ecological Status by the years 2015 to 2027 (European Union 2000). According to the EU WFD, this target is characterised by “low levels of distortion resulting from human activity but deviates only slightly from those normally associated with the surface waterbody type under undisturbed conditions”. Pre-1850 conditions are commonly used as targets, as this was prior to the onset of the Industrial Revolution and rapid population growth (Bennion et al. 2011). The Directive identifies a number of approaches that can be used to determine reference conditions for lakes, including historical data, expert judgement, mathematical modelling and palaeolimnology (Wallin
et al. 2005). In the years since the EU WFD was implemented, determining the most
effective strategies for the management and remediation of eutrophic lakes has become a major focus of limnological research (Mackay et al. 2014a; Søndergaard et al. 2007, 2008; Zamparas & Zacharias 2014).
2011; Maberly & Elliott 2012; Moss 2012). Trophic interactions can either be classified as bottom-up or top-down (Hansson 1992; Power 1992). Bottom-up forces relate to the effects of resource availability upon ecosystems and constituent food webs, the most significant of which in many lakes is the link between phosphorus loading and phytoplankton biomass (Schindler 1974; Vollenweider 1968). On the other hand, top-down processes involve the regulation of biomass, community structure or productivity at a certain trophic level by predation or grazing from the level above; known as a trophic cascade (Carpenter et al. 1985; Jeppesen et al. 1997). Whether top-down or bottom-up forces have primacy in lake ecosystems has previously been the subject of much debate. It is now widely accepted that these two opposing forces make a concomitant contribution to shaping lake ecosystems, but that their relative importance varies depending on environmental conditions (Benndorf et al. 2002; Leibold et al. 1997; McQueen et al. 1989; Pace et al. 1999).
Lake managers apply the concepts of top-down and bottom-up control to the remediation of eutrophic lakes. Most remediation projects have focussed on reducing eutrophication by controlling external nutrient loads. Bottom-up regulation occurs when a change in nutrient supply leads to similar changes in equilibrium biomass at all trophic levels (Figure 1.1), at least until biomass is constrained by other factors (Kagata & Ohgushi 2006). As phosphorus is often assumed to be the main nutrient limiting phytoplankton growth, it is the focus of most eutrophic lake restoration programmes, rather than other essential growth nutrients like nitrogen or silica (Marsden 1989; Schindler et al. 2016). Typically, bottom-up management involves improving the efficiency of phosphorus stripping by wastewater treatment facilities (Hall et al. 1993; May et al. 2012; Søndergaard et al. 2007). However, a reduction in the external phosphorus load does not necessarily translate to an immediate decrease in lake water phosphorus concentration and improved ecological condition. Many case studies have highlighted a lag time of years, and in some instances decades, before water quality improvements are observed
(Bailey-Watts & Kirika 1999; D’Arcy et al. 2006; Jeppesen et al. 1991; Marsden 1989; Søndergaard
Figure 1.1: Schematic representation of bottom-up and top-down forced trophic cascades, showing the conceptual patterns of correlation and attenuation between adjacent trophic levels. Adapted from Heath et al. (2014).
The delayed recovery may be a chemical resistance conditioned by the release of phosphorus from a pool accumulated in the sediment during the period of high external loading. Depending on the loading history and release mechanisms, this phase typically persists for 10 to 15 years after the external loading reduction until new equilibrium conditions are established between the water column and lake sediments (Marsden 1989; Phillips et al. 1994; Sas 1989; Søndergaard et al. 2001). Secondary in-lake remediation measures (e.g. phosphorus-capping agents) are increasingly being applied following external load reductions to minimise the internal phosphorus load and accelerate the recovery trajectories of eutrophic lakes (Huser et al. 2016; Meis et al. 2013).
[image:17.595.118.510.71.431.2]dominated by large stocks of zooplanktivorous and benthivorous fish species, which can impede the top-down control of zooplankton on phytoplankton (Meijer et al. 1999; Persson et al. 1988; Shapiro & Wright 1984). This biological resistance has been overcome by biomanipulation (Beklioglu et al. 2003; Shapiro & Wright 1984; Søndergaard et al. 2008). A common approach involves the removal of zooplanktivorous fish, either by capture or by the introduction of piscivorous fish to reduce the abundance of zooplanktivores by predation (Jeppesen et al. 2012; Søndergaard et al. 2007). An efficient reduction in their biomass generally achieves dramatic, short-term cascading effects in eutrophic lakes, though the effect is often progressively attenuated with transfer between successive trophic levels (as shown in Figure 1.1). The desired cascading effect is for a shift towards dominance by large zooplankton, reduced phytoplankton biomass caused by intensified grazing pressure, and improved water transparency as phytoplankton biomass decreases (Carpenter & Kitchell 1993). However, the long-term effects of biomanipulation have been variable. Observations from a number of lakes suggest that the success of long-term water quality improvements following biomanipulation is greatly improved if substantial reductions in external phosphorus load are made simultaneously (Benndorf 1990; Jeppesen et al. 1999; Søndergaard et al. 1990, 2008).
Over the last few decades, global climate change has been recognised as a potential threat to water quality and lake functioning (Dossena et al. 2012; George 2010; Jeppesen et al. 2010; Shurin et al. 2012). Increasing water temperatures and associated changes to thermal structure, for example stronger and longer-lasting thermal stratification, are already apparent in many lakes (De Stasio et al. 1996; Wagner & Adrian 2011). This may lead to a change in plankton phenology and a mismatch in seasonal timing between trophic levels (Adrian et al. 2006; Winder & Schindler 2004a). The changes in lake thermal structure are also likely to favour toxin producing cyanobacteria over other phytoplankton groups, thus contributing to water quality deterioration (Carey et al. 2012; Paerl & Huisman 2008). In lakes already impacted by high nutrient inputs, global warming and eutrophication tend mutually to reinforce the symptoms they express (Kosten et al. 2011, 2012; Moss et al. 2011). These changes could disrupt established interactions between top-down and bottom-up processes, confounding the management and recovery of eutrophic lakes.
function are complex. A better understanding of these processes and of how they can be effectively manipulated to remediate eutrophic lakes is vital if legislative targets are to be met and ecosystem services secured into the future. This thesis examines the relative importance of top-down and bottom-up processes in regulating lake ecosystems, with a particular focus on phytoplankton communities. Additionally, perturbations to the balance of these processes due to eutrophication and climate change are investigated. The findings are applied to determining suitable remediation strategies for eutrophic lakes in poor ecological condition.
1.2
Objectives and thesis structure
The role of top-down and bottom-up processes, and their interactions, is critical in regulating lake ecosystem structure and water quality. The impact of human activities on environmental processes at local, regional and global scales has the potential to disrupt the natural balance of these processes. In particular, there is a significant gap in our knowledge regarding the combined effects of nutrient enrichment and climate change on lake structure and function, and the consequences of these effects for the long-term management of lakes and associated ecosystem services.
The overarching objectives of this thesis were: (1) to investigate the role of top-down and bottom-up processes, and their interactions, in regulating lake ecosystem structure and function; and (2) to determine how the relative importance of these two opposing processes varies in response to anthropogenic perturbations, specifically eutrophication and climate change. It was hypothesised that eutrophication and climate change will both shift the balance of control towards bottom-up processes, and that the recovery of Esthwaite Water following remediation measures will be delayed by a combination of internal phosphorus loading and the exacerbation of eutrophic conditions due to climate change impacts.
To achieve the main objectives, several more specific aims were investigated. They were as follows:
(i) To quantify historical lake phosphorus budgets, including the flux of phosphorus across the sediment-water interface (internal phosphorus load).
(ii) To determine the historical drivers of water quality variability.
(iii) To quantify the current inventory of phosphorus in lake sediments and determine the proportion of release sensitive phosphorus.
(iv) To determine the impact of aquaculture on the content and fractionation of sediment phosphorus.
(v) To determine how the relative importance of top-down (grazing) and bottom-up (nutrient availability) forces varies seasonally, and the potential for climate change to affect the balance of these processes.
Chapter Two introduces the study site, Esthwaite Water, and provides context for the work reported in the following data chapters. Chapter Three addresses objectives (i) and (ii). Annual lake phosphorus budgets were compiled from long-term monitoring data and data from previous short-term studies for each year between 1970 and 2014. Long-term water quality monitoring data, meteorological data and fish stocking data were analysed to determine the historical drivers of water quality change. Chapter Four reports on the analyses of contemporary lake sediments to determine the spatial variability of phosphorus content and fractionation in relation to the former location of salmonid culture cages [objectives (iii) and (iv)]. The lake model PROTECH was utilised in Chapter Five to address objectives (v) and (vi). Year-long simulations of lake phytoplankton community were conducted under different scenarios of nutrient loading, zooplankton grazing pressure and climate warming to assess the individual and combined effects of these determinants. Long-term simulations were also run to investigate the impact of climate change and internal loading on the recovery of eutrophic lakes. Chapter Six
Chapter Two
2.1
Basic features
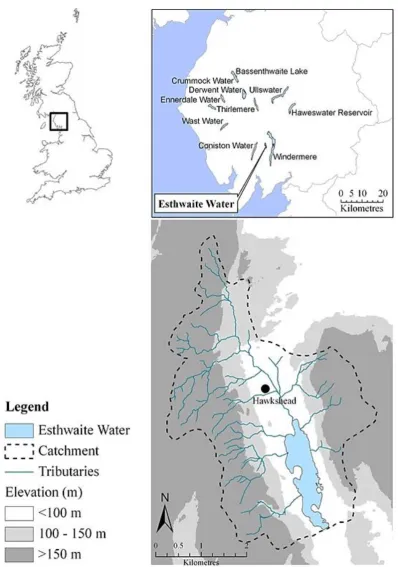
Esthwaite Water (5421’ N, 259’ W) is a small lake of glacial origin in the south-eastern area of the English Lake District, Cumbria, UK. It has a small drainage area of 17.1 km2
which forms part of the larger Windermere catchment (Figure 2.1). Esthwaite Water covers an area of 0.96 km2 and has a total volume of 6.7x10⁶ m3 (Mackay et al. 2012).
According to EU Water Framework Directive (WFD) typology it is categorised as a shallow lake, based on its mean depth of 6.9 m (European Union 2000). The lake is separated by sills into three main basins, of which the northernmost basin is the largest (0.54 km2) and
deepest (maximum depth 16 m). Black Beck, entering at the northern shallow bay, is the main inflow accounting for c. 55 % of the hydraulic load to the lake (Maberly et al. 2011). Five smaller tributaries also discharge into the lake. The sole outflow, Cunsey Beck, exits to the south and discharges after 3.2 km into the south basin of Windermere. The average discharge of 0.93 m3 s-1 recorded between 1976 and 2014 gives a mean retention time of c. 83 days. The lake is designated as a Site of Special Scientific Interest by Natural England on account of its diverse macrophyte community and was also designated as a Ramsar site in 1997 in recognition of its international importance as a wetland.
2.2
Catchment geology and land cover
Esthwaite Water and its catchment lie almost entirely on Lower Palaeozoic, Silurian rock (formed 450 to 400 million years ago), known as the Bannisdale Slates (Fryer 1991). The calcareous nature of the clayey siltstone and mudstone from which these slates are comprised accounts for the high alkalinity of Esthwaite Water compared to other lakes in the region (Reynolds & Irish 2000; Sutcliffe 2010; Sutcliffe & Carrick 1983). The EU WFD categorises Esthwaite Water as a medium alkalinity lake. Of the 20 Cumbrian lakes included in the most recent Lakes Tour (refer to Section 2.4 for details), Esthwaite Water had the highest mean alkalinity at 440 µEq l-1, compared to an overall mean of 197 µEq l-1
(Maberly et al. 2016). A thin band of Coniston Limestone (deposited 350 to 270 million years ago) runs through the very north of the catchment area (Moseley 1978). Glacial till overlies the bedrock geology on the lower slopes of the valley, while alluvial and lacustrine deposits surround the lake itself (British Geological Survey 1998). Catchment soils are predominantly free-draining brown earths composed of silt loam and sandy loam with poorly-drained peaty gley soils in places (Hall & Folland 1970). The catchment once supported deciduous woodlands comprising, oak (Quercus petraea), ash (Fraxinus
excelsior) and yew (Taxus baccata). However, much of the former forest was cleared to
Figure 2.1: Location of Esthwaite Water and its catchment area in the UK. Source: Mackay (2011).
2.3
Climate background
The proximity of the Lake District to the western seaboard of the country strongly
influences the region’s climate. Annual mean rainfall is high due to westerly winds from
the Atlantic Ocean forcing moist air over the Cumbrian hills where it cools, and the moisture condenses to form rain. The spatial distribution of rainfall over the Lake District is extremely heterogeneous owing to its mountainous topography and associated orographic rainfall processes (Barker et al. 2004; Jones & Conway 1997); annual totals range from 0.92 m y-1 at Kendal (Tufnell 1997) to over 3.00 m y-1 at Seathwaite (Manley
1946). Meteorological data has been collected at Ambleside (8 km northwest of Esthwaite Water) since 1961. The average annual rainfall (1965 to 2014) at this site, taken as an approximation of rainfall over the Esthwaite Water catchment, is relatively high at 2.00 m y-1. The catchment generally experiences a rainy season between September and
February, with precipitation decreasing in the middle of the year. There is also considerable variation in air temperature throughout the year. This seasonal variation results in the thermal stratification of Esthwaite Water, typically from mid-May through to the end of September, with the hypolimnion becoming anoxic during this period (George & Hewitt 1999). Figure 2.2 illustrates average seasonal weather patterns.
Figure 2.2: Average monthly weather patterns for the period 1965 to 2014 at Laurel Bank, Ambleside: a) air temperature, b) rainfall, c) wind speed, d) cloud cover, and e) sunshine hours. Error bars show the standard deviation of monthly means.
The influence of the NAO on lake conditions is diminished during the summer. Instead, meteorological variability associated with latitudinal displacement of the Gulf Stream in the western Atlantic has been shown to have a significant effect on the timing and intensity of thermal stratification, which in turn influences summer phytoplankton and zooplankton biomass (George 2000, 2002; George & Taylor 1995). Recent work by Strong & Maberly (2011) also highlights the significance of the large-scale atmospheric phenomenon known as tropospheric Rossby wave breaking (RWB) in controlling the
0 5 10 15 20
J F M A M J J A S O N D
Ai r te mper at ur e (° C) Month (a) 0 2 4 6 8 10 12
J F M A M J J A S O N D
R ai nfa ll (mm d¯¹ ) Month (b) 2 3 4 5 6
J F M A M J J A S O N D
Wi nd spe ed (m s¯¹ ) Month (c) 4 5 6 7 8
J F M A M J J A S O N D
Clo ud co ver ( o ct a ) Month (d) 0 1 2 3 4 5 6
J F M A M J J A S O N D
surface temperature of Cumbrian lakes, including Esthwaite Water. RWB occurs frequently near the Lake District, bringing warm and moist air, or cool and dry air from distant climes. Because this effect operates in all seasons it is potentially more important than the NAO as a driver of year-to-year variation in a wide range of lake properties.
2.4
Long-term monitoring programme
Esthwaite Water is one of the most intensively studied lakes in the world. The Freshwater Biological Association (FBA) initiated a long-term monitoring programme in 1945, subsequently undertaken by the Institute of Freshwater Ecology and Centre for Ecology & Hydrology (CEH) since 1989. A wide range of physical, chemical and biological variables are recorded at the lake on a fortnightly basis. More recently, CEH has installed an Automatic Water Quality Monitoring Station in the lake and a meteorological station on the shore, which collect high-resolution meteorological and hydrographic data to contribute to the UK Lake Ecology Observatory Network (Rouen et al. 2005; Woolway et al. 2015). The data that result from the two monitoring schemes provide an invaluable resource for advancing our understanding of how lake ecosystems respond to environmental perturbation. Seminal work conducted early in the monitoring programme has been summarised by Talling & Heaney (1983) and Maberly et al. (2011). Contemporary investigations span a broad range of topics, including: phytoplankton phenology (Feuchtmayr et al. 2012), long-term and seasonal zooplankton dynamics (George 2012; George et al. 1990; George & Hewitt 1999), physical processes (Mackay et al. 2011; Woolway et al. 2014) and algal community modelling under different climate change scenarios (Elliott 2010).
2.5
Bottom-up stressors: History of eutrophication
Esthwaite Water has been ranked several times as the most productive of the major Cumbrian lakes (Gorham et al. 1974; Jones 1972; Pearsall 1921). It is naturally mesotrophic (i.e. intermediate nutrient levels) owing to relatively high nutrient export from the catchment soils, but a long history of human activity in the region has elevated the nutrient load to the lake above naturally occurring levels (May et al. 1997; Pearsall 1921). Palaeolimnological records reveal little evidence of changing nutrient status between c. 800 and 1850 AD, followed by a gradual and accelerating increase between 1850 and the early 1970s (Bennion et al. 2000; Dong et al. 2011). A more dramatic increase is evident thereafter, both in the palaeolimnological record (Dong et al. 2012) and in the long-term monitoring data (George et al. 1990; Talling & Heaney 1983).
The earlier phase of eutrophication has been attributed to the increased use of artificial fertilisers in the catchment area, the advent of phosphorus-based detergents, commercial forestry operations and the growth of tourism in the region following the establishment of a railway connection to Windermere in 1847 (Bennion et al. 2000; McGowan et al. 2012; Rollinson 1967). The onset of the latter phase of eutrophication is coincident with the founding of a wastewater treatment works (WwTW) to serve the village of Hawkshead which discharges treated effluent to the main inflow (Agar et al. 1988; Talling & Heaney 1988). A further external nutrient source was introduced in 1981 with the installation of a fish farm for rainbow trout (Oncorhynchus mykiss) cultivation in the southern basin of the lake, and the consequent input of food and waste in various forms emanating from aquaculture cages to the water column (Hall 1991; Hall et al. 1993).
The enrichment of Esthwaite Water is best illustrated by the long-term trend in winter soluble reactive phosphorus (SRP) concentrations (Figure 2.3). At this time of year, SRP is consistently high as there is relatively little assimilation by phytoplankton and maximal replenishment by inflows (Sutcliffe et al. 1982). Prior to the establishment of Hawkshead WwTW in 1973, the annual winter mean SRP concentration rarely exceeded 3 µg l-1.
Thereafter, the concentration gradually increased to a maximum of 18.4 µg l-1 in 2001.
the water column concentrations (Hall et al. 1993; Mackay et al. 2012; Talling & Heaney 1983).
Nutrient enrichment has had a profound effect on the ecology of Esthwaite Water. The most notable symptoms have been an increase in the overall abundance of phytoplankton concurrent with the period of water quality deterioration (Maberly et al. 2011), and prolonged occurrence of cyanobacterial blooms throughout summer and autumn (Heaney
et al. 1992). It is evident in the sediment fossil record that the diatom community
composition has shifted away from species characteristic of low nutrient conditions (e.g.
Cyclotella comensis, Cyclotella radiosa and Achnanthidium minutissimum) towards those
with a higher tolerance for eutrophic environments [e.g. Asterionella formosa and
Fragilaria crotonensis (Bennion et al. 2000; Dong et al. 2011)]. The once diverse
macrophyte community has also been impacted. An early study by Pearsall (1917) recorded 22 species of submerged or floating macrophytes in Esthwaite Water, including the nationally rare Najas flexilis. Subsequent surveys have recorded a 50 % loss in macrophyte diversity and Najas flexilis now appears to be extinct in Esthwaite Water (Darwell 2000).
Figure 2.3: Annual winter SRP concentration (mean of December, January and February
measurements), Esthwaite Water, 1946 to 2014. Data collected on a fortnightly basis as part of the CEH long-term monitoring programme.
0 2 4 6 8 10 12 14 16 18 20
1945 1950 1955 1960 1965 1970 1975 1980 1985 1990 1995 2000 2005 2010 2015
Wi
nter
SRP
(µg
l¯¹
)
Year
1973: Hawkshead WwTW established
1981:Fish cages installed
1986: Tertiary phosporus
removal introduced at WwTW 2009:cages removedFish
2012:
2.6
Top-down stressors: The introduction of farmed trout
In 1983, two years after the installation of aquaculture cages, the fishery began to release a component of annual production to the lake for recreational fishing (c. 11,000 fish released annually). The introduction of this non-native species may have triggered a trophic cascade by increasing the predation pressure on macroinvertebrates and smaller fish species, and in turn reducing the predation pressure on zooplankton. The zooplankton may have been further relieved from predation due to the supplementary feeding of native planktivorous fish on uneaten food waste from the fish culture cages. Grey et al. (2004) used stable isotope analysis to investigate the fate of waste pelleted food in Esthwaite Water. They concluded that roach (Rutilus rutilus) were probably
short-circuiting the lake’s food chain by directly consuming significant quantities of particulate
pellet material, to the extent that 80 % of their body carbon may ultimately have been derived from fish food.
Unfortunately, the fish population of Esthwaite Water has been subject to relatively little investigation. Limited information is available regarding changes to species composition and abundance since the long-term monitoring programme began. A brief description of the fish population in 1989 noted that brown trout (Salmo trutta), pike (Esox lucius) and perch (Perca fluviatilis) were the main species, with roach and rudd (Scardinius
erythrophthalmus) also present (Frost 1989). The most recent survey, conducted in
August 2013, determined that the fish population is currently dominated by roach and perch, a scenario typical of eutrophic lakes (Winfield et al. 2014). The native brown trout population appears to have become severely reduced or to have died-out altogether, perhaps as a result of competition for resources with the larger, more aggressive stocked trout or predation of juvenile brown trout by the stocked trout (Welton et al. 1997).
2.7
Recent remediation efforts
continued impact on food web dynamics. Moreover, the stocked fish may continue to act as an external nutrient source having been fed on highly nutritious pelletised food up until the point of their release.
The most recent efforts to remediate Esthwaite Water have been undertaken by United Utilities. Between 2010 and 2012 wastewater handling facilities at Hawkshead were upgraded extensively. Table 2.1 details the timeline of lake remediation efforts and other relevant human activities in the catchment area since long-term water quality monitoring began in 1946. The impact of these changes on lake water quality is investigated in Chapter Three.
Long-term water quality monitoring data suggests some improvement in recent years. As shown in Figure 2.3, annual winter mean SRP concentration decreased from 18.4 µg l-1 in
2001 to 6.3 µg l-1 by 2014. However, Esthwaite Water is not currently of Good Ecological
Status as required by the EU WFD. The 2015 Lakes Tour classified it at Moderate Ecological Status, based on the annual mean concentration of total phosphorus (TP, 17.5 µg l-1) and the annual mean modelled chlorophyll a concentration (16.1 µg l-1). The
site-specific EU WFD boundaries for achieving Good Ecological Status are 16.4 µg l-1 for TP and
Table 2.1: Timeline of lake remediation efforts and other significant anthropogenic activities in Esthwaite Water and its catchment area since the start of long-term monitoring in 1946.
Year Activity Details
1973 WwTW established to
serve the village of Hawkshead.
⁻ Treated effluent discharged into Black Beck,
the main inflow to Esthwaite Water.
1981 Esthwaite Water Trout
Fishery installed fish culture cages in the south basin of the lake.
⁻ Approximately 200,000 rainbow trout (150
tonnes) produced annually in floating cages.
1983 The fishery began stocking
the lake with rainbow trout for recreational fishing.
⁻ Approximately 11,000 fish (8.5 tonnes)
released annually.
1986 Tertiary phosphorus
removal implemented at Hawkshead WwTW.
⁻ Phosphorus stripping by chemical
precipitation.
⁻ Initially carried-out between April and
October then year-round from 1989.
1993 Redirection of Near
Sawrey WwTW effluent outflow.
⁻ Originally discharged directly into Esthwaite
Water.
⁻ Redirected to the outflow, Cunsey Beck.
1998 Switch to organic farming
by the fishery. ⁻ Annual rainbow trout production reduced to approximately 67,000 fish (50 tonnes) per
year.
2006 Catchment Sensitive
Farming scheme
implemented in England.
⁻ Joint initiative of the Environment Agency,
Natural England and Defra.
⁻ Promotes voluntary action by farmers in
priority catchments to tackle the problems of diffuse water pollution from agriculture.
⁻ Esthwaite lies within the Rivers Kent and
Leven Catchment.
2009 Fish culture cages removed
from Esthwaite Water. ⁻ Fish farm activities bought-out by Natural England.
2010–2012 Hawkshead WwTW
underwent major upgrades.
⁻ Upgrade of tertiary treatment process to
reduce the phosphorus concentration of the final effluent.
⁻ System capacity increased to reduce the
occurrence of intermittent discharges of untreated effluent.
2011–2013 Fishery phased out
stocking of rainbow trout in favour of brown trout.
⁻ Stocking reduced to approximately 7,500
Chapter Three
Long-term changes in phytoplankton indicators of lake water quality
in response to multiple anthropogenic stressors
3.1
Introduction
Humankind relies on lakes for the provision of numerous essential goods and resources. These include, but are not limited to, the supply of water for domestic, industrial and agricultural purposes, food production, waste disposal and recreation (Maltby & Ormerod 2011; Wetzel 2001). Lakes face a variety of pressures arising from catchment-based anthropogenic activities and long-term changes in background environmental conditions, which greatly threaten their ecological integrity (Allan et al. 2013; Dudgeon et al. 2006; Vörösmarty et al. 2000). Consequently, lake degradation has become a major cause for concern throughout the world and increasing efforts are being made to protect lakes and to secure the vital ecosystem services that they provide (Carpenter & Cottingham 1997; Cooke et al. 2005; Søndergaard et al. 2007). In Europe, focus on this issue has intensified since 2000 with the implementation of the EU Water Framework Directive (WFD), which stipulates that natural waterbodies must be returned to Good Ecological Status by 2027 (European Union 2000).
The availability of nutrients, particularly phosphorus, has long been recognised as a key factor in determining lake ecological condition (Correll 1998; Schindler 1977; Vollenweider 1968). Phosphorus enrichment of lakes from point and diffuse sources of agricultural, sewage and industrial wastes within the catchment is common in densely populated regions (Bennett et al. 2001; Carpenter et al. 1998; Hall et al. 1999; McGowan
et al. 2012). The resultant increase in nutrient availability in the lake typically promotes
phytoplankton growth, including toxin-producing cyanobacteria, which in turn has significant negative impacts on water quality, biodiversity and functioning of the lake (Harper 1992; Smith et al. 1999). Traditionally, lake restoration efforts have focused on reducing the phosphorus load from catchment sources to lakes. Although some lakes respond rapidly to changes in the external phosphorus load (Sas 1989), water quality improvements have frequently been slow, commonly taking many years to decades for the recovery process to end (D’Arcy et al. 2006; Jeppesen et al. 1991; Marsden 1989). The reason for this delayed recovery is that phosphorus accumulated in sediments during periods of high external loading cycles between water column and bed sediments, which acts to slow relinquishment from the lake (Søndergaard et al. 2001). Although this internal load diminishes over time, it may be intense enough to maintain high lake water phosphorus concentrations and subsequently poor ecological conditions for many years following external load reductions (Jeppesen et al. 2005; Søndergaard et al. 2003; Spears
Lakes that are afflicted by eutrophication are also often subjected to other local and widespread anthropogenic pressures, which further complicates their management (Christensen et al. 2006; Maberly & Elliott 2012; Smol 2010). At the local scale, the introduction of non-native species is one such pressure. Fish are often introduced to freshwaters, either by accident or deliberately to provide food or sport (Strayer 2010). Nutrient availability may determine potential phytoplankton biomass although biomass accrual can be limited through grazing by zooplankton (Carpenter et al. 1985). Zooplankton grazing is in turn influenced by the abundance of zooplanktivorous fish (Brooks & Dodson 1965; Hrbácek et al. 1961). Therefore, fish stocking and the associated change in predation pressure can cascade through trophic levels to zooplankton and thus alter the grazing pressure exerted on phytoplankton. Whether the impact on phytoplankton is positive or negative depends on the species of fish introduced to the lake and pre-existing food web structure (Matsuzaki et al. 2009).
In recent decades, global climate change has emerged as a serious threat to the structure and function of lake ecosystems (George 2010; Jeppesen et al. 2010; Shurin et al. 2012). The most studied effects of climate change on lakes have been those related to warming and its impact on phytoplankton. Phytoplankton community data from lake monitoring (Jöhnk et al. 2008; Kosten et al. 2012; Posch et al. 2012), experimental mesocosms (Rasconi et al. 2017) and modelling (Elliott 2010) indicate that the abundance of cyanobacteria relative to other phytoplankton groups increases with increasing temperature. Cyanobacteria have a higher optimum growth temperature than many other phytoplankton groups, and elevated water temperatures can favour cyanobacteria directly (Butterwick et al. 2004). Additionally, changes in lake physical properties connected to increasing air temperature indirectly benefit cyanobacteria. Some species have ecophysiological adaptations, such as buoyancy regulation (e.g. Microcystis) and the ability to fixate atmospheric nitrogen (e.g. Dolichospermum), which give them a competitive advantage over other species in nutrient-depleted, poorly-mixed water column conditions (Carey et al. 2012; Paerl & Huisman 2008). Climate warming causes lakes to stratify earlier in the spring and turnover later in the autumn (De Stasio et al. 1996), thereby lengthening the annual period of optimal growth conditions for cyanobacteria (Wagner & Adrian 2009, 2011).
precipitation events (IPCC 2014b). A decrease in overall summertime rainfall may contribute to favourable conditions for cyanobacteria growth due to potentially longer periods of high evaporation and stratification (Reichwaldt & Ghadouani 2012). On the other hand, short-term periods of heavy rainfall could temporarily inhibit the development of cyanobacteria blooms due to flushing and de-stratification (Reynolds & Lund 1988). However, heavy rainfall events are also likely to increase diffuse nutrient loading from the catchment to the lake (Heathwaite & Dils 2000). When river discharge subsides and lake residence time increases, the nutrients delivered to the lake will be captured and can trigger the development of cyanobacterial blooms (Paerl & Huisman 2008). There is growing concern that the recovery of eutrophic lakes following nutrient load reduction will be overridden by the effects of climate change on phytoplankton communities (Jeppesen et al. 2005; Moss et al. 2011).
High-resolution physico-chemical, biological and climate data from long-term monitoring programmes are an essential resource for developing our understanding of how ecosystems respond to anthropogenic perturbations (Elliott 1990; Franklin 1989; Lindenmayer & Likens 2010). This knowledge is essential for the successful management and restoration of lakes. Unfortunately, continuous lake monitoring schemes are often initiated only after water quality has deteriorated, making it difficult to determine the specific causes and mechanisms of ecosystem change. Comprehensive long-term data sets do, however, exist for a small number of well-studied sites in the UK, including Esthwaite Water in the English Lake District, where records now span over 70 years (Maberly & Elliott 2012). Additionally, human activities in the lake and catchment area, which have the potential to impact on water quality, have been reasonably well documented over the last century. Consequently, Esthwaite Water is an ideal study site with which to examine the timescales, processes and end points of responses to changes in multiple stressors.
In this study, phytoplankton biomass and community composition, specifically the relative abundance of cyanobacteria, were used as biological indicators of water quality change in Esthwaite Water. The main objectives were:
(i) To compile a long-term record of annual external phosphorus loads to Esthwaite Water, which could be used in combination with water column phosphorus concentrations to predict historical annual net sediment phosphorus fluxes by mass balance modelling.
(ii) To investigate variation in long-term water quality indicators in relation to the timing of major anthropogenic activities in the lake and catchment area, for example the establishment of Hawkshead WwTW and installation of aquaculture cages.
(iii) To determine the relationships between water quality indicators and a range of potential drivers of variability, including phosphorus availability, food web structure and climatic variables.
It was hypothesised that:
(i) Water quality would deteriorate rapidly following an increase in external phosphorus load, associated with various anthropogenic activities in the catchment area and lake.
(ii) The impact of measures to reduce the external phosphorus load implemented after water quality deterioration would be obscured by the commencement of internal phosphorus loading and the effects of ongoing and accelerating climate change on lake phytoplankton communities.
3.2
Methods
3.2.1 Data collection
Much of the data used in this study originated from an ongoing long-term monitoring programme in the pelagic zone of Esthwaite Water, UK (for study site details refer to Chapter Two). Although the monitoring scheme started in 1945, analysis here focused on the period 1970 to 2014, during which consistent methods were used to collect the data of interest at weekly to biweekly intervals. Integrated surface water samples for the determination of key biological and chemical properties were collected by lowering a weighted plastic tube to a depth of 5 m (Lund 1949). Concentrations of total phosphorus (TP, µg l-1) were measured colourimetrically following the digestion of particulate
volume of the integrated surface water sample through a Whatman GF/C filter (pore size c. 1.2 µm). Following the extraction of pigments from the filter paper in boiling methanol, chlorophyll a concentrations were determined spectrophotometrically (Talling 1974).
Water samples for phytoplankton enumeration were preserved with Lugol’s iodine upon
collection. Preserved samples were mixed thoroughly, and sub-samples of a known volume were sedimented in graduated measuring cylinders. The supernatant was siphoned off before the constituent phytoplankton species in the remaining sample were identified and counted by microscopic examination (Lund et al. 1958). Aggregate crustacean zooplankton data were derived from counts of cladocera and copepoda retained on the filter papers used in the determination of chlorophyll a concentration (Talling 2003). Although this method produces data of lower taxonomic resolution than the microscopic examination of zooplankton samples collected by net-hauls, population estimates obtained by the two methods during periods of overlapping use at Esthwaite Water are strongly correlated (George 2012). As the filter paper method provides the only continuous record of zooplankton abundance between 1970 and 2014, it was considered the most suitable source of data for this study.
The main inflow to Esthwaite Water, Black Beck, is sampled as part of the long-term monitoring programme. Black Beck TP concentration data were available at weekly to biweekly resolution from April 1985 onwards. Water samples were collected approximately 0.5 km upstream of the point where treated sewage effluent is discharged to Black Beck from Hawkshead WwTW. Throughout 2013 and 2014, additional monthly samples were collected for TP analysis from Black Beck and from the five smaller inflows to Esthwaite Water. Measurements of flow velocity (m s-1) were taken at the same time
using a current meter (C2 Current Meter, OTT Hydromet GmbH, Kempten, Germany) and multiplied by stream cross-sectional area to obtain discharge (m3 s-1). Samples of final
treated effluent from Hawkshead WwTW were provided fortnightly by United Utilities throughout 2013 and 2014, which were analysed for their TP concentration. United Utilities also provided daily mean data of final effluent discharge from the WwTW for 2013 and 2014. Daily mean discharge data for the outflow from Esthwaite Water, Cunsey Beck, were available from the National River Flow Archive (NRFA) from 1976 onwards. Meteorological data were provided by a citizen scientist based at Ambleside, 8 km north of Esthwaite Water. Rainfall (mm d-1), wind speed (m s-1) and air temperature (°C) have
all been measured at twice daily intervals throughout the study period. Esthwaite Water Trout Fishery provided a record of fish food input (kg month-1) to aquaculture cages in
3.2.2 Quantification of external phosphorus loads
The major external phosphorus sources to Esthwaite Water during the study period were identified as diffuse run-off from the catchment area, direct rainfall over the lake, waste from in-lake salmonid culture cages, and treated sewage effluent discharged to lake inflows from local WwTWs (Hall et al. 1993; Maberly et al. 2011; Talling & Heaney 1983). The phosphorus load from each of these sources was calculated at monthly intervals from January 1970 to December 2014. The methods used for estimating external phosphorus load are outlined in this section. A detailed description of the data used to calculate the loads is provided in the Appendix.
Sufficient data were available for most of the study period (April 1985 to December 2014) to calculate the catchment phosphorus load transported to Esthwaite Water via the main inflow, Black Beck, as follows:
Black Beck Load = 𝐾 (𝑇𝑃BB × 𝑄BB) (3.1)
where, K is a factor to convert from per second load to a monthly total load, TPBB is the
monthly mean TP concentration of Black Beck (µg l-1), and Q is monthly mean discharge (l
s-1). Unfortunately, the five minor inflows to Esthwaite Water have not been monitored
with the same regularity as Black Beck. However, previous short-term studies have estimated that the minor inflows account for c. 14 % of the total inflow phosphorus load (Hall et al. 1993; Talling & Heaney 1983). In the absence of comprehensive TP concentration and discharge data for the minor inflows, calculation of the total catchment phosphorus load (kg month-1) was based on this estimate of catchment load
apportionment between inflows:
Total Catchment Load = 1.14 × Black Beck Load (3.2)
Prior to April 1985 there was no routine monitoring of any of the inflows. Talling & Heaney (1983) reported estimates of monthly inflow phosphorus loads made throughout 1968 and 1969. Linear interpolation between these data and the loads calculated using long-term monitoring data from 1985 onwards was used to fill the gap in the catchment phosphorus load record (refer to Appendix).
discharge point. Loads from the two sources could therefore be calculated independently. The phosphorus load from Hawkshead WwTW throughout 2013 and 2014 was calculated at monthly intervals using the same equation applied to Black Beck phosphorus load:
WwTW Load = 𝐾 (𝑇𝑃WwTW × 𝑄WwTW) (3.3)
where, TPWwTW is the monthly mean TP concentration of discharged effluent calculated
from fortnightly measures, and QWwTW is the monthly mean effluent discharge calculated
from the daily mean data provided by United Utilities. Although effluent TP concentration was not measured routinely before 2013, estimates of annual phosphorus load from Hawkshead WwTW were available in reports of short-term investigations conducted at various points between 1973 and 2012 (Agar et al. 1988; Hall et al. 1993; Maberly et al. 2011). An annual estimate of the phosphorus load from Near Sawrey WwTW prior to effluent diversion away from the lake in 1994 was also available (Agar et al. 1988). The timings of these estimates were sufficient to determine mean annual WwTW phosphorus loads for each of the management regimes outlined in Table 3.1. These annual loads were distributed between months based on the monthly apportionment of Hawkshead WwTW phosphorus load in 2013 and 2014.
Hall (1991) conducted a short-term experiment in Esthwaite Water to determine the phosphorus budget of rainbow trout culture cages. Of the phosphorus added to the cages in fish food, only 37 % was retained in trout biomass. The remaining 63 % was lost from the cages to the surrounding water column as waste. It was assumed that trout phosphorus retention was consistent throughout the study period and the results of Hall (1991) were used in the quantification of monthly fish farm phosphorus loads between 1993 and 2009 as follows:
Fish Farm Load = 0.63 (𝐹𝐹 × 𝑇𝑃FF) (3.4)
where, FF is the mass of fish food added to the cages (kg) and TPFF is the proportional
The phosphorus load introduced to Esthwaite Water by rainfall was calculated by multiplying rain water TP concentration (TPrain) by the volume of rain to fall directly over
the lake (Vrain, l):
a. 𝑉rain= 1000 (𝐷𝑒𝑝rain × 𝐴lake) (3.5)
b. Rainfall Load = 𝑇𝑃rain × 𝑉rain (3.6)
where, Deprain is rainfall depth during the month of interest (m) and Alake is the surface
area of Esthwaite Water (m2), multiplication by 1000 to convert units of volume from m3
to l. Based on the findings of a nutrient budgeting exercise at a nearby lake, TPrain was set
at 25 µg l-1 (May et al. 1997).
The monthly loads from each of the external phosphorus sources were summed to obtain a long-term record of annual external load. Annual loads were then averaged for each of the seven management regimes (Table 3.1) to assess how relative contributions of phosphorus changed with significant management changes either in the catchment area or in the lake itself.
Table 3.1: Timeline of significant anthropogenic changes and lake remediation efforts in Esthwaite Water and the surrounding catchment area since 1970. Changes at the WwTWs or Esthwaite Water Trout Fishery are indicated in bold underlined font.
Regime Period WwTW Aquaculture Stocking
1 1970 –1972 Near Sawrey No No
2 1973 –1980 Near Sawrey + Hawkshead No No
3 1981 –1986 Near Sawrey + Hawkshead Yes Yes
4 1987 –1992 Near Sawrey + Hawkshead (upgraded)
Yes Yes
5 1993 –2009 Hawkshead (Nr. Sawrey effluent
diverted from Esthwaite Water) Yes Yes
6 2010 –2012 Hawkshead No Yes
3.2.3 Quantification of sediment phosphorus flux
Annual net sediment phosphorus flux (kg) was quantified for each year of the study period using a mass balance approach. First, water column phosphorus concentration at the start of each month (TPstart, µg l-1) was calculated by averaging all measurements of TP
concentration recorded 15 days either side of the first day of the month (usually two measurements, one per fortnight). TPstart was then multiplied by lake volume (6.7 x 10⁹ l)
to obtain an estimate of in-lake phosphorus mass. Changes in lake volume were not taken into account. The difference in starting phosphorus mass between adjacent months was calculated. Changes in phosphorus mass were accounted for by phosphorus input from external sources and the export of phosphorus via the outflow. Unaccounted-for change in phosphorus mass between months was attributed to sediment phosphorus flux:
Sediment Phosphorus Flux = (𝑀TP_2 − 𝑀TP_1) − (𝑇𝑃in − 𝑇𝑃out) (3.7)
MTP_1 is the phosphorus mass (kg) in the lake at the start of the month of interest and MTP_2
is the mass at the start of the following month. TPin and TPout are the input and outflow
loads (kg), respectively. Sediment phosphorus flux was calculated for individual months from January to April and October to December each year. Between May and September Esthwaite Water is typically thermally stratified (George & Hewitt 1999; Maberly et al. 2011). As TP concentration is measured in a sample of surface water, it will not be representative of the entire water column when the lake is stratified. To avoid the use of inaccurate phosphorus mass estimates, sediment phosphorus flux was calculated for the whole of the stratified period rather than for individual months, with the May phosphorus mass used as MTP_1 and October mass used as MTP_2. Monthly external and outflow loads
were combined from May to September each year for use in the calculation of sediment phosphorus flux during stratification.