A UK student survey investigating the effects of consuming alcohol mixed with energy
drinks on overall alcohol consumption and alcohol-related negative consequences
Sean J. Johnson
a,⁎
, Chris Alford
a, Karina Stewart
b, Joris C. Verster
c,d aThe Centre for Research in Biosciences, Department of Health and Social Sciences, University of the West of England, Bristol BS16 1QY, UK
bDepartment of Biological, Biomedical and Analytical Sciences, University of the West of England, Bristol BS16 1QY, UK c
Utrecht Institute for Pharmaceutical Sciences, Division of Pharmacology, Utrecht University, Utrecht, The Netherlands
d
Centre for Human Psychopharmacology, Swinburne University, Melbourne, Australia
a b s t r a c t
a r t i c l e i n f o
Article history:
Received 23 May 2016
Received in revised form 31 August 2016 Accepted 6 September 2016
Available online 07 September 2016
Previous research reported positive associations between alcohol mixed with energy drink (AMED) consumption and overall alcohol consumption. However, results were largely based on between-subjects comparisons comparing AMED consumers with alcohol-only (AO) consumers, and therefore cannot sufficiently control for differences in personal characteristics between these groups. In order to determine whether AMED consumers drink more alcohol on occasions they consume AMED compared to those when they drink AO additional with-in-subjects comparisons are required.
Therefore, this UK student survey assessed both alcohol consumption and alcohol-related negative consequences when consumed alone and when mixed with energy drinks, using a within-subject design.
A total of 1873 students completed the survey, including 732 who consumed AMED. It was found that AMED consumers drank significantly less alcohol when they consumed AMED compared to when they drank AO (pb0.001). In line with reduced alcohol consumption significantly fewer negative alcohol-related consequences were reported on AMED occasions compared to AO occasions (pb0.001).
Thesefindings suggest that mixing alcohol with energy drinks does not increase total alcohol consumption or alcohol-related negative consequences.
© 2016 The Authors. Published by Elsevier Inc. This is an open access article under the CC BY-NC-ND license (http://creativecommons.org/licenses/by-nc-nd/4.0/).
Keywords:
Alcohol mixed with energy drinks Student alcohol consumption Consequences
1. Introduction
Excessive alcohol consumption is a persistent global issue, ranked the third leading cause of death and disability worldwide (SS et al., 2012). In England in 2013/14 there were 6592 alcohol-related deaths, a 10% increase from 2003, and over 1 million hospital admissions relat-ed to alcohol consumption (Health and Social Care Information Centre, 2015). These alarming statistics are underlined by thefindings that 24% of people in the UK consume alcohol in a way that is harmful or po-tentially harmful to their health and well-being (National Health Service, n.d.-a).
In the past decade there has been increased concern regarding heavy episodic or binge drinking. In the UK binge drinking is defined as con-sumingN8 units of alcohol for men, and more than six units of alcohol for women (National Health Service, n.d.-b). Recent research by the World Health Organization (2014)found that Britain is one of the worst countries in the world for binge drinking, ranked 13th out of
196 countries, with 28% of Britons classed as having had an episode of heavy drinking in the previous month- twice the global average. Binge drinking is particularly prevalent among young people, with 27% of 16–24 year olds found to have drunk very heavily at least once in the past week (Office for National Statistics, n.d.). Thesefindings indicate a serious public health problem and social issue that requires attention. Therefore, it is important to study the factors that may be contributing to high rates of alcohol consumption among young people in the UK.
Recently there has been much public health interest and British media attention on the rise in popularity of mixing alcohol with energy drinks and its possible effect on overall alcohol consumption and nega-tive alcohol-related consequences. Indeed, despite energy drinks com-prising only 1% of the total non-alcoholic beverage market (UNESDA, 2012), 15–24% of students aged 18–30 years old report consuming alco-hol mixed with energy drinks (AMED) at least once in the past month (O'Brien et al., 2008; Velazquez et al., 2012). Research attention has primarily focused on whether consuming AMED poses a public health concern above and beyond consuming alcohol by itself, and therefore a behaviour worth targeting to reduce excessive alcohol consumption.
Several studies have compared alcohol consumption among those who mix alcohol with energy drinks and those who consume alcohol
Abbreviations:AMED, Alcohol Mixed with Energy Drink; AO, Alcohol-Only; BYAACQ, Brief Young Adult Alcohol Consequences Questionnaire.
⁎ Corresponding author.
E-mail address:Sean2.Johnson@live.uwe.ac.uk(S.J. Johnson).
http://dx.doi.org/10.1016/j.pmedr.2016.09.005
2211-3355/© 2016 The Authors. Published by Elsevier Inc. This is an open access article under the CC BY-NC-ND license (http://creativecommons.org/licenses/by-nc-nd/4.0/). Contents lists available atScienceDirect
Preventive Medicine Reports
only, using a between-subjects design. The majority of these studies (Brache and Stockwell, 2011; Eckschmidt et al., 2013; Flotta et al., 2014; O'Brien et al., 2013) have consistently found that those who con-sume AMED drink significantly more alcohol on an average drinking oc-casion compared to those who consume alcohol only (AO). In line with increased alcohol consumption those who consumed AMED also report-ed significantly more alcohol-related consequences than those who consumed AO, including driving whilst intoxicated (Brache and Stockwell, 2011; Eckschmidt et al., 2013; Flotta et al., 2014; O'Brien et al., 2013) and having unplanned unprotected sex (O'Brien et al., 2008, 2013). Early explanations for these findings purported that AMED consumption leads to a reduced perception of alcohol intoxica-tion (Marczinski, 2011), increasing the amount of alcohol consumed and susceptibility to negative alcohol-related consequences (O'Brien et al., 2008; Arria et al., 2010, 2011; Miller, 2008; Thombs et al., 2010; Berger et al., 2010). The foundations of these claims were based on the hypothesis that the stimulant effects of caffeine counteract the sedative effects of alcohol, resulting in AMED consumers feeling less impaired and less intoxicated than they actually are, and therefore more likely to consume further quantities of alcohol and more likely to take risks. However, as evidenced in a recent meta-analysis (Benson et al., 2014) experimental research has consistently failed to support the notion that mixing alcohol with caffeinated beverages reduces the perceived level of intoxication. Other between-subjects research has also disputed the relationship between AMED consumption and increased alcohol consumption. A survey by Penning et al. found no significant difference in alcohol consumption or next day hangover severity between those that consumed AMED and those that consumed AOPenning et al., 2011. Similarly,Rossheim and Thombs (2011)reported no significant relationship between AMED consumption and the chances of being in-toxicated, and intoxication levels for AMED consumers were compara-ble to those consuming non-caffeinated mixed drinks.
Moreover, some researchers (Skeen and Glenn, 2011; Verster et al., 2012) have questioned the methodological shortcomings of using be-tween-subjects designs to reach causal conclusions on the effects of mixing alcohol with energy drinks on overall alcohol consumption. The main reason for criticism is that this approach does not reveal rel-evant information about the possible role that energy drinks play in af-fecting overall alcohol consumption or its related consequences. Even when, as the research outlined shows, AMED individuals consume more alcohol than those who consume AO, this does not imply that mixing alcohol with energy drinks caused increased alcohol consump-tion. The presented correlations in the surveys between energy drink and alcohol consumption do not imply that one causes the other. In fact, between-subjects comparisons introduce the influence of potential confounders that are not controlled for and may explain the observed differences in the frequency and quantity of alcohol consumption. Therefore, between-subjects comparison surveys are unsuitable and may lead to inappropriate conclusions regarding the need for policy changes to reduce the consumption of AMED.
In order to verify whether mixing alcohol with energy drinks in-creases overall alcohol consumption and negative alcohol-related con-sequences some researchers have adopted a within-subjects design. This approach compares the drinking behaviour on AMED occasions with other occasions on which the same people consume AO, therefore controlling for potential between-subject variables. Thus, when using a within-subjects design the only difference between the drinking occa-sions is the co-consumption of energy drinks allowing causal inferences to be made. Whilst some studies have found small but statistically sig-nificant increases in alcohol consumption and negative alcohol-related consequences on AMED occasions compared to AO occasions (Brache and Stockwell, 2011; Peacock et al., 2012; Price et al., 2010), the major-ity of research has found no difference (Verster et al., 2015) or statisti-cally significant decreases in alcohol consumption and negative alcohol-related consequences (Woolsey et al., 2010; De Haan et al., 2012a; Lubman et al., 2013). For example, in thefirst large scale survey
(TotalN= 6002, AMED consumersN= 1239) applying a within-sub-jects design,De Haan et al. (2012a, 2012b)found that compared with consuming AO, when consuming AMED, students drank significantly fewer alcoholic drinks, reported significantly fewer drinking days and days being drunk, and significantly fewer occasions of consuming more thanfive alcoholic drinks. In addition, when consuming AMED, significantly fewer negative alcohol-related consequences were report-ed. In a recent meta-analysis of all within-subject comparisons AMED researchVerster et al. (2016)found no significant difference in overall alcohol consumption between AMED and AO occasions. Thisfinding is reflected in recent authoritative evaluation (UK COT, 2012;EFSA NDA Panel (EFSA Panel on Dietetic Products, Nutrition and Allergies), 2015) concluding that the mixing of energy drinks with alcohol does not pose any additional risks compared with drinking alcohol on its own.
In summary, research to date suggests that AMED consumers drink significantly more alcohol than AO consumers. However, there does not appear to be any difference in the amount of alcohol consumed by AMED consumers on AMED occasions compared to AO occasions. Some researchers have explained this observed pattern of alcohol consumption as being caused by underlying personality differences between the two groups, such as levels of risk-taking behaviours (Verster et al., 2012). Indeed, much of the previous between-sub-jects research has found that AMED consumers had higher scores on sensation-seeking, childhood conduct problems, masculine norms and drug use compared to alcohol only consumers (Arria et al., 2010, 2011; Miller, 2008; Berger et al., 2010; Snipes and Benotsch, 2013). Thus a personality with higher levels of risk taking behaviour may be the primary reason for increased alcohol and drug abuse, with the co-consumption of energy drinks being just one of the many ex-pressions of such a lifestyle.
Despite the concerns raised regarding the effects of mixing energy drinks with alcohol there is currently a lack of available data from the UK. Indeed, despite the UK having one of the highest rates of binge drinking in the World (World Health Organization, 2014), in a review of the available research no studies were identified from the UK (Verster et al., 2012). In order to throw light on current energy drink and alcohol use in the UK, a partial replication of the Utrecht survey byDe Haan et al. (2012a, 2012b)was conducted, but with students at Universities throughout the UK. The primary aim of this survey was to examine alcohol consumption and its consequences when consumed alone or when mixed with energy drinks using the appropriate with-in-subjects design. Differences in demographics, alcohol, smoking and drug use between alcohol only and AMED consumers were also explored using between-subjects analysis.
2. Materials and methods
2.1. Sample
All student unions at Universities throughout the UK (N= 139) were contacted via email to ask if they would be willing to act as a gate-keeper and distribute the link to the AMED student survey via their so-cial media platforms (Facebook and Twitter). This link was posted at three stages during thefive week data collection period; on the opening day, half way through the data collection period and one week before the survey was due to close. In total 30% of student unions, including in-stitutions from each country (England, Wales, Scotland, Northern Ire-land) responded and agreed to take part. Given the nature of using social media as a recruitment method it was not possible to determine the response rate.
A total of 2371 respondents opened the link to the survey. Responses were included if they provided informed consent, were students, 18– 30 years old and answered the questions necessary to classify them as one of the drinking groups. After cleaning the data 498 participants were excluded, giving a complete dataset of 1873 student responses. For the analysis in this paper, data were used for the AO group (i.e. those who consumed alcohol and did not mix alcohol with energy drinks,N= 865) and AMED group (those who consumed both AO and AMED,N= 732). Data concerning those who consume both alcohol alone and energy drinks alone but do not mix these on the same drink-ing occasion, as well as those who do not consume alcohol but consume energy drinks alone will be discussed elsewhere.
2.2. Survey outline
After obtaining informed consent, thefirst part of the survey assessed demographic data and participants' medication, smoking and drug use, as well as membership to university society/sports group.
Following this, participants were asked a number of questions re-garding their consumption of alcohol alone and when mixed with ener-gy drinks. Participants who responded“yes”to whether or not they consumed the particular beverage in question (i.e. do you consume al-cohol? or do you consume energy drinks?) were considered current consumers. Alcohol-only consumption was explicitly stated as consum-ing alcohol (beer, larger, wine, spirits etc) not mixed with energy drinks or other soft drinks. Mixing was defined as consuming energy drinks within a time period of 2 h before through to 2 h after drinking alcohol. This operationalization allowed for both the consumption of alcohol mixed with energy drinks, i.e. Jägerbombs, and the consumption of en-ergy drinks between alcoholic drinks. Alcohol consumption was defined
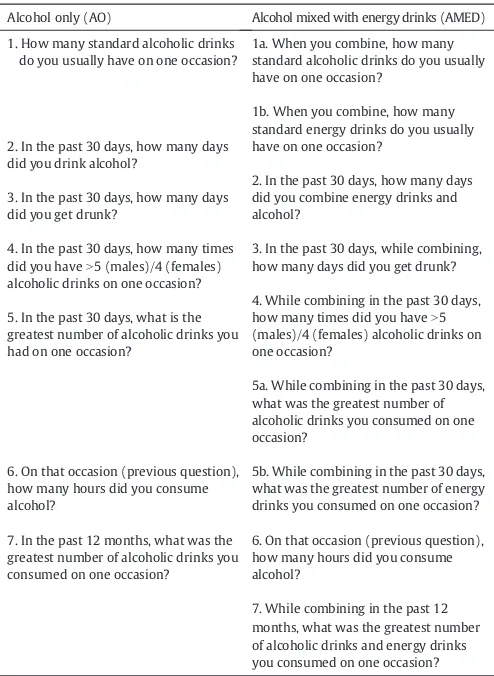
using standardised UK alcohol units (1 standard unit = 10 ml of pure al-cohol) (National Health Service, n.d.-c) and one energy drink standardised to 250 ml (containing 80 mg of caffeine). The consumption questions (Table 1) were standard questions adapted from the Quick Drinking Screen (QDS) that investigated participant's consumption habits (frequency and quantity) across differing timescales (one occa-sion, 30 days, 12 months) considering the particular drink in question. This method has been previously used (Woolsey et al., 2010; De Haan et al., 2012a) with four of the questions having been shown to be highly reliable and consistent when compared to the Timeline Followback method (Roy et al., 2008).
To investigate alcohol-related negative consequences, the Brief Young Adult Alcohol Consequences Questionnaire (BYAACQ) was used (Kahler et al., 2005). The BYAACQ contains 24 possible consequences of alcohol consumption, such as“I have often found it difficult to limit how much I drink”and“My drinking has got me into sexual situations I later regretted”, with participants indicating whether the statement was applicable to them in the past year by answering“yes”or“no”. The total BYAACQ scores range from 0 to 24. In addition to the standard BYAACQ, followingDe Haan et al. (2012a, 2012b)two additional items were included to determine whether participants were injured or got into afight after alcohol consumption. Depending on the participant's specific drinking behaviour, the BYAACQ and additional items were completed for AO and AMED drinking occasions.
2.3. Data collection and statistical analysis
Data were collected online via SurveyMonkey® (Palo Alto, CA), cleaned in Microsoft Excel and analysed using the Statistical Package for the Social Sciences version 20 (SPSS Inc., Chicago, IL). The mean, standard deviation and frequency distribution were computed for alco-hol consumption and BYAACQ scores for occasions on which partici-pants consumed AO and AMED. Variables with a normal distribution were tested with the Studentt-test (Paired t-test for within-subjects, independent t-test for between-subjects). For nominal variables, a Chi Square test was used. For the BYAACQ data, a McNemar test was performed on single items and a paired t-test on the total scores. All tests were two-tailed, and differences were regarded as significant at
pb0.05.
3. Results
3.1. Between-subjects comparisons
The age and gender distribution of the sample obtained was similar to that of students throughoutUK Universities (2013). The AO group comprised of 865 participants and the AMED group comprised 732 participants. Between-subjects analysis (Table 2) revealed significant differences in sex and age, with a higher percentage of females in both the AO and AMED group, and relatively more males and younger partic-ipants in the AMED group. The groups differed significantly from each other on illicit drug use and smoking, with AMED consumers more like-ly to take illicit drugs and smoke than AO consumers. In addition AMED consumers were significantly more likely to consume alcohol regularly at an earlier age than the AO group, but there was no significant differ-ence in the age at which each groupfirst consumed alcohol.
[image:3.595.36.283.405.743.2]In addition, the between-subjects analysis also revealed a consistent pattern of significant differences across all AO consumption questions (all comparisons significantly different atpb0.001), in that those who consumed AMED drank more alcohol during AO occasions compared to AO consumers. For example, compared with the AO group, the AMED group consumed significantly more alcoholic drinks (8.9 ± 6.0 versus 6.4 ± 4.1,d= 0.48) during an average drinking session, reported significantly more drinking days (7.1 ± 5.3 versus 6.1 ± 4.7,d= 0.20) and days drunk (4.0 ± 3.8 versus 2.8 ± 3.0,d= 0.35) in the past month, and significantly more occasions of consuming more than four Table 1
Consumption questions.
Alcohol only (AO) Alcohol mixed with energy drinks (AMED)
1. How many standard alcoholic drinks do you usually have on one occasion?
2. In the past 30 days, how many days did you drink alcohol?
3. In the past 30 days, how many days did you get drunk?
4. In the past 30 days, how many times did you haveN5 (males)/4 (females) alcoholic drinks on one occasion?
5. In the past 30 days, what is the greatest number of alcoholic drinks you had on one occasion?
6. On that occasion (previous question), how many hours did you consume alcohol?
7. In the past 12 months, what was the greatest number of alcoholic drinks you consumed on one occasion?
1a. When you combine, how many standard alcoholic drinks do you usually have on one occasion?
1b. When you combine, how many standard energy drinks do you usually have on one occasion?
2. In the past 30 days, how many days did you combine energy drinks and alcohol?
3. In the past 30 days, while combining, how many days did you get drunk?
4. While combining in the past 30 days, how many times did you haveN5 (males)/4 (females) alcoholic drinks on one occasion?
5a. While combining in the past 30 days, what was the greatest number of alcoholic drinks you consumed on one occasion?
5b. While combining in the past 30 days, what was the greatest number of energy drinks you consumed on one occasion?
6. On that occasion (previous question), how many hours did you consume alcohol?
(female)/five (male) alcoholic drinks (4.7 ± 4.4 versus 3.3 ± 3.4,d= 0.35). Furthermore, when compared to the AO group, the AMED group consumed significantly more maximum number of drinks on a single occasion in the previous month (12.8 ± 8.5 versus 9.4 ± 6.4,d= 0.45) and the duration of alcohol consumption on this occasion was sig-nificantly longer for AMED group compared to AO group (5.8 ± 3.0 ver-sus 5.2 ± 2.8 h,d= 0.21). Finally, the maximum number of alcoholic drinks consumed on one occasion in the past 12 months was higher among the AMED group than the AO group (18.0 ± 9.3 versus 13.7 ± 7.8,d= 0.50).
There were also significant differences (pb0.001) in alcohol-related negative consequences (BYAACQ), with AMED consumers experiencing significantly more overall negative alcohol-related consequences com-pared to AO consumers, on AO occasions (9.0 ± 5.4 versus 6.6 ± 4.7,
d= 0.47).
3.2. Within-subjects analysis for AMED group
To establish whether mixing energy drinks with alcohol had an im-pact on total alcohol consumption, within-subjects comparisons were performed for members of the AMED group (N= 732), comparing oc-casions on which they consumed AMED with ococ-casions on which they consumed AO. As can be seen inFig. 1. the analysis revealed statistically significant differences across all consumption questions (pb0.001) in-dicating generally lower frequency and quantity of alcohol consumption when combining with energy drinks compared to consuming alcohol alone. For example, compared to consuming AO, when consuming AMED, participants consumed significantly fewer alcoholic drinks dur-ing an average drinkdur-ing session (6.0 ± 4.9 versus 9.0 ± 6.1,d= 0.54), reported significantly fewer drinking days (2.3 ± 2.8 versus 7.0 ± 5.3,
d= 1.11) and days drunk (2.1 ± 2.7 versus 4.0 ± 3.8,d= 0.58) in the past month, and significantly fewer occasions consuming more than four (female)/five (male) alcoholic drinks (2.1 ± 2.9 versus 4.7 ± 4.4,d= 0.70). They also consumed fewer maximum number of alcoholic drinks (7.0 ± 7.9 versus 12.9 ± 8.6,d= 0.72) on a single oc-casion in the previous month, and the duration of alcohol consumption on this occasion was significantly shorter (4.5 ± 3.2 versus 5.8 ± 2.9 h,
d= 0.43) when consuming AMED than when consuming AO. Finally, when consuming AMED they consumed fewer alcoholic drinks on a sin-gle occasion in the previous years than when consuming AO (7.0 ± 6.8 versus 17.9 ± 9.4,d= 1.33).
Confirmation of alcohol-related consequences when consuming AMED or AO are summarised inTable 3. The within-subjects compari-sons show that across all items when consuming AMED alcohol-related negative consequences were experienced significantly less when com-pared with consuming AO. There was a 21% reduction in the total BYAACQ score, from 9.0 ± 5.4 for drinking AO to 7.1 ± 5.1 for AMED (p≤0.001,d= 0.36). None of the individual items showed an increased chance of experiencing an alcohol-related negative consequence on AMED occasions compared with drinking AO.
4. Discussion
[image:4.595.43.563.76.172.2]The results of this survey show that people who mix alcohol with en-ergy drinks consumed significantly fewer alcoholic drinks when they combine alcohol with energy drinks compared to when they consume alcohol alone. In addition, there was a reduction in the number of re-ported alcohol-related consequences when consuming AMED com-pared to consuming AO. These results are comparable with previous within-subjects comparisons (Woolsey et al., 2010; De Haan et al., 2012a; Lubman et al., 2013) and provides further support that mixing alcohol with energy drinks does not increase overall alcohol consump-tion or the likelihood of experiencing negative alcohol-related conse-quences such as driving whilst intoxicated. Thesefindings are of importance given that some authors (Arria et al., 2011; Howland and Table 2
Between-subjects demographics of study participants.
AO group (N= 865) AMED group (N= 732) Cohen'sd Pvalue Male/Female ratio M %/F % (CI%) 33.1%/66.9% (±3.1%) 45.9%/54.1% (±3.6%) 0.26 b0.001⁎
Age (years),x(SD) 21.0 (2.3) 20.6 (2.0) 0.19 b0.001⁎
Member of student union % (CI%) 57.3% (±3.3%) 59.6% (±3.6%) 0.10 0.114
Member of sports/society group % (CI%) 51.9% (±3.3%) 53.8% (±3.6%) 0.04 0.448
Medication use (past year) % (CI%) 18.2% (+2.6%) 19.5% (±2.9%) 0.04 0.480
Illicit Drug use (past year) % (CI%) 17.8% (±2.6%) 24.9% (±3.1%) 0.17 0.001⁎
Current Smoker % (CI%) 18.2% (±2.6%) 25.8% (±3.2%) 0.19 b0.001⁎
Agefirst consumed alcoholx(SD) 14.1 (3.0) 13.9 (3.0) 0.07 0.089
Age consumed alcohol regularlyx(SD) 17.2 (1.9) 17.0 (1.6) 0.11 0.009⁎
Notes:% = yes. 95% CI.
Abbreviations:N, number,x, mean, SD, standard deviation, CI, confidence interval, AO, alcohol-only, AMED, alcohol mixed with energy drinks. ⁎ Significant differences (pb0.05) between AO group and AMED group.
[image:4.595.45.294.474.692.2]Rohsenow, 2013) have made premature calls for policy changes to re-duce the consumption of AMED based on inappropriate between-sub-jects comparisons.
Despite thefindings that AMED does not increase the relative nega-tive impact on overall alcohol consumption or neganega-tive consequences in comparison to AO consumption, the data indicates that regardless of consumption occasion the majority of students (87% alcohol-only occa-sions, 69% AMED occasions) still consumed alcohol above the levels generally accepted as safe in the UK. Thus, the majority of students en-gaged in binge drinking, and this increased on days when they did not consume AMED. In addition, the number of reported alcohol-related negative consequences across both drinking occasions were alarming. Therefore, it is clear that alcohol abuse is an ongoing problem among UK students and further work is needed, including the promotion of protective behavioural strategies, to reduce excessive alcohol consump-tion and its knock on effects of negative consequences. However, the findings from this survey suggest that the pre-occupation with AMED consumption is only diverting attention away from the more pressing issue of excessive alcohol consumption per se.
The significance of thesefindings lies in the fact that this is a large scale survey, using a within-subjects design, to collect data on students from across the UK. The demographics of the current sample reflect those of the general student population in theUK Universities (2013) supporting the generalization of the results to all UK students. However, this must be done with caution given that convenience sampling via so-cial media was used, meaning it was not possible to determine the re-sponse rate and marginalized sections of the student population may have been excluded. In addition, as with all retrospective AMED surveys, the ability of students to reliably recall the number and type of drinks consumed in the past is likely to be affected by the high volume of alco-hol reportedly consumed on these occasions. This is especially the case for recalling drinking occasions within the last 12 months, which may
make it difficult to differentiate whether an alcohol related consequence occurred on an AMED or AO occasion. However, an advantage of using a within-subjects design is that any between-subject differences in recall bias are controlled for. To completely rule out the possibility of recall bias, prospective studies are required. However, this approach is expen-sive and time consuming.
A further limitation is that the sample obtained focused on universi-ty students, therefore the results cannot be generalized beyond this population. Given the unique drinking practices of university students, future research could usefully investigate alcohol and AMED consump-tion among different sub-populaconsump-tions.
5. Conclusions
This UK student survey found that although AMED consumers drink more alcohol and engage in more harmful behaviours than AO con-sumers, on AMED occasions they drank less alcohol and engaged in fewer harmful behaviours compared to alcohol only occasions. These findings provide support to the growing body of evidence that mixing alcohol with energy drinks does not increase total alcohol consumption or alcohol-related negative consequences. However, excessive alcohol consumption and associated alcohol related harms remain a persistent concern among the UK student population.
Author contributions
[image:5.595.33.553.85.365.2]SJ led the study presented in this paper; collected, analysed, interpreted the data and drafted the manuscript. CA, JV and KS partici-pated in the design and coordination of the study and helped to draft and review the manuscript. Each author has participated sufficiently in the work to take public responsibility for appropriate portions of the content. All authors read and approved thefinal manuscript. Table 3
Within-subjects comparison in the AMED group (N= 732) on BYAACQ items for occasions on which they consumed alcohol-only compared with the occasions on which they mixed alcohol with energy drinks.
Within-subjects comparison
BYAACQ AO occasions AMED occasions Cohen'sd Pvalue
I have had a hangover (headache, sick stomach) the morning after I had been drinking % (CI%) 86.2% (±2.8%) 77.1% (±3.4%) 0.43 b0.001 I have had less energy or felt tired because of my drinking % (CI%) 69.6% (±3.7%) 50.3% (±4.0%) 0.74 b0.001 I have had felt very sick to my stomach or thrown up after drinking % (CI%) 60.8% (±3.9%) 49.2% (±4.0%) 0.45 b0.001 I've not been able to remember large stretches of time while drinking heavily % (CI%) 60.6% (±4.0%) 50.3% (+4.0%) 0.40 b0.001 While drinking, I have said or done embarrassing things % (CI%) 73.5% (±3.6%) 61.6% (±3.9%) 0.55 b0.001 I often have ended up drinking on nights when I had planned not to drink % (CI%) 52.8% (±4.0%) 32.4% (±3.8%) 0.76 b0.001 I have taken foolish risks when I have been drinking % (CI%) 51.1% (±4.0%) 45% (±4.0%) 0.27 0.001 I have not gone to work or missed classes at school because of drinking, a hangover or illness caused by drinking % (CI%) 47.7% (±4.0%) 41.4% (±4.0%) 0.30 b0.001 The quality of my work or school work has suffered because of my drinking % (CI%) 28.9% (±3.7%) 19% (±3.2%) 0.50 b0.001 When drinking, I have done impulsive things I regretted later % (CI%) 38.9% (±3.9%) 33.3% (±3.8%) 0.29 0.001 I have found that I needed larger amounts of alcohol to feel any effect, or that I could no longer get high or drunk on the
amount that used to get me high or drunk % (CI%)
34.8% (±3.9%) 26.7% (±3.6%) 0.47 b0.001
I have felt badly about myself because of my drinking % (CI%) 25.8% (±3.5%) 20.9% (±3.3%) 0.29 b0.001 My drinking has got me into sexual situations I later regretted % (CI%) 33.8% (±3.8%) 26.5% (±3.6%) 0.38 b0.001 I have been overweight because of drinking % (CI%) 19.4% (±3.2%) 15.4% (±2.9%) 0.26 0.002 I have spent too much time drinking % (CI%) 31.1% (±3.7%) 21.9% (±3.3%) 0.51 b0.001 I have often found it difficult to limit how much I drink % (CI%) 31.4% (±3.8%) 26.5% (±3.6%) 0.27 0.001 I have neglected my obligations to family, work, or school because of drinking % (CI%) 19.5% (±3.2%) 14.3% (±2.8%) 0.37 b0.001 My drinking has created problems between myself and my boyfriend/girlfriend/spouse, parents, or other near relatives
% (CI%)
17.7% (±3.1%) 11.5% (±2.6%) 0.42 b0.001
I have woken up in an unexpected place after heavy drinking % (CI%) 22.9% (±3.4%) 16.3% (±3.0%) 0.43 b0.001 My physical appearance has been harmed by my drinking % (CI%) 22.6% (±3.4%) 16.5% (+3.0%) 0.36 b0.001 I have become very rude, obnoxious, or insulting after drinking % (CI%) 26% (±3.5%) 21.7% (±3.3%) 0.24 0.003 I have driven a car when I knew I had too much to drink to drive safely % (CI%) 9.5% (±2.4%) 7.5% (±2.1%) 0.16 0.043 I have felt like I needed a drink after I′d gotten up (that is, before breakfast) % (CI%) 7.6% (±2.1%) 4.1% (±1.6%) 0.29 b0.001
I have passed out from drinking % (CI%) 26.5% (±3.6%) 19.4% (±3.2%) 0.43 b0.001
Total BYAACQ score meanx(SD) 9.0 (5.4) 7.1 (5.1) 0.36 b0.001
#I have physically injured myself or others after drinking–separate to being in afight % (CI%) 25.5% (±3.5%) 20% (±3.2%) 0.33 b0.001 #I have got into afight after drinking % (CI%) 12.7% (±2.7%) 9.7% (±2.4%) 0.24 0.003
Notes:% = yes. 95% CI. #Additional question added by the authors. All differences between AO group and AMED group are significant atpb0.05.
Conflicts of interest
Red Bull GmbH had no role in the design of the study; in the collec-tion, analyses, or interpretation of data; in the writing of the manuscript, and in the decision to publish the results.
Sean J Johnson has been involved in sponsored research for Pfizer, AstraZeneca, Merck, Gilead, Novartis, Roche and Red Bull GmbH. Chris Alford has undertaken sponsored research, or provided consultancy, for a number of companies and organisations including Astra, British Aerospace/BAeSystems, Civil Aviation Authority, Duphar, FarmItalia Carlo Erba, Ford Motor Company, ICI, Innovate UK, Janssen, LERS Synthélabo, Lilly, Lorex/Searle, Ministry of Defense, Quest International, Red Bull GmbH, Rhone-Poulenc Rorer, SanofiAventis. Joris C Verster has received grants/research support from The Dutch Ministry of Infrastruc-ture and the Environment, Janssen, Nutricia, Takeda, Red Bull, and has acted as a consultant for Canadian Beverage Association, Centraal Bu-reau Drogisterijbedrijven, Coleman Frost, Danone, Deenox, Eisai, Janssen, Purdue Pharma, Red Bull, Sanofi-Aventis, Sepracor, Takeda, Transcept, Trimbos Institute, and Vital Beverages. Karina Stewart has no competing interests.
Acknowledgments
This survey wasfinancially supported by Red Bull GmbH as part of a PhD studentship.
The authors are grateful to the UK university students unions who advertised the survey and the students who took the time to participate.
References
Arria, A.M., Caldeira, K.M., Kasperski, S.J., et al., 2010.Increased alcohol consumption, non-medical prescription drug use, and illicit drug use are associated with energy drink consumption among college students. J. Addict. Med. 4 (2), 74–80.
Arria, A.M., Caldeira, K.M., Kasperski, S.J., Vincent, K.B., Griffiths, R.R., O'Grady, K.E., 2011. Energy drink consumption and increased risk for alcohol dependence. Alcohol. Clin. Exp. Res. 35, 365–375.
Berger, L.K., Fendrich, M., Chen, H.Y., Arria, A.M., Cisler, R.A., 2010.Sociodemographic cor-relates of energy drink consumption with and without alcohol: results of a commu-nity survey. Addict. Behav. 36, 516–519.
Benson, S., Verster, J.C., Alford, C., Scholey, A., 2014.Effects of mixing alcohol with caffein-ated beverages on subjective intoxication: a systematic review and meta-analysis. Neurosci. Biobehav. Rev. 47, 16–21.
Brache, K., Stockwell, T., 2011.Drinking patterns and risk behaviors associated with com-bined alcohol and energy drink consumption in college drinkers. Addict. Behav. 36 (12), 1133–1140.
De Haan, L., de Haan, H.A., van der Palen, J., Olivier, B., Verster, J.C., 2012a.Effects of con-suming alcohol mixed with energy drinks versus concon-suming alcohol only on overall alcohol consumption and negative alcohol-related consequences. Int. J. Gen. Med. 5, 953–960.
De Haan, L., de Haan, H., Olivier, B., Verster, J.C., 2012b.Alcohol mixed with energy drinks: methodology and design of the Utrecht Student Survey. Int. J. Gen. Med. 5, 889–898. Eckschmidt, F., Guerra de Andrade, A., dos Santos, B., Garcia de Oliveira, L.C., 2013.The ef-fects of alcohol mixed with energy drinks (AmED) on traffic behaviours among Bra-zilian college students: a national survey. Traffic Inj. Prev. 14, 671–679.
EFSA NDA Panel (EFSA Panel on Dietetic Products, Nutrition and Allergies), 2015. Scientif-ic opinion on the safety of caffeine. EFSA J. 13 (5), 4102.http://dx.doi.org/10.2903/j. efsa.2015.4102120 pp.
Flotta, D., Micò, R., Nobile, C.G.A., Pileggi, C., Bianco, A., Pavia, M., 2014.Consumption of energy drinks, alcohol, and alcohol-mixed energy drinks among Italian adolescents. Alcohol. Clin. Exp. Res. 38, 1654–1661.
Health and Social Care Information Centre, 2015. Statistics on alcohol-England.http:// www.hscic.gov.uk/catalogue/PUB17712/alc-eng-2015-rep.pdf.
Howland, J., Rohsenow, D.J., 2013.Risks of energy drinks mixed with alcohol. JAMA 309 (3), 245–246.
Kahler, C.W., Strong, D.R., Read, J.P., 2005.Toward efficient and comprehensive measure-ment of the alcohol problems continuum in college students: the brief young adult alcohol consequences questionnaire. Alcohol. Clin. Exp. Res. 29 (7), 1180–1189. Lubman, D.L., Peacock, A., Droste, N., et al., 2013. Alcohol and energy drinks in NSW. (a,b).
Available atwww.health.nsw.gov.au.
Marczinski, C.A., 2011.Alcohol mixed with energy drinks: consumption patterns and mo-tivations for use in US college students. Int. J. Environ. Res. Public Health 8 (8), 3232–3245.
Miller, K.E., 2008.Energy drinks, race, and problem behaviors among college students. J. Adolesc. Health 43, 490–497.
National Health Service, a. Alcohol misuse http://www.nhs.uk/conditions/Alcohol-misuse/Pages/Introduction.aspx.
National Health Service, b. Binge drinkinghttp://www.nhs.uk/Livewell/alcohol/Pages/. National Health Service, Alcohol unitshttp://www.nhs.uk/Livewell/alcohol/Pages/
alcohol-units.aspx.
O'Brien, M.C., McCoy, T.P., Egan, K.L., Goldin, S., Rhodes, S.D., Wolfson, M., 2013. Caffeinat-ed alcohol, sensation seeking, and injury risk. J. Caffeine Res. 3, 59–66.
O'Brien, M.C., McCoy, T.P., Rhodes, S.D., Wagoner, A., Wolfson, M., 2008.Caffeinated cock-tails: energy drink consumption, high-risk drinking, and alcohol-related conse-quences among college students. Acad. Emerg. Med. 15 (5), 453–460.
Office for National Statistics, Opinions and lifestyle survey, drinking habits amongst adults http://www.ons.gov.uk/ons/rel/ghs/opinions-and-lifestyle-survey/drinking-habits-amongst-adults–2012/sty-alcohol-consumption.html.
Peacock, A., Bruno, R., Martin, F.H., 2012.The subjective physiological, psychological, and behavioral risk-taking consequences of alcohol and energy drink co-ingestion. Alco-hol. Clin. Exp. Res. 36 (11), 2008–2015.
Price, S.R., Hilchey, C.A., Darredeau, C., Fulton, H.G., Barrett, S.P., 2010.Energy drink co-ad-ministration is associated with increased reported alcohol ingestion. Drug Alcohol Rev. 29, 331–333.
Penning, R., de Haan, L., Verster, J.C., 2011.Caffeinated drinks, alcohol consumption, and hangover severity. Open Neuropsychopharmacol. J. 4, 36–39.
Rossheim, M.E., Thombs, D.L., 2011.Artificial sweeteners, caffeine, and alcohol intoxica-tion in bar patrons. Alcohol. Clin. Exp. Res. 35, 1891–1896.
Roy, M., Dum, M., Sobell, L.C., et al., 2008.Comparison of the quick drinking screen and the alcohol timeline followback with outpatient alcohol abusers. Subst. Use Misuse 43, 2116–2123.
Skeen, M.P., Glenn, L.L., 2011.Imaginary link between alcoholism and energy drinks. Al-cohol. Clin. Exp. Res. 35, 1375–1376.
SS, L., Vos, T., Flaxman, A.D., et al., 2012.A comparative risk assessment of burden of dis-ease and injury attributable to 67 risk factors and risk factor clusters in 21 regions, 1990–2010: a systematic analysis for the Global Burden of Disease Study 2010. Lancet 380, 2224–2260.
Snipes, D.J., Benotsch, E.G., 2013.High-risk cocktails and high-risk sex: examining the re-lation between alcohol mixed with energy drink consumption, sexual behavior, and drug use in college students. Addict. Behav. 38 (1), 1418–1423.
Thombs, D.L., O'Mara, R.J., Tsukamoto, M., et al., 2010.Event-level analyses of energy drink consumption and alcohol intoxication in bar patrons. Addict. Behav. 35, 325–330. UK COT, December 2012".Statement on the Interaction of Caffeine and Alcohol and Their
Combined Effects on Health and Behaviour.
UNESDA, 2012. UNESDA code for the labelling and marketing of energy drinks. Available atwww.unesda.org.
UK Universities, 2013. Patterns and Trends in UK Higher Education.http://www. universitiesuk.ac.uk/highereducation/Documents/2013/
PatternsAndTrendsinUKHigherEducation2013.pdf.
Velazquez, C.E., Poulos, N.S., Latimer, L.A., Pasch, K.E., 2012.Associations between energy drink consumption and alcohol use behaviors among college students. Drug Alcohol Depend. 123 (1), 167–172.
Verster, J.C., Aufricht, C., Alford, C., 2012.Energy drinks mixed with alcohol: misconcep-tions, myths, and facts. Int. J. Gen. Med. 5, 187–198.
Verster, J.C., Benjaminsen, J.M.E., van Lanen, J.H.M., van Stavel, N.M.D., Olivier, B., 2015. Ef-fects of mixing alcohol with energy drink on objective and subjective intoxication: re-sults from a Dutch on-premise study. Psychopharmacology 232, 835–842. Verster, J.C., Benson, S., Johnson, S.J., Scholey, A., Alford, C., 2016.Mixing alcohol with
en-ergy drink (AMED) and total alcohol consumption: a systematic review and meta-analysis. Human Psychopharmacol. 31 (1), 2–10.
Woolsey, C., Waigandt, A., Beck, N.C., 2010.Athletes and energy drinks: reported risk-tak-ing and consequences from the combined use of alcohol and energy drinks. J. Appl. Sport Psychol. 22, 65–71.