Richard J. Preen
[email protected] Department of Computer Science and Creative Technologies,University of the West of England, Bristol, BS16 1QY, UK
Larry Bull
[email protected]Department of Computer Science and Creative Technologies, University of the West of England, Bristol, BS16 1QY, UK
doi:10.1162/EVCO_a_00144
Abstract
An initial study has recently been presented of surrogate-assisted evolutionary algo-rithms used to design vertical-axis wind turbines wherein candidate prototypes are evaluated under fan-generated wind conditions after being physically instantiated by a 3D printer. Unlike other approaches, such as computational fluid dynamics simula-tions, no mathematical formulations were used and no model assumptions were made. This paper extends that work by exploring alternative surrogate modelling and evolu-tionary techniques. The accuracy of various modelling algorithms used to estimate the fitness of evaluated individuals from the initial experiments is compared. The effect of temporally windowing surrogate model training samples is explored. A surrogate-assisted approach based on an enhanced local search is introduced; and alternative coevolution collaboration schemes are examined.
Keywords
3D printing, coevolution, fitness approximation, neural network, partnering.
1
Introduction
greater visual, acoustic, radar and environmental impact” (Dabiri, 2011, p. 1). This has forced wind energy systems away from high energy demand population centres and toward remote locations with higher distribution costs.
In contrast, vertical-axis wind turbines (VAWTs) do not need to be oriented to wind direction and the spacing constraints of HAWTs often do not apply. VAWT performance can even be increased by the exploitation of interturbine flow effects (Charwat, 1978). In addition, VAWTs can also be easier to manufacture, may scale more easily, are typically inherently lightweight with little or no noise pollution, and are more able to tolerate extreme weather conditions (Eriksson et al., 2008). This has resulted in a recent expan-sion of their use in urban environments (Toja-Silva et al., 2013). However, their design space is complex and relatively unexplored. Generally, two classes of design are cur-rently under investigation and exploitation: Savonius (1930), which has blades attached directly upon the central axis structure; and Darrieus (1931), where the blades—either straight or curved—are positioned predominantly away from the central structure. Hy-brids also exist. The small body of previous work considering VAWT farms/arrays has used turbines originally intended to operate alone. Our work is the only known work to consider designing VAWTs in arrays of interacting turbines.
We have presented an initial study (Preen and Bull, 2014a) of surrogate-assisted ge-netic algorithms (SGAs; Dunham et al., 1963) used to design VAWTs wherein candidate prototypes are evaluated under fan-generated wind conditions after being physically instantiated by a 3D printer. That is, unlike other approaches, no mathematical for-mulations are used and no model assumptions are made. Initially, artificial evolution was used to explore the design space of a single isolated VAWT, and subsequently a cooperative coevolutionary genetic algorithm (CGA; Husbands and Mill, 1991) was applied to explore the design space of an array of two closely positioned VAWTs. Both conventional CGA and surrogate-assisted SCGA versions were examined; increased aerodynamic performance (rotational speed) in fewer fabrications was found with sur-rogate assistance. For single turbine comparison, the fittest evolved designs were found to be aerodynamically more efficient than several common human designs under the experimental conditions. In this paper, we extend that work by exploring alterna-tive surrogate modelling and evolutionary techniques. First, the accuracy of various modelling techniques used to estimate the fitness of the individuals from the initial experiments is compared. Subsequently, we compare surrogate model performance with different training samples. An alternative surrogate approach based on an en-hanced local search is introduced. Finally, alternative coevolution collaboration schemes are examined, including one that considers the potential for symmetry within the task.
2
Background
2.1 Interacting Vertical-Axis Wind Turbines
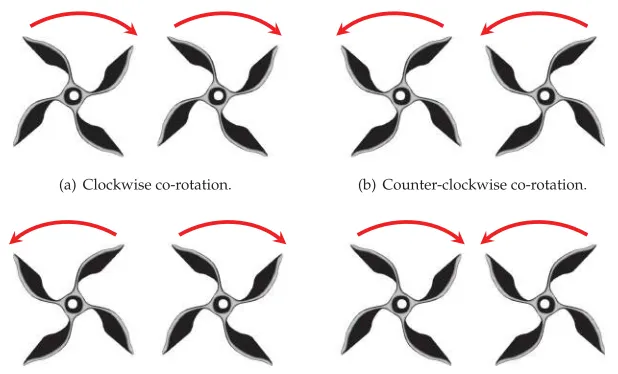
Figure 1: Possible VAWT pair rotation configurations.
wind velocity behind a turbine pair recovers to 95% of the wind velocity upwind after approximately 6 turbine diameters, compared with 4 diameters for the wake behind a single VAWT and 14 diameters for HAWTs. Thus, closely spaced VAWTs can result in an overall reduction in the average interturbine spacing as well as increasing individ-ual performance, leading to a much greater power density. Indeed, it has recently been shown (Dabiri, 2011) that power densities an order of magnitude greater can potentially be achieved by arranging VAWTs in layouts utilising counter-rotation that enable them to extract energy from adjacent wakes and from above the wind farm.
A growing body of work has explored techniques to optimise a given wind farm layout—termed micrositing. Algorithms used include genetic algorithms (GAs; Mosetti et al., 1994), evolution strategies (ESs; Kusiak and Song, 2010), particle swarm opti-misation (Aristidis et al., 2010), ant colony optiopti-misation (Ero ˘glu and Sec¸kiner, 2012), Monte Carlo simulation (Marmidis et al., 2008), and principles from fish schooling (Whittlesey et al., 2010). See Salcedo-Sanz et al. (2011) for a review of evolutionary computation–based techniques for micrositing. Importantly, all of this work has been based on wake models of varying degrees of fidelity.
2.2 Evolutionary Design
Evolutionary algorithms (EAs) have long been used to design 3D physical objects. Notably, Hornby et al. (2011) evolved and manufactured an X-band satellite antenna for NASA’s ST5 spacecraft, representing the world’s first artificially evolved hardware in space. Significantly, the evolved antennas outperformed a design hand-produced by the antenna contractor for the mission. Most approaches, however, have used simulations to provide the fitness scores of the evolved designs before final fabrication.
Most of blade design optimisation is performed through the use of computational fluid dynamics (CFD) simulations, typically described with 3D Navier-Stokes equations (Anderson, 1995). However, 3D CFD simulations are computationally expensive, with a single calculation taking hours on a high-performance computer, making their use with an iterative search approach difficult. Moreover, assumptions need to be made, for instance, regarding turbulence or pressure distributions, which can significantly affect accuracy when modelling interacting wind turbines. Previous evolutionary stud-ies have been undertaken with types of CFD to optimise the blade profile for both HAWT (Hampsey, 2002) and VAWT (Carrigan et al., 2012) to varying degrees of suc-cess/realism.
The evaluation of physical artifacts directly for fitness determination can be traced to the origins of evolutionary computation (Dunham et al., 1963). For example, the first ESs were used to design jet nozzles with a string of section diameters, which were then machined and tested for fitness (Rechenberg, 1971). Other well-known ex-amples include robot controller design (Nolfi, 1992), electronic circuit design using programmable hardware (Thompson, 1998), product design via human-provided fit-ness values (Herdy, 1996), chemical systems (Theis et al., 2006), and unconventional computers (Harding and Miller, 2004). Boria et al. (2009) used an EA to evolve a morph-ing wmorph-ing structure where physical designs were morphed usmorph-ing a set of actuators and evaluated in a closed-loop wind tunnel.
Evolution in hardware has the potential to benefit from access to a richer envi-ronment; it can exploit subtle interactions that can be utilised in unexpected ways. For example, the EA used by Thompson (1998) to work with field-programmable gate array circuits used some subtle physical properties of the system to solve problems where the properties used are still not understood. Humans can be prevented from designing systems that exploit these subtle and complex physical characteristics through their lack of knowledge; however this does not prevent exploitation through artificial evolution. There is thus a real possibility that evolution in hardware may allow the discovery of new physical effects, which can be harnessed for computation/optimisation (Miller and Downing, 2002).
used a 3D printer to perform a minimally invasive repair of the cartilage and bone of a calf femurin situ. Lipson and Pollack (2000) were the first to exploit the emerging technology in conjunction with an EA using a simulation of the mechanics and control, ultimately printing mobile robots with embodied neural network controllers.
2.3 Surrogate-Assisted Evolutionary Algorithms
Whilst the speed and cost of rapid prototyping continues to improve, fabricating an evolved design before fitness can be assigned remains an expensive task when poten-tially thousands of evaluations are required; for instance, 10 minutes print time for each very simple individual (Rieffel and Sayles, 2010). However, given a sampleDof evaluated individualsN, a surrogate model (also known as a metamodel or response surface model)y =f(x) can be constructed, wherexis the genotype andyfitness, in order to compute the fitness of an unseen data pointx /∈D. The use of surrogate models has been shown to reduce the convergence time in evolutionary computation and mul-tiobjective optimisation; see Jin (2011). Refer to Viana et al. (2014) for general reviews and Forrester and Keane (2009) for aerospace design optimisation.
Typically, a set of evaluated genotypes and their real fitness scores are used to perform the supervised training of a multilayer perceptron-based (MLP; Rosenblatt, 1962) artificial neural network (e.g., Eberhart, 1992). However, other approaches are widely used, for example, kriging (e.g., Ratle, 2001), clustering (e.g., Kim and Cho, 2001), support vector regression (e.g., Yun et al., 2009), radial-basis functions (e.g., Ong et al., 2006), and sequential parameter optimisation (e.g., Bartz-Beielstein, 2006). The surrogate model is subsequently used to compute estimated fitness values for the EA to utilise. The model must be periodically retrained with new individuals under a controlled evolutionary approach (also known as model management) to prevent convergence on local optima. Retraining can be performed by taking either an individual or generational approach. In the individual approach,nnumber of individuals in the population,P, are chosen and evaluated with the real fitness function each generation. In the generational approach, the entirety ofPis evaluated on the real fitness function eachnth generation. Typically the members with the highest approximated fitness are chosen to be evaluated with the real fitness function in the individual approach, although alternative schemes have been suggested; Bull (1999) found that evaluating both the best and random individuals suggested by a neural network surrogate model resulted in a significant improvement over exclusively evaluating either the best or random individuals. Both global modelling and local modelling using trust regions (e.g., samples within a certain Euclidean distance) are popular approaches (Le et al., 2013). Resampling methods and surrogate model validation remain an important and ongoing area of research, enabling the comparison and optimisation of models (Bischl et al., 2012).
The use of approximations in a coevolutionary context has previously been shown capable of solving computationally expensive optimisation problems with varying de-grees of epistasis more efficiently than conventional CGAs through the use of radial basis functions (Ong et al., 2002) and memetic algorithms (Goh et al., 2011).
2.4 Coevolution
the computationally more preferable use of one individual from each population (e.g., Bull and Fogarty, 1993). The use of the current best individuals from the other species populations was examined by Potter and De Jong (1994). In their work, all populations also received a shared fitness measure. Using a generational CGA, they reported that the strategy performed well. They also suggested that for higher cross-species epistasis an additional randomly selected individual should be used as a partner and the highest obtained fitness from the two pairings assigned to the evaluating genome. Bull (1997a) examined various strategies for choosing evaluation partners from coevolving popula-tions and also found improved performance on problems with significant cross-species epistasis when using multipartner strategies. No significant difference was observed whether the second collaborator was chosen randomly or fitness proportionately after Paredis (1994). These early results suggested that the collaboration method depends entirely upon the amount of epistatic interaction between different species. However the issue is more complex; for example, Wiegand et al. (2001) found that simply using the fittest individual as the collaborating partner worked best on a nonlinearly separa-ble quadratic prosepara-blem with cross-species epistasis. In addition, they found that when using multiple collaborative function evaluations, assigning the fitness score from the best collaboration is significantly better than using either the worst or average of the scores.
3
Methodology
Here, we investigate the use of SCGAs to design small wind farms, utilising the ag-gregated rotational speed of the array as fitness. Each VAWT is treated separately by evolution and approximation techniques; thus, heterogeneous designs could emerge.
A vector of 10 integers is used as a simple and compact encoding of thex-y-axis of a prototype VAWT. Each allele thus controls one-tenth of a singlez-layer. A workspace (maximum object size) of 30×30×30 mm is used so that the instantiated prototype is small enough for timely production (∼30 minutes) and with low material cost, yet large enough to be sufficient for fitness evaluation. The workspace has a resolution of 100×100×100 voxels. A central platform is constructed for each individual to enable the object to be placed on to the evaluation equipment. The platform consists of a square torus, 1 voxel in width and with a centre of 14×14 empty voxels that are duplicated for eachzlayer, thus creating a hollow tube that is 3 mm in diameter.
To translate the genome for a singlezlayer, an equilateral cross is constructed using the 10 aforementioned genes, with four blades bent at right angles and an allele range [1, 42]. For northeast and southwest quadrants the baseline is a horizontal line aty-axis= 50, and for northwest and southeast quadrants the baseline is a vertical line atx-axis= 50. Starting from the central platform and translating each gene successively, the one-tenth of voxels controlled by that gene are then drawn from the allele+baseline toward the baseline; see Figure 2a. If the current allele+baseline is greater than or the same as the previous allele+baseline, the voxels are enabled from the current allele+baseline to the previous allele+baseline and extended a further 2 voxels toward the baseline for structural support; see Figure 2b. If the current allele+baseline is less than or the same as the previous lower ending position, causing a gap, the voxels are enabled from the current allele+baseline upward to the previous lower position and extended a further 2 voxels; see Figure 2c. In all other cases, 2 voxels are enabled from the current allele+baseline position toward the baseline; see Figure 2d.
Figure 2: Translation ofx-y-axis genome [5, 8, 2, 4]. (a) The voxels are enabled from the first allele (5) to the baseline (bottom). (b) Subsequently, the voxels are enabled from the second allele (8) to the previous allele (5) and extended 2 voxels. (c) The third allele (2) is less than the previous lower position (3), causing a gap, and is thus drawn from the allele (2) to the previous lower position and extended 2 voxels to provide structural support. (d) The allele (4) is less than the previous upper position (5), and 2 voxels are enabled from the allele toward the baseline.
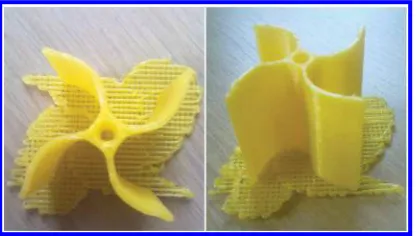
Figure 3: Example phenotype; genome=[2, 2, 3, 4, 5, 8, 13, 20, 34, 40].
format. Once encoded in STL, it then undergoes postprocessing with the application of 50 Laplacian smoothing steps using MeshLab;1see smoothed example phenotype in Figure 4. Finally, the object is converted to printer-readable G-code and is subsequently fabricated on a BFB 3000 printer (0.25 mm resolution) using a polylactic acid (PLA) bioplastic. Figure 5 shows the smoothed object after fabrication.
To enable prototypes withz-axis variability, the genome also includes five additional integers in the range [−42,42], each controlling one-sixth of thez-axis. After drawing the initialz-layer as previously described, eachzgene transforms thex-ygenome for the next successivez-layer by uniformly adding the allele value, after which it is drawn as described. For example, with an x-y-axis genome of [2, 2, 3, 4, 5, 8, 13, 20, 34, 40]
1MeshLab is an open source, portable, and extensible system for the processing and editing of
Figure 4: Example with 50 Laplacian smoothing steps applied.
Figure 5: Example smoothed and printed by a 3D printer; 30×30×30 mm; 27 minutes printing time.
andz-axis genome of [2,−5, 10, 3,−2], the nextz-layer is translated using thex-y-axis genome of [4, 4, 5, 6, 7, 10, 15, 22, 36, 42] and the followingz-layer is translated with [1, 1, 1, 1, 2, 5, 10, 17, 31, 37], and so on.
Since the interaction effects of rotor direction in the context of differing turbine morphology, relative phase angle, separation distance, positional layout, wind velocity, and so on, are not well understood, a Boolean gene is added to designate the rotation direction of a VAWT. Thus, a total of 16 genes define an individual. In a previous CGA experiment (Preen and Bull, 2014a) with two Savonius turbines positioned 0.1 diameters adjacently and in perpendicular position to the air flow, the average combined rotational speed of the final 20 counter-rotating pairs (M=1,760, SD=206,N =20) was significantly less than the average combined rotational speed of the final 20 co-rotating pairs (M=2,048,SD=95,N =20) using a two-tailed Mann-Whitney test (U= 17,p≤7.39×10⁻⁷), showing that co-rotation was found to result in faster combined rotational speed. It can be noted that this result is similar to Sun et al. (2012) where two counter-rotating S-rotors performed worse than co-rotating versions when placed at small separation distances.
[image:8.504.149.358.214.332.2]species thus maintainsP =20 individuals. The individuals in each species population are initially evaluated in collaboration with a single randomly selected individual from the other species population. Thereafter, the CGA proceeds by alternating between species after each offspring is formed and evaluated with the elite member from the other species; see Algorithm 1.
For the surrogate-assisted architecture described in this article, the basic CGA re-mains unchanged except that fitness evaluations are obtained from a forward pass of the genome through a neural network when the real fitness value is unknown. Initially the entire population is fabricated and evaluated on the real fitness function and added to an evaluated set. The model is trained using backpropagation for 1,000 epochs, where an epoch consists of randomly selecting, without replacement, an individual from the evaluated set and updating the model weights. Each generation thereafter, the individ-ual with the highest approximated fitness as suggested by the model and a randomly chosen unevaluated individual are fabricated and evaluated on the real fitness function and added to the evaluated set. The model weights must be reinitialised each time before training because of the temporal nature of pairing with the elite member. The genetic algorithm runs for one generation (using the model-approximated fitnesses where real fitness is unknown) before the individual with the highest approximated fitness and a randomly selected unevaluated individual are evaluated with the elite member from the other species; see Algorithm 2. The model parameters are β=0.3, θ =0,elast icity =1,calmingrat e=1,moment um=0,elast icityrat e=0.
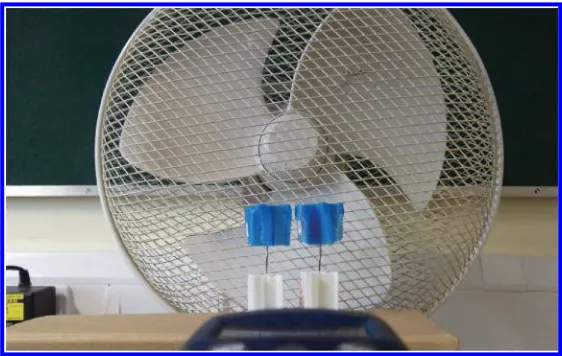
the individual’s blades. The experimental setup can be seen in Figure 6, showing the 30 W, 3500 rpm, 304.8 mm propeller fan, which generates 4.4 m/s wind speed, and two turbines mounted on rigid metal pins 1 mm in diameter and positioned 33 mm adjacently and 30 mm from the propeller fan. That is, there is a 3 mm spacing between the blades at their closest point.
4
Experiments
4.1 Modelling Techniques
To explore whether there is any significant advantage in replacing the neural network used previously as the surrogate model, several algorithms using the Weka 3.6.10 ma-chine learning collection2were run over the data generated by Preen and Bull (2014a). It is important to note that a surrogate model with a larger fitness prediction error may be more accurate in predicting the rank order of individuals than a model with lower error. Since the rank order is the guiding influence on the evolutionary process, alternative quality measures for approximate models have therefore been suggested. However, Bischl et al. (2012) found no difference between using the root mean squared error
2Weka is an open source data-mining algorithm collection. http://www.cs.waikato.ac.nz/ml/
Figure 6: VAWT array experimental setup.
(RMSE), mean absolute error (MAE), or Spearman’s rho, which measures the correla-tion between the actual and predicted ranking. Furthermore, in practice, optimisacorrela-tion based on the fitness accuracy has often been found to perform the best (e.g., H ¨usken et al., 2005). Thus, the MAEs of the fitness predictions are here used as the performance metric.
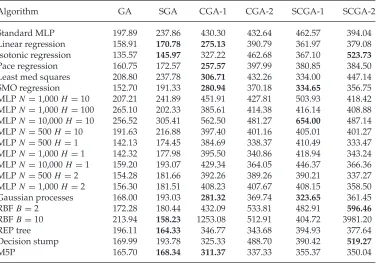
Table 1 shows the average MAEs for various algorithms predicting the fitness of evolved individuals. Each number represents the average MAE over 100 runs using 10-fold cross-validation (CV). The results are marked in bold font where they are statis-tically different from the standard MLP at the 95% confidence level using a two-sample t-test assuming unequal variances. GA is thez-axis varying GA-only single VAWT ex-periment (N =100); SGA is the surrogate-assisted GAz-axis varying VAWT experiment (N =100); CGA-1 is the first species from the CGA experiment (N=80); CGA-2 is the second species from the CGA experiment (N=80); SCGA-1 is the first species from the surrogate-assisted CGA experiment (N =80); and SCGA-2 is the second species from the surrogate-assisted CGA experiment (N =80). Default Weka parameters were used unless otherwise specified.
The results show that there is little statistical difference between the algorithms in predicting the fitness of the evolved individuals. This is perhaps due to the very small and noisy training samples available for this task. We therefore continue with neural network surrogate models, which are well suited to problems with a high-dimensional input space (design space) and limited number of samples (Jin, 2005). In addition, neural network modelling frequently outperforms more complex approaches such as coevolutionary active learning (Ly and Lipson, 2014).
4.2 Windowing
Table 1: Average mean absolute errors for algorithms predicting the fitness of evolved individuals from the experiments of Preen and Bull (2014a). Results marked in bold font are statistically different from the standard MLP at the 95% confidence level using a two-samplet-test assuming unequal variances.
Algorithm GA SGA CGA-1 CGA-2 SCGA-1 SCGA-2
Standard MLP 197.89 237.86 430.30 432.64 462.57 394.04
Linear regression 158.91 170.78 275.13 390.79 361.97 379.08
Isotonic regression 135.57 145.97 327.22 462.68 367.10 523.73
Pace regression 160.75 172.57 257.57 397.99 380.85 384.50
Least med squares 208.80 237.78 306.71 432.26 334.00 447.14
SMO regression 152.70 191.33 280.94 370.18 334.65 356.75
MLPN=1,000H =10 207.21 241.89 451.91 427.81 503.93 418.42 MLPN=1,000H =100 265.10 202.33 385.61 414.38 416.14 408.88 MLPN=10,000H =10 256.52 305.41 562.50 481.27 654.00 487.14 MLPN=500H =10 191.63 216.88 397.40 401.16 405.01 401.27
MLPN=500H =1 142.13 174.45 384.69 338.37 410.49 333.47
MLPN=1,000H =1 142.32 177.98 395.50 340.86 418.94 343.24 MLPN=10,000H =1 159.20 193.07 429.34 364.05 446.37 366.36
MLPN=500H =2 154.28 181.66 392.26 389.26 390.21 337.27
MLPN=1,000H =2 156.30 181.51 408.23 407.67 408.15 358.50 Gaussian processes 168.00 193.03 281.32 369.74 323.65 361.45
RBFB=2 172.28 180.44 432.09 533.81 482.91 596.46
RBFB=10 213.94 158.23 1253.08 512.91 404.72 3981.20
REP tree 196.11 164.33 346.77 343.68 394.93 377.64
Decision stump 169.99 193.78 325.33 488.70 390.42 519.27
M5P 165.70 168.34 311.37 337.33 355.37 350.04
they did so to save computational time rather than to intentionally aid convergence. Because of the temporal nature of partnering with the elite species members it may be advantageous to exclude older training samples for SCGAs. To explore whether there is any benefit from using different windowing approaches to training the surrogate model, 13 different models from Weka were run across the four datasets consisting of the 80 evaluated individuals in each species from the coevolution experiments: two species for CGA and two for SCGA. The final two individuals from each set were used for testing and were excluded from any training.
The models used are as follows. Weka default parameters were used unless other-wise stated: (1) Gaussian processes (support vector, RBF kernel); (2) isotonic regression; (3) linear regression (M5 attribute selection); (4) multilayer perceptron; (5) SMOreg (RBF kernel, RegSMO improved); (6) RBF network (B =2); (7) RBF net-work (B =100); (8) multilayer perceptron (N=1,000, H=10,M=0); (9) multilayer perceptron (N =500,H =1); (10) multilayer perceptron (N =1,000,H =1); (11) multi-layer perceptron (N =500,H =5); (12) multilayer perceptron (N =1,000,H =5); (13) multilayer perceptron (N =1,000,H=100).
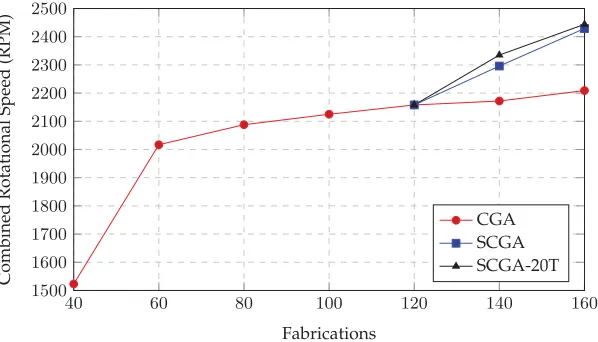
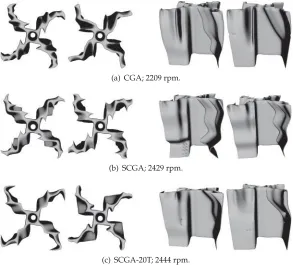
Figure 7: Array rotational speed-based evolution. Fittest array pairs. The SCGAs are used for comparison only after 120 evaluations (three generations) of the CGA, since sufficient training data are required for the surrogate models.
(M=197.11,SD=30.54,N =13) is significantly less thanT =78 (M=336.39,SD= 18.34, N =13) using a two-sample t-test assuming unequal variances, t(14)=4.76, p=.0003. In addition, the average MAE ofT =20 is also significantly less thanT =40 (M=269.94,SD=16.43,N =13),t(16)=3.31,p=.0045. However, the average MAE of T =10 (M=190.14, SD=15.03, N =13) was not significantly less than T =20, t(17)=0.74,p=.47.
These results suggest that using the most recent 20 training samples (i.e.,P) produces a more accurate model than using the full evaluation set. The SCGA was therefore rerun as before, using only the most recent 20 evaluated individuals for training (SCGA-20T); the results are shown in Figure 7. The average rotational speed of the original SCGA (M=2,112,SD=307,N=40) was significantly greater than CGA (M=1,905, SD=223, N =40) using a two-tailed Mann-Whitney test, U=331, p≤6.4×10⁻⁶. Furthermore, the fittest array combination designed by SCGA (2429 rpm) was greater than CGA (2209 rpm) after 160 fabrications. However, the average rotational speed of SCGA-20T (M=1,971,SD=386,N =40) is not significantly different than SCGA (M=2,112,SD=307,N=40) using a two-tailed Mann-Whitney test,U=629,p≤.1, and the fittest array combination was nearly identical after 160 fabrications; SCGA-20T 2444 rpm versus SCGA 2429 rpm. The fittest CGA, SCGA, and SCGA-20T evolved arrays after 160 fabrications can be seen in Figure 8.
4.3 Model Enhanced Local Search
Typically n individuals are evaluated with the real fitness function each generation, wheren < P. This results in a population consisting of a mix of individuals evaluated with the real fitness function and those whose fitnesses are approximated. However, Ulmer et al. (2004) introduced a preselection approach to the surrogate assistance of ESs. The approach consists of creatingλP reoffspring, whereλP re> λ, and evaluating each
Figure 8: Fittest evolved interacting VAWTs after 160 fabrications.
generated from parent individuals evaluated directly with the real fitness function. This enables an enhanced local search through the evaluation of a large number of offspring while preventing the evolutionary search from drifting too far from the evaluated design space, which can occur when repeatedly creating offspring from approximated individuals. They found that the bigger λP re is, the better the algorithm performed.
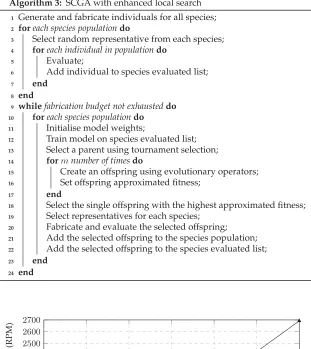
Here we explore the use of a SCGA with an enhanced local search, SCGA-ELS. The CGA runs as usual except that each time a parent is chosen,mnumber of offspring are created and evaluated with the surrogate model, and the single offspring with the highest approximated fitness is then fabricated and evaluated with the real fitness function before being added to the population; see Algorithm 3. Herem=1,000. The results are shown in Figure 9.
Figure 9: Array rotational speed-based evolution. Fittest array pairs. The SCGAs are used for comparison only after 120 evaluations (three generations) of the CGA, since sufficient training data are required for the surrogate models.
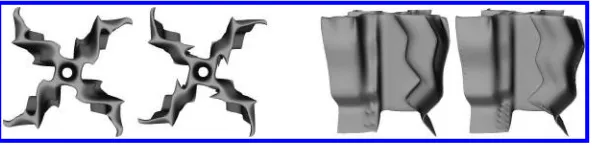
Figure 10: SCGA-ELS fittest evolved interacting VAWTs after 160 fabrications; 2692 rpm.
4.4 Collaboration Strategies
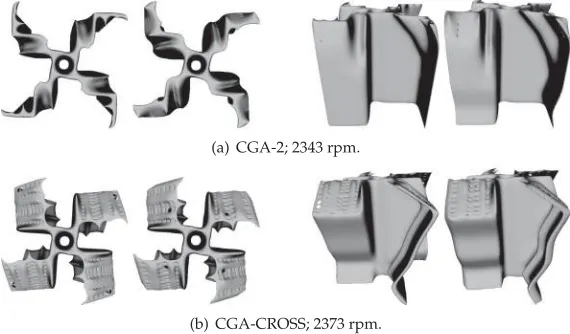
While it is relatively costly to fabricate a new VAWT prototype (∼30 minutes), the ro-tational speed measurement with the laser tachometer is relatively cheap (≤1 minute). Therefore, while it may not be the case for more elaborate wind tunnel testing condi-tions, here reevaluating some fabricated individuals with other partners may provide a relatively cheap way to increase performance. To see whether a two-partner strategy can increase the performance in designing two interacting VAWTs, the CGA was rerun with the same initial population as before, but collaboration was performed with an individual that was fitness proportionately selected (i.e., roulette wheel) in addition to the usual elite member from the other species population, and the larger of the two fit-ness scores assigned to the individual being evaluated (CGA-2). Since initially no fitfit-ness scores are known, each individual in the first generation of a species population was evaluated in conjunction with a single randomly selected individual from the other population (that is, as before) and also with a second randomly selected individual, uniquely chosen for each evaluation, and the larger of the two shared fitness scores assigned.
So far, it had been assumed that there is a significant degree of asymmetry within the array solution and hence no cross-species gene sharing had been permitted. However, it is possible that there may be sufficient symmetry that can be exploited to increase performance. Therefore, the CGA was also rerun with the same initial population as before, but an offspring was also evaluated in the alternative physical position and in collaboration with the elite member from its own species population (CGA-CROSS). If the fitness is greater than the population best fitness, it is also added to that species population, replacing the worst individual.
Figure 11: Array rotational speed-based evolution. Fittest array pairs.
Figure 12: Fittest evolved interacting VAWTs after 120 fabrications.
during initialisation provides a significant boost to performance over only partnering with a single random collaborator, but thereafter there is little performance benefit from performing extra evaluations.
[image:17.504.109.394.279.446.2]5
Conclusions
This article has explored a range of surrogate modelling and evolutionary techniques used to design interacting VAWTs wherein candidate prototypes are fabricated by a 3D printer and evaluated under fan-generated wind conditions. The experiments here have shown that it is possible to use SCGAs to iteratively increase the performance of closely positioned Savonius turbines, exploiting the interturbine flow effects, which is extremely difficult to achieve under simulation. The SCGA represents a scalable approach to the design of wind turbine arrays, since the number of inputs to the surrogate-models remains constant regardless of the number of turbines undergoing evolution.
The accuracy of various modelling algorithms used to estimate the fitness of evalu-ated individuals from the initial experiments was compared, finding that there is little difference between the algorithms for the current task. The effect of temporally window-ing the surrogate model trainwindow-ing samples was shown to be a promiswindow-ing approach, but it resulted in no performance benefit in practice. Subsequently, a SCGA based on an en-hanced local search was introduced and found to produce more efficient designs within the same number of fabrications when compared with the original SCGA approaches. Finally, alternative coevolution collaboration schemes were examined, finding an ini-tial performance increase resulting from more accurate fitness assignments but with no significant improvement thereafter. This highlights that while much can be learned by developing optimisation algorithms using simulated problems and mining data, significant differences in performance are often found when applying the results to the real application. Thus, whilst general learning algorithms provide a starting point for exploration, there is no escape from further development directly in the problem application.
The use of 3D printing to physically instantiate candidate designs completely avoids the use of 3D computer simulations, with their associated processing costs and mod-elling assumptions. In this case, 3D CFD analysis was avoided, but the approach is equally applicable to other real-world optimisation problems, for example, those re-quiring computational structural dynamics or computational electromagnetics simula-tions. We anticipate that in the future such design mining approaches will yield unusual yet highly efficient designs that exploit characteristics of the environment or materials that are difficult to capture formally or in simulation. This has the potential to place knowledge discovery at the core of engineering design, particularly within an iterative framework such as in agile approaches.
Although the print resolution used here to build the prototypes was set at the printer default, the resolution can be adjusted to provide coarser designs at a faster rate for preliminary studies (e.g., for early evolutionary candidates), or slower, higher-resolution prints for more subtle optimisation. Further, only PLA plastic was used here to fabricate designs, but other materials such as flexible rubbers or multimaterial designs can be constructed and explored by an EA. Thus 3D printing offers a range of ways to customise the evolutionary instantiation to the design task. Multiple 3D printers can also easily be used to perform parallel fabrication to speed up the process.
more flexible designs including variable number of blades, for example, supershapes (Preen and Bull, 2014b); and the production of 1:1 scale designs.
The issue of scalability remains an important future area of research. When the scale of designs is increased, the changes in dimensionality will greatly affect performance; however, it remains to be seen how performance will change in the presence of other significant factors such as turbine wake interactions in the case of arrays. One potential solution is to simply use larger 3D printing and wind tunnel capabilities whereby larger designs could be produced by the same method. On the opposite end of the spectrum, micro wind turbines that are 2 mm in diameter or smaller can be used to generate power, such as for wireless sensors (Howey et al., 2011), and in this case more precise 3D printers would be required. Moreover, wind turbines can find useful applications on any scale. For instance, a feasibility study (Park et al., 2012) for powering wireless sensors on cable-stayed bridges examined turbines with a rotor diameter of 138 mm in wind conditions with an average of 4.4 m/s (similar to the artificial wind conditions used in this article).
If the recent speed and material advances in rapid-prototyping continues, along with the current advancement of evolutionary design, it will soon be feasible to perform a wide array of automated complex engineering optimisationin situ, whether on the microscale (e.g., drug design), or the macroscale (e.g., wind turbine design). That is, instead of using mass manufactured designs, EAs will be used to identify bespoke solutions that are manufactured to compensate and exploit the specific characteristics of the environment in which they are deployed, for example, local wind conditions, nearby obstacles, and local acoustic and visual requirements for wind turbines.
Acknowledgments
This work was supported by the UK Leverhulme Trust under Grant RPG-2013-344.
References
Anderson, J. D. (1995). Computational fluid dynamics: The basics with applications. New York: McGraw-Hill.
Aristidis, V., Maria, P., and Christos, L. (2010). Particle swarm optimization (PSO) algorithm for wind farm optimal design.International Journal of Management Science and Engineering Management, 5(1): 53–58.
Axelrod, R. (1987). The evolution of strategies in the iterated prisoner’s dilemma. In L. Davis (Ed.),Genetic algorithms and simulated annealing, pp. 32–42. London: Pitman.
Barthelmie, R. J., Larsen, G. C., Frandsen, S. T., Folkerts, L., Rados, K., Pryor, S. C., Lange, B., and Schepers, G. (2006). Comparison of wake model simulations with offshore wind turbine wake profiles measured by sodar.Atmospheric and Oceanic Technology, 23:888–901.
Bartz-Beielstein, T. (2006).Experimental research in evolutionary computation: The new experimental-ism. Berlin: Springer.
Bischl, B., Mersmann, O., Trautmann, H., and Weihs, C. (2012). Resampling methods for meta-model validation with recommendations for evolutionary computation.Evolutionary Com-putation, 20(2): 249–275.
Boria, F., Stanford, B., Bowman, S., and Ifju, P. (2009). Evolutionary optimization of a morphing wing with wind-tunnel hardware in the loop.AIAA Journal, 47(2): 399–409.
Bull, L. (1997b). Model-based evolutionary computing: A neural network and genetic algorithm architecture. InProceedings of the IEEE International Conference on Evolutionary Computation, pp. 611–616.
Bull, L. (1999). On model-based evolutionary computation.Soft Computing, 3(2): 76–82.
Bull, L., and Fogarty, T. (1993). Coevolving communicating classifier systems for tracking. In
Artificial Neural Nets and Genetic Algorithms: Proceedings, pp. 522–527.
Carrigan, T. J., Dennis, B. H., Han, Z. X., and Wang, B. P. (2012). Aerodynamic shape optimiza-tion of a vertical-axis wind turbine using differential evoluoptimiza-tion. ISRN Renewable Energy, 2012:528418.
Chamorro, L. P., Tobin, N., Arndt, R.E.A., and Sotiropoulos, F. (2014). Variable-sized wind turbines are a possibility for wind farm optimization.Wind Energy, 17(10): 1483–1494.
Charwat, A. F. (1978). Performance of counter- and corotating arrays of Savonius turbines.Journal of Energy, 2:61–63.
Cohen, D. L., Lipton, J. I., Bonassar, L. J., and Lipson, H. (2010). Additive manufacturing forin siturepair of osteochondral defects.Biofabrication, 2(3): 035004.
Dabiri, J. O. (2011). Potential order-of-magnitude enhancement of wind farm power density via counter-rotating vertical-axis wind turbine arrays.Journal of Renewable and Sustainable Energy, 3(4): 043104.
Darrieus, G. J. M. (1931). Turbine having its rotating shaft transverse to the flow of the current. US Patent 1 835 018, December 8.
Dunham, B., Fridshal, R., and North, J. H. (1963). Design by natural selection. Synthese, 15(2): 254–259.
Eberhart, R. C. (1992). The role of genetic algorithms in neural network query-based learning and explanation facilities. InProceedings of the International Workshop on Combinations of Genetic Algorithms and Neural Networks (COGANN ’92), pp. 169–183.
Eriksson, S., Bernhoff, H., and Leijon, M. (2008). Evaluation of different turbine concepts for wind power.Renewable and Sustainable Energy Reviews, 12(5): 1419–1434.
Ero ˘glu, Y., and Sec¸kiner, S. U. (2012). Design of wind farm layout using ant colony algorithm.
Renewable Energy, 44:53–62.
Forrester, A. I., and Keane, A. J. (2009). Recent advances in surrogate-based optimization.Progress in Aerospace Sciences, 45(1-3): 50–79.
Goh, C. K., Lim, D., Ma, L., Ong, Y. S., and Dutta, P. S. (2011). A surrogate-assisted memetic co-evolutionary algorithm for expensive constrained optimization problems. InProceedings of the IEEE Congress on Evolutionary Computation (CEC 2011), pp. 744–749.
Hampsey, M. (2002).Multiobjective evolutionary optimisation of small wind turbine blades. Unpub-lished doctoral dissertation, Department of Mechanical Engineering, University of Newcas-tle, Callaghan, NSW, Australia.
Hao, L., Seaman, O., Mellor, S., Henderson, J., Sewell, N., and Sloan, M. (2009). Extrusion behavior of chocolate for additive layer manufacturing. In Innovative Developments in Design and Manufacturing: Advanced Research in Virtual and Rapid Prototyping, Proceedings, pp. 245–250.
Harding, S. L., and Miller, J. F. (2004). Evolutionin materio: Initial experiments with liquid crystal. InProceedings of the NASA/DoD Workshop on Evolvable Hardware, pp. 289–299.
Herdy, M. (1996). Evolution strategies with subjective selection. InProceedings of Parallel Problem Solving from Nature (PPSN IV), pp. 22–26.
Hillis, W. D. (1991). Co-evolving parasites improves simulated optimisation as an optimisation procedure. InArtificial Life II, pp. 313–324.
Hornby, G. S., Lohn, J. D., and Linden, D. S. (2011). Computer-automated evolution of an X-band antenna for NASA’s space technology 5 mission.Evolutionary Computation, 19(1): 1–23.
Howey, D. A., Bansal, A., and Holmes, A. S. (2011). Design and performance of a centimetre-scale shrouded wind turbine for energy harvesting.Smart Materials and Structures, 20(8): 085021.
Husbands, P., and Mill, F. (1991). Simulated coevolution as the mechanism for emergent planning and scheduling. InProceedings of the Fourth International Conference on Genetic Algorithms, pp. 264–270.
H ¨usken, M., Jin, Y., and Sendhoff, B. (2005). Structure optimization of neural networks for evolu-tionary design optimization.Soft Computing, 9(1): 21–28.
Jakab, K., Norotte, C., Damon, B., Marga, F., Neagu, A., Besch-Williford, C. L., Kachurin, A., Church, K. H., Park, H., Mironov, V., Markwald, R., Vunjak-Novakovic, G., and Forgacs, G. (2008). Tissue engineering by self-assembly of cells printed into topologically defined structures.Tissue Engineering Part A, 14(3): 413–421.
Jin, Y. (2005). A comprehensive survey of fitness approximation in evolutionary computation.
Soft Computing, 9(1): 3–12.
Jin, Y. (2011). Surrogate-assisted evolutionary computation: Recent advances and future chal-lenges.Swarm and Evolutionary Computation, 1:61–70.
Kim, H. S., and Cho, S. B. (2001). An efficient genetic algorithm with less fitness evaluation by clustering. InProceedings of the IEEE Congress on Evolutionary Computation (CEC 2001), pp. 887–894.
Kinzel, M., Mulligan, Q., and Dabiri, J. O. (2012). Energy exchange in an array of vertical-axis wind turbines.Journal of Turbulence, 13(38): 1–13.
Koza, J. (1991). Genetic evolution and coevolution of computer programs. InArtificial Life II, pp. 603–630.
Kusiak, A., and Song, Z. (2010). Design of wind farm layout for maximum wind energy capture.
Renewable Energy, 35:685–694.
Ladd, C., So, J.-H., Muth, J., and Dickey, M. D. (2013). 3D printing of free standing liquid metal microstructures.Advanced Materials, 25(36): 5081–5085.
Le, M. N., Ong, Y. S., Menzel, S., Jin, Y., and Sendhoff, B. (2013). Evolution by adapting surrogates.
Evolutionary Computation, 21(2): 313–340.
Leigh, S. J., Bradley, R. J., Purssell, C. P., Billson, D. R., and Hutchins, D. A. (2012). A simple, low-cost conductive composite material for 3D printing of electronic sensors.PLoS ONE, 7(11): e49365.
Lipson, H., and Pollack, J. (2000). Automatic design and manufacture of robotic lifeforms.Nature, 406(6799): 974–978.
Lipton, J. I., Arnold, D., Nigl, F., Lopez, N., Cohen, D. L., Noren, N., and Lipson, H. (2010). Multi-material food printing with complex internal structure suitable for conventional post-processing. InProceedings of 21st Solid Freeform Fabrication Symposium (SFF ’10), pp. 809–815.
Ly, D. L., and Lipson, H. (2014). Optimal experiment design for coevolutionary active learning.
Marmidis, G., Lazarou, S., and Pyrgioti, E. (2008). Optimal placement of wind turbines in a wind park using Monte Carlo simulation.Renewable Energy, 33:1455–1460.
Miller, J. F., and Downing, K. (2002). Evolutionin materio: Looking beyond the silicon box. In
Proceedings of the NASA/DoD Workshop on Evolvable Hardware, pp. 167–176.
Miller, J. S., Stevens, K. R., Yang, M. T., Baker, B. M., Nguyen, D.-H. T., Cohen, D. M., Toro, E., Chen, A. A., Galie, P. A., Yu, X., Chaturvedi, R., Bhatia, S. N., and Chen, C. S. (2012). Rapid casting of patterned vascular networks for perfusable engineered three-dimensional tissues.
Nature Materials, 11:768–774.
Mosetti, G., Poloni, C., and Diviacco, B. (1994). Optimization of wind turbine positioning in large wind farms by means of a genetic algorithm.Journal of Wind Engineering and Industrial Aerodynamics, 51(1): 105–116.
Nolfi, S. (1992). Evolving non-trivial behaviours on real-robots: A garbage collecting robot.
Robotics and Autonomous Systems, 22:187–198.
Ong, Y. S., Keane, A. J., and Nair, P. B. (2002). Surrogate-assisted coevolutionary search. In
Proceedings of the 9th International Conference on Neural Information Processing (ICONIP ’02), pp. 1140–1145.
Ong, Y. S., Nair, P. B., and Lum, K. Y. (2006). Max-min surrogate-assisted evolutionary algorithm for robust design.IEEE Transactions on Evolutionary Computation, 10(4): 392–404.
Paredis, J. (1994). Steps towards coevolutionary classification neural networks. InArtificial Life IV, pp. 102–108.
Park, J.-W., Jung, H.-J., Jo, H., and Spencer , B. F. (2012). Feasibility study of micro-wind turbines for powering wireless sensors on a cable-stayed bridge.Energies, 5:3450–3464.
Potter, M. A., and De Jong, K. A. (1994). A cooperative coevolutionary approach to function optimization. InProceedings of Parallel Problem Solving from Nature (PPSN III), pp. 249–257.
Preen, R. J., and Bull, L. (2014a). Towards the coevolution of novel vertical-axis wind turbines.
IEEE Transactions on Evolutionary Computation. doi:10.1109/TEVC.2014.2316199.
Preen, R. J., and Bull, L. (2014b). Towards the evolution of vertical-axis wind turbines using supershapes.Evolutionary Intelligence, 7(3): 155–187.
Ratle, A. (2001). Kriging as a surrogate fitness landscape in evolutionary optimization.Artificial Intelligence for Engineering Design, Analysis and Manufacturing, 15(1): 37–49.
Rechenberg, I. (1971).Evolutionsstrategie: Optimierung technischer systeme nach prinzipien der biolo-gischen evolution. Unpublished doctoral dissertation, Technical University of Berlin.
REN21 (2013).Renewables 2013 Global Status Report. Paris: REN21 Secretariat.
Rieffel, J., and Sayles, D. (2010). EvoFAB: A fully embodied evolutionary fabricator. InEvolvable Systems: From Biology to Hardware, Proceedings of the 9th International Conference, pp. 372–380.
Rosenblatt, F. (1962). Principles of neurodynamics: Perceptrons and the theory of brain mechanisms. Washington, DC: Spartan Books.
Salcedo-Sanz, S., Saavedra-Moreno, B., Paniagua-Tineo, A., and Portilla-Figueras, A. (2011). A review of recent evolutionary computation-based techniques in wind turbines layout opti-mization problems.Central European Journal of Computer Science, 1(1): 101–107.
Savonius, S. J. (1930). Wind rotor. US Patent 1 766 765, June 24.
Symes, M. D., Kitson, P. J., Yan, J., Richmond, C. J., Cooper, G. J. T., Bowman, R. W., Vilbrandt, T., and Cronin, L. (2012). Integrated 3D-printed reactionware for chemical synthesis and analysis.Nature Chemistry, 4:349–354.
Theis, M., Gazzola, G., Forlin, M., Poli, I., Hanczyc, M., and Bedau, M. (2006). Optimal formu-lation of complex chemical systems with a genetic algorithm. InProceedings of the European Conference on Complex Systems (ECCS ’06), p. 50.
Thompson, A. (1998). Hardware evolution: Automatic design of electronic circuits in reconfigurable hardware by artificial evolution. Berlin: Springer.
Toja-Silva, F., Colmenar-Santos, A., and Castro-Gil, M. (2013). Urban wind energy exploitation systems: Behaviour under multidirectional flow conditions.Renewable and Sustainable Energy Reviews, 24:364–378.
Ulmer, H., Streichert, F., and Zell, A. (2004). Evolution strategies with controlled model assistance. InProceedings of the IEEE Congress on Evolutionary Computation (CEC 2004), pp. 1569–1576.
Viana, F.A.C., Simpson, T. W., Balabanov, V., and Toropov, V. (2014). Metamodelling in multidis-ciplinary design optimization: How far have we really come?AIAA Journal, 52(4):670–690.
Wang, S., and Takagi, H. (2005). Improving the performance of predicting users’ subjective eval-uation characteristics to reduce their fatigue in IEC.Journal of Physiological Anthropology and Applied Human Science, 24:81–85.
Whittlesey, R. W., Liska, S., and Dabiri, J. O. (2010). Fish schooling as a basis for vertical axis wind turbine farm design.Bioinspiration and Biomimetics, 5(3): 035005.
Wiegand, R. P., Liles, W. C., and De Jong, K. A. (2001). An empirical analysis of collaboration meth-ods in cooperative coevolutionary algorithms. InProceedings of the Genetic and Evolutionary Computation Conference (GECCO ’01), pp. 1235–1242.
Xu, T., Binder, K. W., Albanna, M. Z., Dice, D., Zhoa, W., Yoo, J. J., and Atala, A. (2013). Hybrid printing of mechanically and biologically improved constructs for cartilage tissue engineer-ing applications.Biofabrication, 5(1): 015001.
![Figure 2: Translation of x-y-axis genome [5, 8, 2, 4]. (a) The voxels are enabled from thefirst allele (5) to the baseline (bottom)](https://thumb-us.123doks.com/thumbv2/123dok_us/612743.561657/7.504.122.385.75.259/figure-translation-genome-voxels-enabled-therst-allele-baseline.webp)