Biomorpher: Interactive Evolution for Parametric Design
John Harding and Cecilie Brandt-Olsen
Abstract
Combining graph-based parametric design with metaheuristic solvers has to date focussed solely on performance based criteria and solving clearly defined objectives. In this paper, we outline a new method for combining a parametric modelling environment with an interactive Cluster-Orientated Genetic Algorithm (COGA). In addition to performance criteria, evolutionary design exploration can be guided through choice alone, with user motivation that cannot be easily defined. As well as numeric parameters forming a genotype, the evolution of whole parametric definitions is discussed through the use of genetic programming. Visualisation techniques that enable mixing small populations for interactive evolution with large populations for performance-based optimisation are discussed, with examples from both academia and industry showing a wide range of applications.
1. Introduction
In the forward to John Frazer seminal book, An Evolutionary Architecture [1], the cyberneticist Gordon Pask states that “the role of the architect here is not so much to design a building or a city as to catalyse them; to act that they may evolve.” Now over twenty years on, one could argue that the impact of evolutionary approaches within architecture has been relatively minimal despite their potential. Handing the process of design, even a part of it, over to the machine seems to run counter to the control a designer usually craves, with many impressive academic developments rarely making it into real projects.
One may therefore ask why, especially in the context of technological progression within this time? It could be argued that the reasons are twofold. Firstly, the ‘problem’ of architectural design can rarely be stated with explicit objective functions, and therefore open to be ‘optimised’ in the traditional sense. As Menges [2] puts it, evaluation criteria and design objectives often co-evolve with the development of a project, with Rowe [3] defining architecture as a prime example of a ‘wicked’ problem too complex to be formally defined against metrics alone. Secondly, metaheuristic algorithms (such as evolutionary solvers) that enable wide design exploration have until recent years, required the specialist to master both the technical skill of computer programming and the complexity of architectural design.
As the popularity of visual programming continues to rise, the latter of these two issues is becoming increasingly eroded, opening computational design to the
architectural design should be adaptable, mediated and guided. As Derix asks with regards an evolutionary architecture [5], “how can a designer better interfere with computational heuristics and understand the search struggle, offering the opportunity for identification between designers’ analogue and computational heuristics?”
2. Background
Parametric modelling software for visually constructing algorithms is now becoming commonplace, opening up computational methods to a much broader audience. A form of dataflow programming, visual programs define the development of form through a series of associated explicit functions, commonly taking the form of a Directed Acyclic Graph (DAG). The structure of the DAG describes a mapping of number to geometry, setting out a possible design space to be explored when parameters are adjusted [6].
A combination of parametric modelling and performance analysis tools allow for designs to be evaluated both quantitatively and qualitatively in real-time when adjusting parameters [7]. Again, this process is now well-known, with many third-party analysis plug-ins, including environmental [8] and structural analysis [9] for example, being developed for visual programming tools such as Rhino Grasshopper and Autodesk Dynamo.
2.1. A flexible shape grammar
A parametric definition (or schema) defines the development of form explicitly as well as providing a cognitive artifact for the design team to interact with. Parametric modelling therefore shifts focus on final form to the development of form through a sequential process. As Oxman states [10, p243]: “In digital design significant processes that have frequently been represented as non-explicit in traditional design models must now be considered explicit”.
Nodes in the graph (or components) can essentially encapsulate, grammar-based rules that can be repeated, manipulated and copied from project to project. Such
components essentially act like shape grammars [11] that are either pre-compiled or open to customisable imperative code, able to be combined within the overall dataflow
schema. Parametric models therefore provide a valuable cognitive artifact for design teams working at the level of computational process, enabling algorithmic routines to be integrated at various hierarchies of scale, in-between specialisms and traditional design stages [12].
2.2. Metaheuristics in parametric design
Although a DAG-based parametric modelling software is based on dataflow
NLopt open-source library [15], and ‘Octopus’ [4] for multi-objective optimisation using the Strength Pareto Evolutionary Algorithm (SPEA2) within Rhino Grasshopper.
The latter approach introduces user interaction in controlling the weighting between objectives at each generation – with objective functions dictating a non-dominated set of candidate solutions. Whilst allowing user input, such approaches still emphasise performance criteria according to definable metrics, somewhat different to interactive evolution whereby in theory, no definable performance criteria need exist.
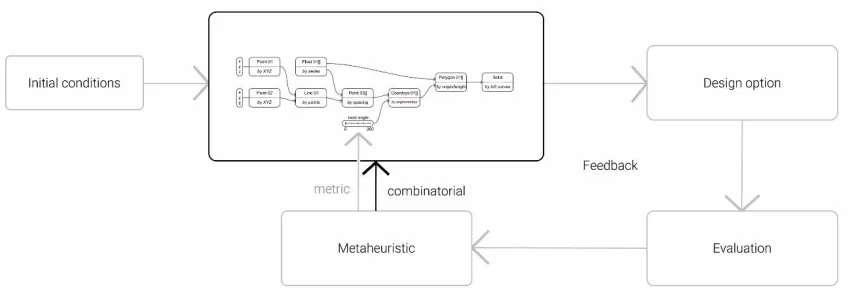
[image:3.612.94.520.239.386.2]Indeed, at the early design stage defining explicit metrics too early can often lead to constraining the problem before it is known, “inducing a false sense of having optimized a design which may be fundamentally ill-conceived” [1, p.18].
Figure 1. Metaheuristic algorithm operating on metric parameters and/or the whole definition.
2.3. Interactive evolution
Outside of methods integrated with parametric design environments, interactive evolutionary computation (IEC) has been researched for over thirty years. Whereas metaheuristic search algorithms commonly use an objective function to evaluate designs at each generation, artificial, or ‘interactive’ selection replaces this with selection by human participant(s) who need not make their motivations explicit and/or constant, perhaps changing during the evolutionary process itself.
Broadly speaking, there are two forms of IEC: the first where the user changes the weightings between known objectives as part of a multi-objective search, the second where the user has input to the selection of the designs to go through at each generation [16]. The former requires multiple objective functions be constructed with selection taking place from a Pareto optimal non-dominated set [17-19], whereas the latter requires no such objectives and is the main focus of this research.
interested in computation since, such as the work of Latham and Todd [21] and more recent applications such as exploring fashion designs [22], the evolution of 2D images [23] and 3D forms by combining with Compositional Pattern Producing Networks, so-called CPPN-NEAT [24, 25]. A thorough historical record is given by Steadman [26].
The two most commonly used evolutionary algorithms are Evolutionary Strategies and Genetic Algorithms, both suited to discontinuous, noisy or ill-defined objective functions. For genetic algorithms, manipulation using crossover and mutation occurs at the level of the genotype, and with selection based on the resulting phenotype. As selection occurs by the human designer(s), interface design becomes a crucial part of any interactive approach.
Methods to display populations need to be legible and allow designs to be displayed to enable the quality of the solution to be assessed in some way. Whereas target-based evolutionary computation favours relatively large populations, this can overwhelm the human user and hence smaller populations are often used for interactive evolution – or else the population reduced in size at each generation to prevent user fatigue. A thorough review of selection methods is given by Shackelford and Simons [27], including the so-called Cluster-Orientated Genetic Algorithm (COGA), first developed by Bonham and Parmee [28].
2.4. Interactive evolution in architecture
In architectural design, interactive evolution was pioneered by Frazer [1] and Coates et al. [29] using genetic programming with Lindenmayer systems, with the latter combining both interactive and performance-based selection methods, albeit not as part of the same evolutionary run. More recently, Piasecki & Hanna [30] used an interactive genetic algorithm to counter the paradox of choice at the early design stage, and Mor et al. [31] have used interactive evolution to explore a Biomimetic Space installation.
Despite these applications, until recently the development of a generic tool for a parametric environment has not been specifically developed for wider general use. To the authors’ knowledge, a sole example exists that enables interactive evolution within Grasshopper, developed by the Digital Structures Group at MIT [32]. Known as ‘Stormcloud’, this tool has been recently made available to the community at a similar time to the work discussed here, however it is geared mainly to the evolution of structures in its phenotype display, and does not include mixed-mode evolutionary search using a cluster-oriented approach.
3. Biomorpher
applications. Such adjustments need not be limited to parameters only, with topological adjustments to the graph available to the designer following design evolution.
3.1. Process Overview
Biomorpher allows for any parametric definition constructed in Grasshopper to be explored using an IGA. Figure 2 shows a typical simple setup before evolution:
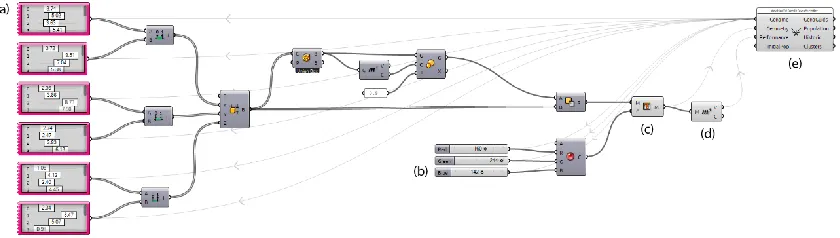
Parameter sets (a & b) are combined to produce mesh geometry (c), with a simple volume measure taken (d). These are then connected to the Biomorpher component before
[image:5.612.98.518.245.364.2]evolution begins by launching the graphical user interface. One should note that performance measures are optional (see Section 3.4. for how these are used).
Figure 2. Typical implementation within Rhino Grasshopper.
At present, all parameters, even integers, are encoded into normalised real number (double precision) format between 0.0 and 1.0, thus forming a genotype for each design. Once Biomorpher is launched, the user may select a population size, single point
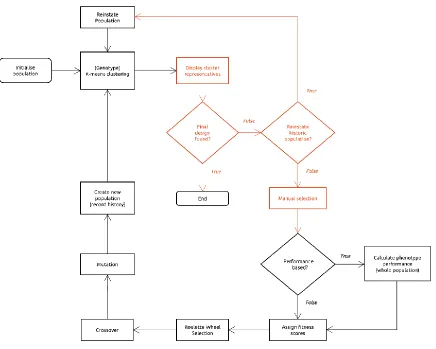
Figure 3: Overview of process, with human interaction stages highlighted.
3.2. Developmental mapping
[image:6.612.91.527.73.422.2]The mapping between genotype and phenotype has an important effect on the nature of the evolution. For example (figure 4), if a numeric slider control the radius of a sphere, then mapping is direct (a). However, if the same parameter is used instead as a random seed which then controls the radius of a sphere, then the mapping is highly indirect and discontinuous (b) – i.e. a small change in the genotype can lead to an unpredictable change in the phenotype.
Figure 4. An extra component makes a large difference in terms of genotype-phenotype mapping
likely [33]. As Coates et al. state [29, p339], “the development and improvement of the artificial embryogeny is crucial”, with most parametric models assumed to have at least some direct relationship between altering a parameter and altering form, a so-called ‘developmental’ genotype-phenotype mapping. In simple examples using Biomorpher, model parameters are encoded to real numbers, however it is possible to encode entire parametric definitions themselves and hence evolve them. This is discussed further in Section 4.6.
3.3. Population display
Biomorpher thus begins by either generating a new population of genes, using an existing set from a previous evolutionary run, or finally by copying the current parameter state across the whole population. This latter option followed beta-testing of the tool, where it was found that most users will incorporate Biomorpher to look for alternatives from an existing state.
As selection could be either performance based or manual at each generation, a conflict on population size must be addressed. Large populations are useful for
performance-based optimisation and relatively small populations for interactive selection. As Shackleford and Simons state [27, p1431], “naively presenting each individual in a large population at each generation causes evaluation fatigue and a subsequent non-linearity of user focus making search trajectory inconsistent and ineffective”.
A compromise is therefore to maintain a large population, but represent the whole space of possible designs by clustering similar outputs. Methods to incorporate Cluster-Orientated Genetic Algorithms (COGAs), were first outlined by Bonham and Parmee using solution space measures [28]. Due to the likelihood of a relatively direct genotype-phenotype mapping, parameter (genotype) space clustering was chosen for Biomorpher, using k-means, with ‘k-means++’ seeding to help better guarantee a suitable result [34]. A similar method was used by Stasiuk et al. [35] for design exploration of funicular vaults. In future, a choice to enable clustering of the phenotypes could be implemented, however the measures on which this is based could be difficult to judge, especially if the phenotypes have no performance measures displayed.
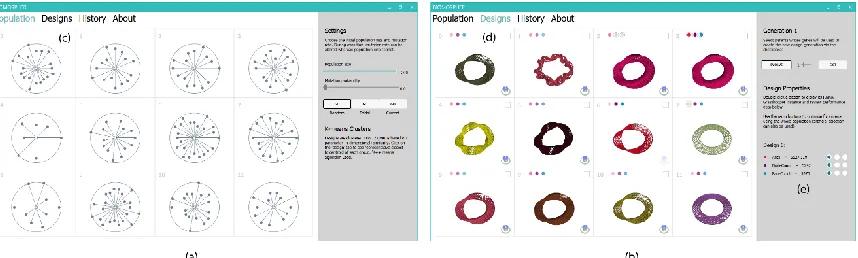
Figure 5. Biomorpher GUI: (a) clustering of 200 designs, (b) phenotype closest to centroid.
Figure 5 shows how a population of 200 designs is reduced to just 12 clusters, with a representative (closest to the cluster centroid in parameter space) displayed (c). Each design (d) has a checkbox for selection, a 3d orientable display aside from the main Grasshopper display, and a colour coded bar indicating the relative score of each
(optional) performance measure. The colours are designed to give the user more information that may influence the choices made at each generation, or ‘nudge’ users without enforcing a particular objective function as with traditional optimisation. If performance ‘optimisation’ is to be included however, then an option to maximise or minimise each is available (e). It is therefore possible to have selection made by both human and machine at each generation.
3.4. Mixed-mode selection
Depending on both human selection and performance based criteria, at each generation a fitness score is assigned to each phenotype from 0.0 to 1.0. These are then used for roulette wheel (fitness proportionate) selection [36], although in future tournament-based selection may be implemented. The process at each generation is as follows:
1. Reset all fitness scores to zero.
2. If a manual selection is made, set the fitness score for all designs in that cluster to 1.0. If no performance-based criteria are specified, skip to roulette-wheel.
3. If one performance-based criteria is specified, then normalise performance values for the whole population based on minimum and maximum values, and assign this as the fitness. Note that if a performance value is to minimised, set fitness to 1-x. If the fitness for any design is already 1.0 (due to manual selection) then do nothing.
4. If two or more performance-based criteria are used, then normalise values and take the weighted sum with equal weighting between criteria.
careful consideration must be taken as this may bias any selection procedure towards those measures that can be defined by metrics to the detriment of qualitative aspects influencing manual selection. Maintaining that one could in theory evolve something that is poorly performing for all performance-based objectives (i.e. nowhere near a Pareto front), simply because it subjectively feels right, was considered important to the authors.
3.5. Evolution history
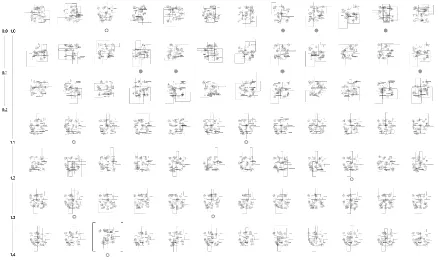
[image:9.612.92.516.307.571.2]Biomorpher records the evolution history and displays this to the user, including optional performance data. As the solution space could be completely unknown when initialising a search, there is potential to steer evolution towards undesirable paths – indeed, this is inevitable for any wide design exploration. With this in mind, some way to return to previous generations and begin a new search branch becomes important. Figure 6 shows how each population (in this simple example for exploring a textured Möbius band) is displayed at each generation, with an option to reinstate previous populations to begin a new search.
Figure 6. Search tree example. Each new search is formed from a previous population.
4. Application
many different types of application. Examples set out in sections 4.1 and 4.2 are work solely by the authors, examples 4.3 and 4.4 the result of workshops, and examples 4.5 and 4.6 are real-world projects. The final example investigates the evolution of
parametric definitions themselves using a ‘Meta-Parametric’ encoding, more suited to the earlier design stage.
4.1. Layout ‘optimisation’
Automating floor plan layouts has a long history in architectural computing, however these have mostly focus on ascribing specific functions to spaces and/or specifying target-based goals [37]. Whilst valuable, these studies can turn design into a series of logical steps with pre-defined semantics that often run counter to the complexity of how designers work in practice. One must strive to be fast and flexible when constructing rule sets that may or may not have semantic meaning, or else derive meaning inductively through their application, not a priori. This again highlights the benefits of basing
interactive evolution within a parametric modelling environment at the early design stage.
In this test, a simple arrangement of lines, non-descript rectangles and soft landscaping features inspired by the work of architect Junya Ishigami were constructed parametrically in order to quickly generate plan compositions. The model was controlled by 156 parameters, in this case directly mapping to either the 2D location of points or rectangular widths and heights, giving rise to a combinatorially rich design space.
Figure 7. Evolution of Junya Ishigami inspired compositions with final design highlighted.
Figure 8. Refining the evolutionary result manually using the parametric model.
4.2. Henry Moore sculptures
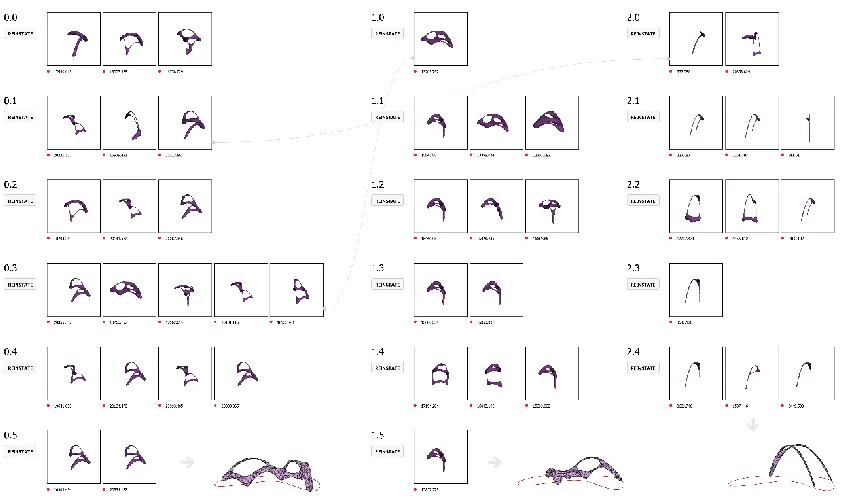
Combing the IGA within a parametric design software means other plug-ins and add-ons can be used as part of the modelling process. In this example, a combination of Kangaroo Physics [39] and marching cubes were combined to generate fleshed funicular sculptures inspired by the artist Henry Moore. A surface area measurement was taken to give a rough estimate of relative material cost.
The parametric setup consisted of a series of five points situated around a perimeter curve are connected by lines, replaced with springs and form-found into
[image:11.612.93.352.384.519.2]mapping in this example was ‘developmental’, between direct and indirect which helped during evolution – i.e. a small mutation could sometimes give rise to a large phenotypic change, but only rarely. An example evolutionary history is given in Figure 9, with three outputs from separate evolutionary branches shown.
Figure 9. Evolving Henry Moore Sculptures by combining with Kangaroo 2 Physics.
4.3. CoOptimise workshop
As well as the various modelling benefits from situating Biomorpher within Grasshopper, analysis plug-ins such as Karamba3D structural analysis tool [9] can be easily integrated. This was investigated during the ‘CoOptimise’ student workshop at the 35th annual eCAADe conference 2017, run by Mariam Khademi and Kristjan Nielsen. The resulting in at structural layout following evolution was driven by both subjective and
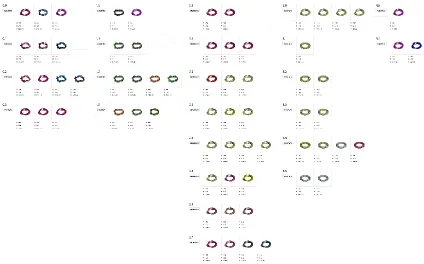
performance-based criteria using the selection method outlined in Section 3.4. Figure 10 shows a screenshot from an initial set of designs, showing relative performance of each shown by the strength of the coloured circles (a) and indicated numerically for a
highlighted design (b).
Feedback from the workshop indicated that participants struggled with the intractability between generations. For example, if manually selecting a cluster centroid, it was not guaranteed to be in the next generation due to the nature of fitness
proportionate selection. Incorporating elitism in the selection process could counter this in future. In addition, it was found that starting with an initial random population caused problems with intractability, leading to the authors to add a facility to copy the current parameter state to the first generation following this workshop. In addition, the
addition to the display) within Grasshopper, thus allowing any past parameter states to be recalled and calculated from historic data.
Figure 10. Screenshot taken from the ‘CoOptimise’ workshop, eCAADe conference, Rome, 2017.
4.4. CITA workshop
In October 2017, 26 Masters level students took part in a week long workshop at the Centre for Information Technology and Architecture (CITA), Copenhagen. During the workshop, participants investigated steering the growth of plants using Vascular Morphogenesis Controllers (VMCs) [40], with an agent based model simulated within Grasshopper, and resultant forms explored using Biomorpher. Growth of the plants was non-deterministic, with several possible outcomes of a similar nature displayed as the phenotype to the user, rather than a single design.
It was found that the interactive method helped explore a wide design space by automating multiple parameters associated with the VMCs during evolution, rather than participants individually adjusting single parameter states. Detailed information on the workshop is given by Heinrich et al. [41].
4.5. Pollen sculptures
Working alongside Format Engineers and the artist Lee Simmons in the UK, various potential configurations of a private artwork in London were explored using Biomorpher. The sculptures consist of stainless steel ellipsoids depicting pollen grains, welded
bending moment in the structures was desirable, hence funicular shapes working predominantly in axial tension were proposed.
A method for generating potential geometries similar to Simmons’ physical model experiments was constructed within Grasshopper, using a combination of parametrically defined points, subsequent Voronoi patterns, form-finding methods and meshing
techniques. Again, the genotype-phenotype mapping was developmental rather than direct, which helped with adding variety to the design exploration.
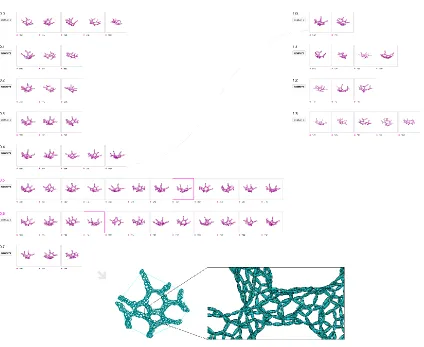
Rather than act as an explicit constraint, the ‘pollen grain’ count was imported as a performance measure, guiding the design search by minimising for one or two
generations should the sculptures become too large. Here, the mixed-mode selection method proved useful, as indicated in generations 0.5 and 0.6 of the example (Figure 11).
[image:14.612.96.520.349.696.2]This passage of performance-based evolution acted as negative feedback for the search, with the average ‘pollen-grain count’ of the population brought back to a sensible level without requiring a restart, with desirable individual members of the population still being retained. It was found that whilst running the computational model gave rise to a varied design search, however assessing phenotypes ideally required physical models be constructed. In future, ease of exporting for 3d printing could be incorporated, although in reality the practical time for manufacture would have to be considered.
4.6. Meta-Parametric example
So far the examples given have involved adjusting parameters in a static parametric definition. Although in theory an infinite amount of designs can often be generated by a parametric system, they are bounded by the topological structure of the graph. As Aish and Woodbury [6] state: “nothing can be created in a parametric system for which a designer has not explicitly externalised... this runs counter to the often-deliberate cultivation of ambiguity that appears to be part of the healthy design process.”
In response, a previous paper by the first author [42] highlighted a possible
method of widening the design search by evolving whole parametric definitions
themselves, treating Grasshopper components as easily interchangeable shape-grammar rules, similar to the visual approach set out by Strobbe et al. [43]. By opening up the search to topological changes, the search space becomes broader than the examples given in Sections 4.1 to 4.5, at the cost of problem ideation being harder to define. Grammar rules become combinatorial, suited to a wider design space often required at the early design stage. Despite promising results, difficulties arose in not being able to compare phenotypes associatively, thus requiring integration with Biomorpher.
4.6.1. Encoding
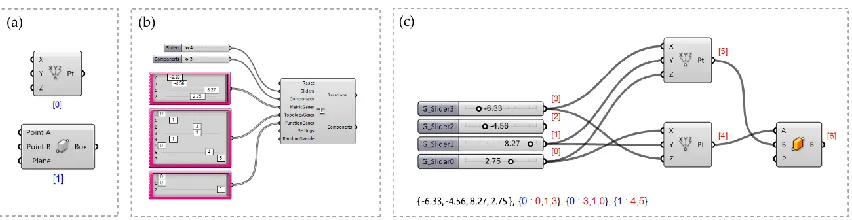
Harding and Shepherd [44] describe a method of encoding a parametric model within a single numeric list, opening the topology of a parametric model itself for evolution. Encoding the model is similar to that used in Cartesian Genetic Programming (CGP) [45], which has been shown to be suitable for evolutionary methods due to its
developmental mapping from genotype to phenotype. Such ‘Meta-Parametric’ methods have recently been investigated Joyce and Ibrahim [46] for the combinatorial search of parametric models.
The genome consists of three parts: External parameters (for example numeric sliders, external geometry, etc.), the pool of components in the graph (nodes) and the topological structure that forms associations between components (edges). These three categories form the basis of the genotype used by a separate Grasshopper plug-in called ‘Embryo’ when constructing a parametric model:
1. Metric genes (double): control the parameter values for generated sliders and have a direct numerical mapping. These can be either integer or floating point values. These metric parameters are the first things generated by Embryo.
2. Function genes (integer): when a component is added to the graph, the function genes controls the type of component is selected from the pool.
3. Topological genes (integer): map the output location for each component input when forming the graph. Altering these genes changes the topology of the graph.
as the model is constructed. More details on the method can be found in Harding and Shepherd [44].
Figure 12. Encoding a parametric definition into a real number list
As an explicit embryogeny is used, the genotype is mapped directly onto the topological structure of the graph, as opposed to an implicit method with low-level rules. This leads to a closer mapping between the genotype and phenotype than with an implicit embryogeny, assisting with evolvability [47]. The numeric parameters that encode the graph now form the genotype used by Biomorpher. Judgement during evolution is now involves two forms of phenotypic representation: the generated design and the graph itself (i.e. the user may wish to retain legibility). Maintaining this engagement enables the evolved models to be further developed manually following evolution.
4.6.2. Application
Figure 13. Two residential blocks (a, b) and circulation link bridge (c).
Parametric definitions generated contained 9 numeric parameters and 16 components, with massing designs evolved according to qualitative judgment and quantitative measures. Performance criteria indicating total number of apartments and proportion with adequate access to daylight were included, helping to nudge the
Figure 14. Massing study evolution with initial (a) and final (b) parametric definitions.
The resulting massing studies and parametric definitions were once again simple to manipulate manually following evolution, as the complexity of the graphs was kept relatively simple – indeed graph complexity became part of the evaluation itself.
Increasing the component number decreases legibility to the user. With this in mind, a shape grammar that included iteration or recursion, without requiring a component be used multiple times in the same graph would help to increase legibility and reduce the genotype size. As opposed to the earlier study without Biomorpher [42], associative evaluation of phenotypes was possible without iterating through each possibility thus enabling a more fluid experience during evolution.
One of the issues identified during the study was that the cluster centroids did not fully represent the nature of the population as a whole. For example, if in a total
lie within any of the defined high performance regions”. This lead to the most useful setup being a population of just twelve designs (one per cluster) being used in favour of enabling any performance based optimisation benefitting from a large population. Potential methods to counter this issue are discussed in Section 5.1.
4.7. Discussion
The examples given are aimed to highlight the versatility of the tool for parametric design, rather than focus on one particular application. The ability to display multiple models in parallel enhances the Grasshopper user environment and necessary for assessing phenotypes. Some limitations during these tests were highlighted and addressed, such as establishing a predefined initial population. Others require further research: for example, it was found that despite selecting a design, it may get replaced in the next generation due to fitness proportionate selection. Here, incorporating elitism perhaps only for those designs explicitly selected (i.e. cluster centroids) would seem to be a possible step forward and will be discussed further in Section 5.1.
Biomorpher can be used at a variety of design stages, from exploring existing parametric models in new ways, to exploring early stage massing concepts. In the final example, the use of Biomorpher in combination with a meta-parametric approach enabled a wider combinatorial design space to be explored, albeit with a constraint on the
complexity of the graph for future legibility.
5. Conclusion
The purpose of this paper is to highlight the benefits of using interactive evolution (including optional performance optimisation) within a parametric design environment. The authors have developed the software Biomorpher, a plug-in for Rhino Grasshopper that allows the non-expert to engage in such evolutionary methods within an environment that already boasts many modelling and analysis native tools and third-party plug-ins.
Two types of examples have been shown, for parameter-based exploration and exploration of parametric definitions themselves using a ‘meta-parametric’ approach
better suited to the early design stage. It was found that the IGA works effectively for a wide range of situations with graph-based parametric definitions, due to their often developmental mapping between genotype and phenotype and their flexibility of use; before, during and after evolution.
5.1. Outlook
Incorporating multi-objective methods with interactive selection could be explored, whilst noting the dangers of preferencing measurable objectives as discussed in Section 3.4. At present an equal weighted-sum approach is used. As identified in Section 4.6.2, COGAs tended to give equal weighting to a single
design if it was unique rather than adequately bias many similar designs. An associative method of dimensionality reduction of the parameter space would be a possible solution to this, as opposed to discrete cluster methods. Self-organising maps, implemented for example by Amor and Rettinger [48] for IGAs, and Principal Component Analysis as used by Talton et al. [49] in displaying large populations of tree designs are possible alternatives. These methods could also be used to select a large group of designs for high fitness, rather than the current ‘checkbox’ approach.
As noted in the examples in Section 4, in order to address the issue with lost designs even after selection, implementing elitism, either at the cluster level or individual designs, may be beneficial.
Investigate clustering of phenotypes based on notional performance, in addition to parameter space. As noted, one must be careful not to overemphasise quantitative metrics over qualitative measures with this approach.
Include recursive structures in the generation of parametric definitions to reduce the genotype size.
Crossover causes a larger than expected disruption when used in combination with generating parametric definitions. This was likely due to the CGP method of encoding and using mutation alone may be more suitable approach in future in line with other CGP applications [50].
As mentioned in Section 4.5, incorporating physical models in the selection process as an alternative form of representation. As 3d printing is likely to be too slow, a form of augmented reality may be a viable compromise.
As a final thought, by locating an IGA within a parametric design environment, models and rules can be easily interchanged to create novel and interesting evolutionary processes that include a variety of disciplines. However, one must acknowledge that there will always be limitations to an entirely computer based approach to architectural design, especially if enacted using 2D interfaces [51]. Manual selection must be informed by the experience of the architect with influence from mixed modes of representation, such as physical models, collage, sketches, etc. Rather than reduce design to a systematic process, parametric design methods that encompass a wider approach to architectural representation appear to be the next step going forward.
Acknowledgement
The authors would like to thank those that have helped shape Biomorpher from 2016 to present: Professor Larry Bull (UWE), Mary-Katherine Heinrich (CITA), Stephen Melville (Format Engineers), Kristjan Nielsen, Mariam Khademi, Lee Simmons,
References
1. Frazer J. An evolutionary architecture, Architectural Association Publications, 1995, p.7.
2. Menges, Achim. Biomimetic design processes in architecture: morphogenetic and evolutionary computational design. In: Bioinspiration and biomimetics 2012; 7(1): 4.
3. Rowe PG. Design thinking. The MIT Press, 1991.
4. Vierlinger R and Bollinger K. Accommodating change in parametric design, In: Proceedings of ACADIA, 2014 pp. 609-618.
5. Derix C. Mediating spatial phenomena through computational heuristics. In:
Proceedings of the 30th Annual Conference of the Association for Computer Aided
Design in Architecture, ACADIA, New York, 2010, pp.61-66.
6. Aish R and Woodbury R. Multi-level interaction in parametric design. In:
International symposium on smart graphics, 2005 Aug 22, pp. 151-162. Springer,
Berlin, Heidelberg.
7. Shea K, Aish R and Gourtovaia M. Towards integrated performance-driven generative
design tools. Automation in Construction 2005; 14(2): 253-264.
8. Sadeghipour RM and Pak M. Ladybug: a parametric environmental plugin for grasshopper to help designers create an environmentally-conscious design. In: Proceedings of the 13th International IBPSA Conference, Lyon, France, 30 Aug
2013.
10. Oxman R. Theory and design in the first digital age. Design Studies 2006; 27(3): 229-265.
11. Stiny G and Gips J. Shape Grammars and the Generative Specification of Painting and Sculpture. In: IFIP Congress 1971; 2(3).
12. Derix C. In-between architecture computation. International journal of architectural computing 2009; 7(4): 565-85.
13. Rutten D. Galapagos: On the logic and limitations of generic solvers, Architectural Design 2013; 83(2): 132-135.
14. Floery S. Goat, http://www.rechenraum.com/goat/ (2016, accessed February 2018).
15. Johnson SG. The NLopt nonlinear-optimization package, http://ab-initio.mit.edu/nlopt (2008, accessed February 2018).
16. Parmee I. Towards Interactive Evolutionary Search and Exploration Systems. In: Bird-of-a-feather workshop: Genetic and Evolutionary Conference, 2002. New
York.
17. Fonseca CM and Fleming PJ. Genetic algorithms for multiobjective optimization: Formulation, discussion and generalization. ICGA, 1993 Jun 1; 93: 416-423.
18. Caldas LG and Norford LK. Shape generation using pareto genetic algorithms: integrating conflicting design objectives in low-energy architecture. International journal of architectural computing 2003; 1(4): 503-15.
19. Reinhard K. Urban Design Synthesis for Building Layouts based on Evolutionary Many-Criteria Optimization. International Journal of Architectural Computing 2015; 13(3): 257-269.
21. Latham W and Todd S. Evolutionary Art and Computers. Academic Press, 1992.
22. Cho SB. Towards creative evolutionary systems with interactive genetic algorithm. Applied Intelligence 2002 Mar 1; 16(2):129-138.
23. Secretan J, Beato N, D Ambrosio DB, Rodriguez A, Campbell A and Stanley KO. Picbreeder: evolving pictures collaboratively online. In: Proceedings of the SIGCHI Conference on Human Factors in Computing Systems, 2008 Apr 6, pp. 1759-1768.
ACM.
24. Stanley KO and Miikkulainen R. Evolving neural networks through augmenting
topologies. Evolutionary computation 2002; 10(2): 99-127.
25. Clune J and Lipson H. Evolving 3d objects with a generative encoding inspired by developmental biology. ACM SIGEVOlution 2011 Nov 1; 5(4): 2-12. ACM.
26. Steadman P. The Evolution of Designs: Biological analogy in architecture and the applied arts. Routledge, 2008.
27. Shackelford M and Simons CL. Metaheuristic design pattern: Interactive solution presentation. In: Proceedings of the Companion Publication of the 2014 Annual Conference on Genetic and Evolutionary Computation, 2014 Jul 12, pp.1431-1434.
ACM.
28. Bonham CR and Parmee IC. An investigation of exploration and exploitation within cluster oriented genetic algorithms (COGAs). In: Proceedings of the 1st Annual Conference on Genetic and Evolutionary Computation - Volume 2, 1999 Jul 13, pp.
1491-1497. Morgan Kaufmann Publishers Inc.
29. Coates P, Broughton T and Jackson H. Exploring three-dimensional design worlds using Lindenmayer systems and genetic programming. In: Bentley PJ (ed)
Evolutionary design by computers. San Francisco: Morgan Kaufmann, 1999,
30. Piasecki M and Hanna S. A Redefinition of the Paradox of Choice. In: Gero JS (ed) 2011, Design Computing and Cognition 2010. Springer, 2011, pp.347-366.
31. Mor L, Liu C and Von Mammen S. Interactive biomimetic space: an interactive installation to explore living architecture. In: European Conference on the
Applications of Evolutionary Computation, Berlin: Springer, 2011 Apr 27, pp.
364-373.
32. Danhaive R and Mueller C. Combining parametric modeling and interactive
optimization for high-performance and creative structural design. In: Proceedings of the International Association for Shell and Spatial Structures (IASS) Symposium
2015.
33. Bentley P and Kumar S. Three ways to grow designs: A comparison of embryogenies for an evolutionary design problem. In: Proceedings of the 1st Annual Conference on Genetic and Evolutionary Computation – Volume 1, 1999 Jul 13, pp. 35-43. Morgan
Kaufmann Publishers Inc.
34. Arthur D and Vassilvitskii S. K-means++: The advantages of careful seeding. In: Proceedings of the eighteenth annual ACM-SIAM symposium on discrete algorithms,
2007 Jan 7, pp. 1027-1035. Society for Industrial and Applied Mathematics.
35. Stasiuk D, Thomsen MR, Thompson EM. Learning to be a vault - implementing learning strategies for design exploration in inter-scalar systems. In: Proceedings of the 2014 eCAADe conference, Newcastle upon Tyne, England, 2014, pp.381-390.
36. Goldberg. 1989. Genetic Algorithms in Search, Optimization and Machine Learning. 1st ed. Boston: Addison-Wesley Longman Publishing Co.
37. Michalek J and Papalambros P. Interactive design optimization of architectural layouts. In: Engineering optimization 2002 Jan 1; 34(5): 485-501.
39. Piker D. Kangaroo: form finding with computational physics. Architectural Design 2013; 83: 136-137.
40. Zahadat P, Hofstadler, DN and Schmickl T. Vascular morphogenesis controller: a generative model for developing morphology of artificial structures. In: Proceedings of GECCO Conference, 2017, pp.163–170. ACM.
41. Heinrich MK, Zahadat P, Harding J, Ayres P, Nicholas P, et al. Using Interactive Evolution to Design Behaviors for Non-deterministic Self-organized Construction.
In: Proceedings of the Symposium on Simulation for Architecture and Urban Design (SimAUD), 2018, forthcoming.
42. Harding J. Evolving Parametric Models using Genetic Programming with Artificial Selection. In: Proceedings of the 34th eCAADe Conference, Oulu, Finland, 2016, pp.423-432.
43. Strobbe T, Pauwels P, Verstraeten R, De Meyer R and Van Campenhout J. Toward a visual approach in the exploration of shape grammars. AI EDAM 2015; 29(4): 503-21.
44. Harding J and Shepherd P. Meta-parametric design. Design Studies 2017; 52: 73-95.
45. Miller J and Harding S. Cartesian genetic programming. In: Proceedings of the 2008 GECCO conference companion on Genetic and evolutionary computation, 2008, pp.
2701-2726.
46. Joyce S and Ibrahim N. Exploring the evolution of meta-parametric models. In: Proceedings of ACADIA Conference, 2017, pp.308-317.
48. Amor HB and Rettinger A. Intelligent exploration for genetic algorithms: using self-organizing maps in evolutionary computation. In: Proceedings of the 7th annual conference on genetic and evolutionary computation, 2005 Jun 25, pp. 1531-1538.
ACM.
49. Talton J, Gibson D, Hanrahan P and Koltun V. Collaborative mapping of a parametric design space. Technical report 2008.
50. Clegg J, Walker JA and Miller JF. A new crossover technique for cartesian genetic
programming. In: Proceedings of the 9th annual conference on Genetic and evolutionary computation, 2007 Jul 7, pp.1580-1587. ACM.