Using DEWIS and R for multi-staged
statistics e-Assessments
D. Rhys Gwynllyw∗†, Iain S. Weir† and Karen L. Henderson† †Department of Engineering Design and Mathematics, University of the West of England,
Bristol, BS16 1QY, United Kingdom
∗Email: [email protected]
We demonstrate how the DEWIS e-Assessment system may use embedded R code to facilitate the assessment of students’ ability to perform involved statistical anal-yses. The R code has been written to emulate SPSS output and thus the statistical results for each bespoke data set can be generated efficiently and accurately using standard R routines. This enables students’ answers, generated from their appli-cation of SPSS, to be marked and appropriate feedback supplied back to them by DEWIS. Staging is used between different parts of the e-Assessment to replicate the natural stages of a complete statistical analysis. This allows students the free-dom to work away from DEWIS; they may view the relevant stage an unlimited number of times prior to submitting their answers for that stage. The technical challenges of setting up the e-Assessment in this way are discussed as well as the rationale for adopting this pioneering approach.
1
Introduction
DEWIS is a fully algorithmic open-source e-Assessment system which was designed and developed at the University of the West of England (UWE). It is a completely stand-alone web based system used for both summative and formative assessments (Gwynllyw and Henderson, 2009; DEWIS Development Team, 2012). It was primarily designed for numerate e-Assessments and is currently used in the fields of Business, Computer Science, Nursing, Engineering and Mathematics. This algorithmic approach enables the separate solution, marking and feedback algorithms to respond dynamically to a student’s input and as such can perform intelligent marking (Gwynllyw and Henderson, 2012). SCORM packages, used as an access authorisation mechanism, enable DEWIS e-Assessments to be accessed directly from standard virtual learning environments (VLEs), such as Blackboard and Moodle. The DEWIS system is data-lossless, that is, all data about every assessment attempt is stored on the server’s assessment database. The data analysis software embedded into DEWIS enables the academic’s detailed tracking and analysis of assessment perfor-mance, either through that of a specific student or of a cohort of students (Walker, Gwynllyw and Henderson, 2015). In addition, student enquiries about their own performance in an assessment can be effectively dealt with due to the academic’s access to the extensive data. Not only is the data used to monitor an assessment’s progress as it is active but it is also used to evaluate the assessment’s efficacy after the assessment’s conclusion. Implemented for the first time in 2007 the system is now well-established and in 2014/15 within UWE and partner institutions, DEWIS was used for formative and summative tests in more than 50 modules, involving over 100 e-Assessments for approximately 3,000 students.
describe the development of an online test to measure students’ conceptual understanding of im-portant ideas. This online test comprised multiple choice questions (MCQs) selected at random from a database of items of assessment created through the ARTIST project (Garfield, 2006). Hodgson and Pang (2012) also used MCQs for weekly formative tests in statistics to encourage student learning and engagement. Blanco and Ginovart (2010) set up moodle quizzes to assess statistical topics in engineering. Their approach involved presenting the student with random stand alone questions from question banks covering a variety of topics. However, there has been little progress on using e-Assessment to test the ability to perform a complete statistical analy-ses on randomly created data. Taking into account technology use by students when developing e-Assessment is an important consideration in this aim (Joliffe, 1997; Callingham, 2011).
What we shall demonstrate in this paper is a pioneering approach of an e-Assessment that re-quires students to carry out an involved statistical analysis using the statistical package SPSS (IBM Corporation, 2010). This approach was motivated by the need to efficiently teach and assess 750 second year Business School students taking a short course on statistics. The course covers a challenging amount of material, together with learning to use SPSS, and is designed to provide a solid foundation for students to undertake Level 3 project work. Baglin and Da Costa (2012) identified that developing students’ competence with statistical packages is an important outcome of statistics education; the approach we outline allows the efficient assessment of this to a large cohort.
Many technical challenges were needed to be overcome in setting up this e-Assessment. One such challenge was to enable DEWIS to generate random bespoke data sets with desired statis-tical properties and to mark students’ analyses of these data sets precisely against the output generated through using SPSS commands. To overcome this challenge R (R Core Team, 2014) code was embedded within DEWIS. The employment of R code is a natural choice as it is a free software environment for statistical computing that has become well-established and is trusted by statisticians. Through coding that utilises many standard R routines it is possible to ensure that suitable bespoke data sets are supplied to the students and that statistical results for each can be generated efficiently and accurately. This enables DEWIS to mark students answers and supply them with appropriate feedback.
Another feature of the e-Assessment described in this paper is the use of staging between different parts of the e-Assessment in order, for example, to ensure that students have uploaded and manipulated the data in a correct way in the SPSS package before being allowed to progress to further analysis.
2
Methodology
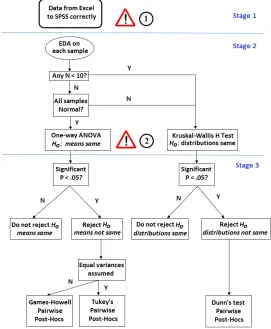
We shall illustrate these features and the rationale behind them by considering one of the e-Assessments that was used for the first time in the 2013/14 academic year to assess over 750 second year UWE Business school students. The e-Assessment concerns the data dependent choice of the application of either the one-way ANOVA or Kruskal-Wallis test on a data set that comprises the run lives of three brands of batteries. The business scenario relates to the testing for a significant difference in the mean runlives of each of three brands with the aim of identifying whether there is clearly a brand that has the longest mean runlife.
format (Warning 1) or being incorrect in their selection of test to be performed (Warning 2). The presence of these danger points provided the motivation and impetus to introduce staging into the e-Assessment, in particular to split the assessment into three stages, as shown in Figure 1. The rationale being that if a student was not able to load the data correctly into SPSS then none of their further analysis would be correct. Similarly, if the incorrect parametric or nonparamet-ric test was selected then the analysis of their data using this incorrect test would be worthless. DEWIS automatically keeps track of how each student is progressing through the e-Assessment and presents the student with the relevant stage when they log into the e-Assessment.
Figure 1: Illustration of the flow of the analysis that need to be performed on each data set. Note that the warning signs indicate potential danger points, which prompted the e-Assessment to be split into stages.
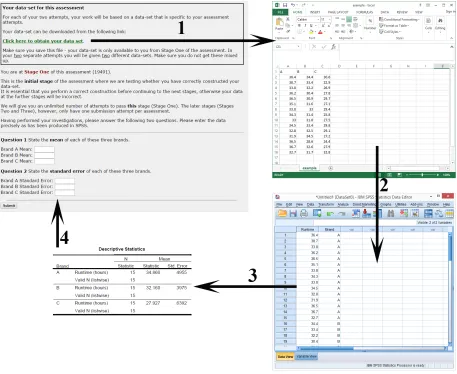
report to. DEWIS marks to the accuracy of this upper bound which avoids issues of prompts for answer to a set number of decimal places. The students are required to enter the means and their standard errors for each of the three samples; this check guarantees the data transfer to SPSS is successful.
[image:4.612.77.534.251.625.2]Note that each student was given two attempts at this e-Assessment. Students were given their own bespoke data set to work on, for each assessment attempt. Note that students did not have a time limit to submit, apart from the final deadline date, so students were able to download their data directly into Excel, perform the necessary operation in SPSS before re-logging back into DEWIS to submit. This first stage was worth 7 marks, out of a total of 100 marks for the whole assessment, but students were not permitted to progress to the second stage until they had mastered this stage. That is, students had unlimited submission attempts within the assessment period up to a satisfactory submission at Stage 1.
Figure 2: The activity process flow of Stage 1 of the e-Assessment.
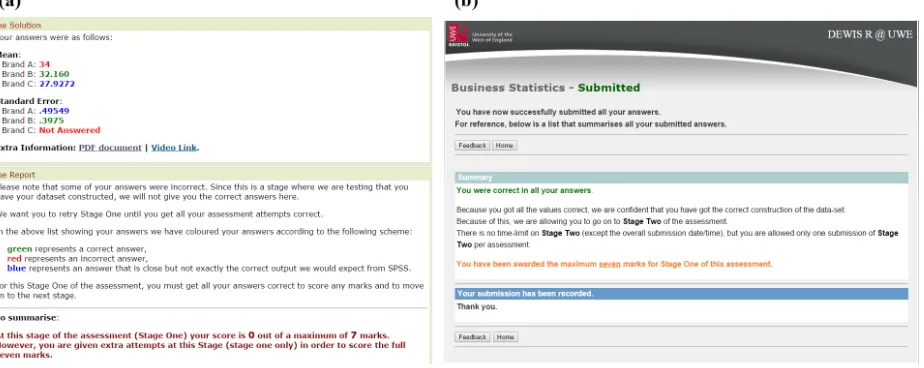
until this has been successfully answered. Instead they have to review their answers and try again, with the same data set, until they are successful, which they may do as many times as necessary. The correct answers are deliberately not given to the student here, as it is important that students successfully pass this stage independently to give confidence that they have constructed the data set in the correct format within SPSS and the colour coding response is aimed to help them achieve this. From the feedback page, students also have access to Extra Information which takes the form of a pdf document and video link which gives step by step instructions on how to achieve these tasks for a general data set. Figure 3(b) shows the feedback screen for a student who has successfully completed Stage 1. When they next log into DEWIS they will be presented with Stage 2.
Figure 3: Screenshots from two different Stage 1 submissions; (a) not all answers correct; (b) successful completion.
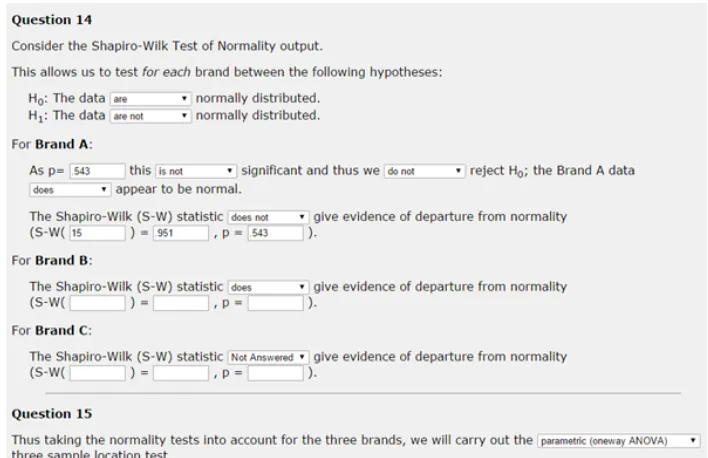
Once students have passed the Stage 1 check, they are instructed to save the SPSS file and work solely with this file for the next two stages. This is because it means they should be getting right answers numerically and to the expected number of decimal places which are those that are output when the data is correctly read in and set up. Stage 2 involves EDA using output from the SPSS Explore command; this is where students get to know their data set through simple summary statistics and to consider the assumption of normality that the one-way ANOVA test requires. There are a total of 67 entries which are required for this stage, which take the form of numeric entry and drop down questions. A realisation of the final two questions asked in this stage is shown in Figure 4. Students are only allowed to submit this stage once, but using the continuation feature on DEWIS, they may shut down their browser, without submitting their answers, and return to this stage at a later date if required. At the end of this stage students are asked which test should be employed for the main analysis, either parametric (one-way ANOVA) or nonparametric (Kruskal-Wallis). If a student chooses the wrong test they are told so in the feedback that DEWIS gives them and they are directed to Stage 3, in which they will be required to continue using the output from the correct test. This ensures that each student performs the correct test on their bespoke data set, despite possible earlier errors in analysis.
Figure 4: A snapshot of the last two questions asked in Stage 2 of the e-Assessment concerning normality tests and subsequent choice of main analysis test. Note that some numeric answers have been entered and drop down entries selected for illustration purposes.
answer in the previous question which may have been incorrect. One of the challenges in designing the questions in this section was to make the effort required consistent between the two possible tests, that is a total of 26 entries were required in each case. This issue can be seen partly from looking at the work flow diagram for Stage 3 in Figure 1 where it can be seen the test for equal variances is only relevant on the parametric test pathway. As for Stage 2, students were only allowed one submission at this stage.
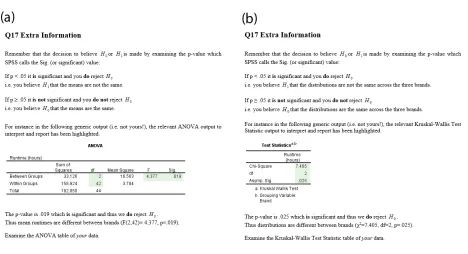
Feedback for Stages 2 and 3 is full and bespoke to the data set that the student worked with. Their submission is reproduced in its entirety, with the colour coding previously seen in Figure 3(a), as well as the correct answers being supplied. This is an important feature because Greenhow and Gill (2008) found that students learn from e-Assessment feedback, using it to perfect their technical knowledge. In addition, for each part question, students were able to access a video of how to create the SPSS output and an Extra Information pdf document that interprets the output of a generic data set for the same problem they are analysing. In Figure 6 the Extra Information is shown for Question 17; the student is automatically directed to the one that is relevant to the test they are applying. This approach embeds immediate bite-sized formative materials within the e-Assessment at the point where the student is most curious and open to learning some aspect they have yet to master.
Throughout Stages 2 and 3 the marking of each element was performed using the following marking scheme:
• Numeric entry: Correct [1 mark]; Incorrect or not answered [0 marks]
Figure 5: A snapshot of the first three questions asked in Stage 3 of the e-Assessment for the case when the data is suitable for a one-way ANOVA test. The question of the need for Post-Hoc tests has the drop down menu options illustrated.
3
Analysis of Results
The results over the two academic years have been excellent and remarkably similar (2013/14:
M = 89.0, SD = 19.30; 2014/15: M = 89.1, SD = 19.16). Analysing the marks using a Kolmogorov-Smirnov test indicated that there is no significant difference in the distribution of marks between the two years (K-S =.763,N1= 699, N2= 753, p=.605), so subsequent reported statistics will be on the aggregated data.
Figure 6: Extra Information feedback for Question 17 from Figure 5 for when student has data that is; (a) one-way ANOVA; (b) Kruskal-Wallis.
Next we investigate the need for the final stage by analysing the percentage of students who made the incorrect choice of test at the end of Stage 2 and thus have benefited from DEWIS correcting their choice. There was a significant higher percentage of incorrect choices for Kruskal-Wallis data (38.4%) than ANOVA data (6.9%), Fishers Exact Test, p < .001. The reason that students have found the Kruskal-Wallis test harder to detect may be attributed to the teaching schedule which places more emphasis on ANOVA, for example students covered an ANOVA test example first in the computer lab practicals and would only have looked at the subsequent Kruskal-Wallis test example if time permitted. This apparent discrepancy is something we may address in future years by, for instance, making sure students complete some bite-sized formative DEWIS Assessments to specifically fully learn the required skills before attempting the summative e-Assessment. In any case, it is inevitable that some students will always make wrong test choices, and thus we feel that this stage check is a highly desirable feature in involved statistical analysis e-Assessments.
All students were given the opportunity to have a second attempt at the e-Assessment with a different dataset. The final assessment mark was the higher of the two attempts. Only 482 students made use of this second attempt. A paired-samples t-test indicated that the marks were significantly higher for the second attempt (M = 92.5,SD= 9.69) than first attempt (M = 79.3,
SD= 21.90), t(481) = 14.81,p < .001. This uplift of an average 13.3 marks (95% CI: 11.5-15.0) demonstrates that the e-Assessment was formative as well as being summative. On submission of Stages 2 and 3 students had access to a wealth of feedback and it appears that this has had a positive effect.
4
Technical challenges
This e-Assessment necessitated the introduction of some new features not previously available in DEWIS as well as the implementation of existing features not typically used in a standard e-Assessment. The ability of DEWIS to communicate with R was a major aspect of new development. It was decided that the R code specific to this assessment would be embedded into the DEWIS question format under an ‘external R code’ tag as opposed to directly installing the R code onto the Linux server. This meant that alterations to the R code were as straightforward to do as alterations to the supporting DEWIS code, via a web interface editing facility.
The two assessment attempts were partitioned, with a separate link to each being provided to the students via the virtual learning environment (VLE). This is not the standard way we deal with multiple assessment attempts, but setting it up this way simplified the issue of how to deal with the different number of submission attempts allowed for each stage. DEWIS allows different assessments within the same module to share information so the question source code was written to ensure that students were presented with a different data set for their second attempt. In order to control the number of submissions allowed within each stage of an attempt the assessment parameters were set to allow unlimited attempts and it was the question source code which managed the specific assessment protocol. This had the advantage, as in the R code, that none of the DEWIS system code had to be altered specifically for this assessment. The question code has access to a student’s performance history in the assessment and adapts the presentation of the assessment to the student appropriately. So each time a student logged into an assessment they were either presented with the set of questions relevant to the stage they are currently at, or to their past submission history if they have completed the e-Assessment.
In order that students were not confused as to their current score and what more they needed to do in an assessment, the reporting format for DEWIS was altered slightly. For example, reporting a mark of 100% for successful completion of Stage 1 may potentially have misled a student to think that they had achieved their assessment goal and thus had no need to continue. Instead this was reported as ‘Stage 1 [7/7]’ and a hyperlink from the reporter’s summary linked to a more detailed analysis of the student’s submitted attempts. Here the student’s feedback would be available and would contain a ‘running total’ percentage of their score with clear explanation as to the meaning of such a total.
Issues such as follow-on marking within assessments with a large amount of question inputs and negative marks for incorrect selection of multiple-choice questions have been addressed in the past in DEWIS and provided no additional taxation.
From a statistical point of view the challenges were threefold:
• emulating SPSS output;
• identifying and programming a set of analysis decision rules to mark to;
• generating random data that will allow students to experience each decision rule pathway. It was a natural choice to employ R coding to generate answers, due to the availability of routines to perform most of the statistical tasks required. Different computer packages output variants of some statistics, say for example the calculation of quantiles. The R function has nine different methods available for quantiles and the default is not that which SPSS uses. Thus some care was needed to check both SPSS and R documentation to guarantee concordance between student answers and DEWIS marking. Some bespoke functions were required to be programmed when R did not have a standard routine available that matched SPSS; for example the way that SPSS reports skewness and kurtosis coefficients and their standard errors. Fortunately in such cases SPSS documentation is extensive in supplying the formulae they employ.
to simplify things and to employ ‘rules of thumb’ say for not trusting the parametric approach with ‘small’ sample sizes. We decided upon those in Figure 1 and it was necessary that all members of our teaching team stick to this script as these are the rules that DEWIS marks to.
Our decision rules result in five analysis experience pathways that relate to data being para-metric or nonparapara-metric, significant or not and upon choice of post-hoc test. Our code creates random data sets of varying sample sizes that visit each pathway with pre-set probabilities that reflect our desires of overall student experience; for instance we weight experience to favour signif-icant ANOVA data sets. We used R routines for normal and log-normal simulation to create our parametric and nonparametric data.
5
Conclusions and Discussion
We have shown how using staging and embedding R code into DEWIS has enabled us to produce a sophisticated e-Assessment to efficiently test students ability to perform a range of statistical tests using the SPSS statistical package. This pioneering approach was used for the first time in the 2013/14 academic year and further statistical e-Assessments have since been developed. DEWIS is an open-source system which is freely available under a GPL licence. Assessments are constructed as server-based programs which run on a web server. The construction of each DEWIS assessment includes a SCORM package which is used as an access authorisation mechanism. This enables any DEWIS assessment to be accessed directly from a standard VLE, such as Blackboard or Moodle. The need to be able to choose, perform and interpret the results from appropriate statistical tests is ubiquitous in many STEM disciplines and beyond. Whilst there is a lot of good Mathe-matics material in the public domain there are less targeted resources available for the training of students to identify and perform appropriate statistical analyses. With this in mind we have created several bite-sized e-Assessments, using the principles described in this paper, which are freely available via the Statstutor site (Statstutor team, 2010).
The ability of DEWIS to communicate with other packages has been exploited in several other ways. For example, computer science assessments have been constructed and used to assess com-puting skills in both C and Java. In such cases the students submit source code which is compiled and executed (subject to passing security checks) by DEWIS and tested against randomised in-put sets. For mathematical questions which require algebraic expressions as inin-puts, the standard marking protocol follows an evaluated sample approach. In cases whereby more sophisticated alge-braic manipulation is required in the marking, DEWIS employs Python as its Computer Algebra System.
Rhys Gwynllyw is currently a University Teaching and Learning Fellow and a Senior Lecturer in Mathematics in the Department of Engineering Design and Mathematics at the University of the West of England, Bristol, United Kingdom.
Iain Weiris currently a University Teaching and Learning Associate Fellow and Senior Lecturer in Statistics in the Department of Engineering Design and Mathematics at the University of the West of England, Bristol, United Kingdom.
References
Baglin, J. and Da Costa, C. (2012). A theoretical framework for developing statistical package com-petence as an outcome of statistical literacy, Proceedings of the International Association of Statistics Education (IASE)2012 Roundtable Conference: Technology in Statistics Education: Virtualities and Realities.
Blanco, M. and Ginovart, M. (2010). Moodle quizzes for assessing statistical topics in engineering studies,Proceedings of the Joint International IGIP - SEFI Annual Conference.
Callingham, R. (2011). Assessing statistical understanding in middle schools: Emerging issues in technology-rich environment, Technology Innovations in Statistics Education5(1).
Delmas, R., Garfield, J., Ooms, A. and Chance, B. (2007). Assessing students’ coneptual under-standing after a first course in statistics, Statistics Education Research Journal 6(2): 28–58.
DEWIS Development Team (2012). Dewis welcome page. Accessed: 4th February, 2015. URL:http://www.cems.uwe.ac.uk/dewis
Garfield, J. (2006). ARTIST web site. Accessed: 10th October, 2015. URL:https://apps3.cehd.umn.edu/artist/
Greenhow, M. and Gill, M. (2008). How effective is feedback in computer-aided assessments?, Learning, Media and Technology33(3): 207–220.
Gwynllyw, R. and Henderson, K. (2009). DEWIS: a computer aided assessment system for math-ematics and statistics,CETL-MSOR 2008 Conference Proceedings, pp. 38–44.
Gwynllyw, R. and Henderson, K. (2012). Intelligent marking in summative e-assessments, Pro-ceedings of the HEA STEM Learning and Teaching Conference.
Hodgson, P. and Pang, M. Y. C. (2012). Effective formative e-assessment of student learning: a study on a statistics course,Assessment & Evaluation in Higher Education 37(2): 215–225.
IBM Corporation (2010). IBM SPSS Statistics 19.
URL:http://www-01.ibm.com/software/analytics/spss/
Joliffe, F. (1997). Issues in constructing instruments, in I. Gal and J. B. Garfield (eds), The as-sessment challenge in statistics education, Amsterdam: IOS Press & International Statistical Institute, pp. 191–204.
R Core Team (2014). R: A Language and Environment for Statistical Computing, R Foundation for Statistical Computing, Vienna, Austria.
URL:http://www.R-project.org/
Sangwin, C. (2013). Computer Aided Assessment of Mathematics, Oxford University Press.
Statstutor team (2010). Statstutor. URL:http://www.statsutor.ac.uk