Property Rights Institutions and Bank Performance
Across Countries
Walaa Wahid ElKelish
College of Business Administration, University of Sharjah, Sharjah, United Arab Emirates
Jon Tucker
Centre for Global Finance, University of the West of England, Bristol, United Kingdom
Structured Abstract:
Purpose – This paper investigates the relationship between the quality of property rights
institutions (PRIs) and bank financial performance in an empirical study of 136 countries over the period 1999 to 2006.
Design/methodology/approach – The quality of property rights institutions (PRIs) and financial
accounting based measures of bank performance are obtained from the Economic Freedom of the World Project (Gwartney et al., 2006), the Polity IV Project, the World Bank data indicators database and the International Monetary Fund. Several multiple regression analyses are conducted to test the study hypotheses.
Findings – Our results reveal that the quality of legal structure and security of property rights institutions positively (negatively) affects both bank cost efficiency (inefficiency) and profitability. The presence of a quality political structure negatively (positively) affects bank cost efficiency (inefficiency). The quality of political structure has no direct impact on bank profitability. The impact of PRIs on bank cost efficiency is more evident in the upper middle and high income group of countries than in the low and lower middle income group of countries. An appropriate level of PRI quality is essential to achieve both competition and development.
Practical implications – The paper highlights policy implications for international policy
makers, regulators and the management of banks who are interested in banking sector development across countries.
Originality/value – The study investigates the fundamental importance of PRI quality in its
effect on the banking sector and extends the largely US-focused literature to a broader international setting.
Keywords Property rights institutions, Banking industry, Banking, Cost efficiency, Profitability
Paper type Research paper
Introduction
The banking industry plays a central role in the international allocation of financial resources and
economic growth (Rajan and Zingales, 1998). Previous studies highlight the influence of the
quality of property rights institutions such as the legal structure and the extent of investor
protection, the degree of market development, access to external finance (La Porta et al., 1997, 1998), financial transparency (Bushman et al., 2004) and firm valuation (La Porta et al., 2002). More recently, Gwartney et al. (2006) find that countries with quality PRIs enjoy faster economic growth through their enhanced ability to attract private investment. These studies are
built largely on the institutional theories which highlight the importance of quality institutions in
financial and economic development (North, 1981).
A number of authors assess the impact of bank specific characteristics and macroeconomic
indicators on firm performance, though the evidence on the strength and direction of the
relationships concerned is somewhat mixed (Berger and Humphery, 1997; Ben Naceur and
Omran, 2011; Olson and Zoubi, 2011). Other empirical studies focus on the influence of some
form of PRI quality on access to external capital (Rajan and Zingales, 1998), firm valuation and
earnings quality (La Porta et al., 2002a; Leuz et al., 2003), firm growth (Beck et al., 2005), operating cost savings (Ben Naceur and Omran, 2011), and firm profitability (Verriest et al., 2008). However, there is a paucity of previous empirical studies dealing with the impact of
institutions on the banking industry (Sufian and Habibulah, 2010). Furthermore, the use of
composite indices to represent governance indicators in these studies makes it difficult to isolate
the impact of individual institutions on bank performance and to compare their relative
importance.
The purpose of this paper is thus to investigate the impact of PRI quality on bank performance
across 136 countries, whilst controlling for country and financial market conditions. Our
empirical results indicate that the quality of the legal structure exerts a significant positive impact
on bank efficiency and profitability whereas the quality of the political structure negatively
affects bank cost efficiency. The quality of the political structure exerts no direct impact on bank
profitability. Further, the upper middle and high income group of countries exhibit a more
significant impact of PRIs on bank cost efficiency than the low and lower middle income group
of countries. This paper contributes to the literature in four respects. First, it investigates the
impact of PRI quality on the banking sector, which itself is of fundamental importance to the
international economy. Second, it extends the largely US-focused literature to a broader
international setting, and should therefore prove useful to international policy makers and
regulators who are interested in banking sector development. Third, it investigates the relative
importance of several types of institutional quality measure on bank performance. Fourth, it
highlights policy implications for the management of banks across countries. In the remainder of
the paper, we first provide a review of the relevant theoretical and empirical literature, and go on
to develop the hypotheses. The data and methodology are then discussed, followed by an
analysis of the empirical results. Finally, the conclusions and recommendations for future
research are presented.
Literature Review
Theoretical studies
This study utilizes the contract and the predatory theories of rule which explain how a
government can improve economic performance in a particular country (North, 1981). The
contract theory focuses on the design of contractual agreements between agents in an asymmetric
information environment. There are two types of rule under contract law: ‘default rules’ which
can be modified with the agreement of the parties, and ‘mandatory rules’ which cannot be
overridden. In contrast, the predatory theory of rule assumes that: ‘rulers maximize wealth to the
state and combine transaction cost and structural analysis to elucidate organizational differences’
(Levi, 2000, p. 829). According to North, then, the contract theory provides a platform for a
government to provide an effective legal system that facilitates business transactions, whilst
predatory theory encourages more government intervention to allocate resources among
members of a society. However, some scholars such as Djankov et al. (2002) refute such theories on the basis that government intervention creates private benefits for some interest groups,
though on aggregate can reduce social welfare. In this context, there are two competing views of
financial development in the economic literature: the public interest view and the political
economy view. The public interest view argues that there is a positive relationship between the
presence of quality institutions and bank efficiency, that is, high quality institutions increase
market competition and hence cost efficiency, whereas weak institutions negatively affect bank
efficiency through bank restrictions. In contrast, the political economy view claims that quality
institutions exert a negative impact on bank efficiency as weak institutions increase bank cost
efficiency through private benefits to control shareholders and/or industry incumbents.
Empirical studies
The quality of the legal structure and bank performance
Previous studies highlight the relationship between legal structure and the extent of investor
protection, the efficiency of the legislative process, social institutional design, the control of
business activities, and financial transparency (La Porta et al., 1997; Djankov et al., 2002; Bushman et al., 2004). It is commonly held that common law countries provide more investor
protection than civil law countries (La Porta et al., 1997) due to the respect for individual rights in the English common law system (Bushman et al., 2004), and judges’ freedom to deal with a changing business environment (De-Jong and Semenov, 2006). In contrast, stable civil law
depends on stable legal codes and statutes that need protracted legislative processes to modify.
Furthermore, previous studies show that countries with different legal structures tend towards
different modes of social institutional design and control of business activities (Djankov et al., 2002). For example, Doupnik and Salter (1995) find that common law countries usually adopt
microeconomic systems that focus on the survival of individual companies. They typically
favour a shareholder-orientated corporate governance model which encourages financial
disclosure to satisfy the needs of several stakeholders (Ball et al., 2000). Conversely, civil law countries usually apply macroeconomic systems which focus on the national economy to serve
the public interest (Nobes, 1987), depending on codified regulations and government
intervention in the economy.
Therefore, in this study we seek to test hypothesis H1 as follows:
H1: There is a positive relationship between the quality of the legal structure and (1) bank cost
efficiency and (2) bank profitability across countries.
The quality of the political structure and bank cost efficiency
The quality of the political structure is considered an important driver of financial and economic
performance (Alesina et al., 1996; Roe, 2003; Pagano and Volpin, 2000). For example, Alesina
et al. (1996) find a positive relationship between political stability and economic growth, whilst Roe (2003) argues that the ideology of US politicians guides the legal system to introduce rules
that prevent both the concentration of ownership and insider dealing. Consistent with Roe,
Pagano and Volpin (2000) argue that public policy and regulation are determined by the political
interplay of economic constituencies, though claim that the political decisions underpinning new
legal codes are based on economic rather than ideological principles, and thus the state is
regarded as an agent of political forces rather than as an independent player. The authors view
state intervention as resulting from political agreement rather than acting as its cause.
Some studies provide evidence on the benefits of quality property rights institutions. For
example Demirguc-Kunt et al. (2004) investigate the relationship between bank regulation, market structure and institutions, and bank performance across countries. They find a significant
positive relationship between the quality of institutions and bank efficiency. However, the use of
a set of aggregate governance indicators to proxy for the quality of institutions makes it difficult
to identify the individual impact of each institutional variable. Djankov et al. (2002) find that countries which enjoy more political freedom have less entry regulation, even after controlling
for per capita income. They show that more entry regulation across countries usually benefits
specific interest groups rather than increasing social welfare. More recently, Ben Naceur and
Omran (2011) find that banks benefit from lower operating costs and enhanced profit
opportunities in a well-developed banking and stock market environment.
Berger and Humphrey (1997) survey 120 academic studies of financial institutions across 21
countries, arguing that deregulation policies should raise efficiency given sufficient competition,
thereby benefitting the whole of society. However, such policies may not always lead to
efficiency improvement due to prior industry conditions across countries. First, government
interventions in the banking system which may introduce political patronage can fail to provide a
useful intermediation role and hence worsen the prospects for competitive market development
(La Porta et al., 1997).
The second reason why deregulation may not always lead to efficiency improvement is the
issue of bank concentration (Athanasoglou et al., 2008), as explored by the market power or efficiency structure hypotheses. The market power hypothesis states that banks in highly
concentrated markets can set unfavourable prices for customers due to competitive imperfections
or the existence of well-differentiated products (Berger, 1995). Berger also explains the
efficiency structure hypothesis which states that firms with superior management/production
technologies or more efficient production scales enjoy lower unit costs and higher unit profits
which may earn them a high market share. Existing studies show that, excepting the US, the
banking industry in most countries tends to be characterized by high market concentration.
Accordingly, some managers may insist on maximising their own rents rather than maximising
shareholder value. Even where the intention of management is to achieve greater cost efficiency,
further development of a competitive market may induce banks to pay higher deposit interest
rates without an equivalent decrease in bank services or an increase in deposit fees (Humphrey
and Pulley, 1997). Thus, the development of quality political structures may lead to increasing
operating costs which become difficult to control. Therefore, in this study we seek to test
hypothesis H2 as follows:
H2: There is a negative (positive) relationship between the quality of the political structure and
bank cost efficiency (inefficiency) across countries.
The quality of the political structure and bank profitability
There are several studies which examine the determinants of bank profitability in relation to bank
specific characteristics and/or institutional factors across countries (Molyneux and Thornton,
1992; Pasiouras and Kosmidou, 2007; Athanasoglou et al., 2008; Verriest et al., 2008; Ben Naceur and Omran, 2011).
Molyneux and Thornton (1992) examine the determinants of bank performance across 18
European countries between 1986 and 1989 and find a significant positive relationship between
the return on equity and the level of interest rates, bank concentration and the degree of
government ownership, consistent with other studies for the US. Pasiouras and Kosmidou (2007)
find in a study of 15 European countries over the period 1995–2001 that the profitability of both
domestic and foreign banks is affected not only by bank specific characteristics but also by
financial market structure and macroeconomic conditions.
More recently, authors argue that a better quality institutional environment of higher
competition, lower corruption, and lower entry barriers, impacts negatively upon profit margins.
For example, Verriest et al. (2008) measure PRI quality by means of composite indices for the quality of a country’s entry regulations, level of economic freedom, governance quality,
innovativeness and legal quality, and find a negative relationship between PRI quality and firm
profitability in a sample of manufacturing companies located in 56 countries over the period
1999 to 2006. Sufian and Habibulah (2010) find that overall economic freedom exerts a positive
impact on bank profitability in the Malaysian banking sector over the period of 1999-2007. The
authors argue that a lower quality political structure may encourage firms to set higher prices and
to influence politicians in order to gain private benefits (such as high entry barriers).
Alternatively, there may be a trade-off between bank revenue extraction and the cost of capital,
that is, lower levels of property rights may increase the revenue of individual banks but at the
same time increase their cost of capital thereby reflecting negatively on the return on assets.
Therefore, in this study we seek to test hypothesis H3 as follows:
H3: There is a negative relationship between the quality of the political structure and bank profitability across countries.
Data and methodology
Scope of the study
In this paper we study a sample of 136 countries drawn from four different income groups across
the world. The data on bank performance are collected from the World Bank (Beck et al., 2009), the International Monetary Fund (IMF) and the Bank Regulation and Supervision Survey
produced by the World Bank for three years: 1999, 2002, and 2006. Data on legal structure and
the security of property rights institutions are collected from the Economic Freedom of the
World Project (Gwartney et al., 2006). All data collected are country-level data. The sample years are all situated before the international financial crisis of 2007-2008, and thus are relatively
free from any distorting effects of that crisis on international banks. We estimate some multiple
regression panel models with fixed effects to test the study hypotheses for the whole sample.
Furthermore, the sample is divided into two subgroups to test whether the results hold for
different country income groups. All study variables are summarized and presented in Table 1.
The macroeconomic variables are obtained from the World Bank data indicators database.
Certain of the variables such as GDP per capita and inflation are expressed in natural logarithm
form in order to enhance the goodness of fit of our models (Sufian and Habibullah, 2010). The
model control variables in this paper are selected and tested based on maximizing the log
likelihood function (Olson and Zoubi, 2011). Data interpolation is used to derive the return on
assets and Economic Freedom of the World (EFW) indices to maintain a uniform number of
observations throughout the analysis. However, the analysis was repeated without data
interpolation and the results were found to be qualitatively the same.
[Insert Table 1 here]
The country PRI quality variables
Previous studies use different proxy variables for legal quality such as dummy variables for
common and civil law systems (Bushman et al., 2004), the extent of rights of outside investors, and the degree to which citizens are able to use the legal system to solve conflicts (Beck et al., 2004). In this study we use a more comprehensive set of legal structure and security of property
rights variables obtained from the Economic Freedom of the World Project (Gwartney et al., 2006). The variables measure the extent of government protection of persons and their rightfully
acquired property. The quality of PRIs for the countries in this study is gauged by the Centre for
Systematic Peace (Colorado State University) combined polity score (POLITY2) which is computed by subtracting the institutionalised autocracy (AUTOC) score from the institutionalised democracy (DEMOC) score. The POLITY2 variable is a widely employed measure of PRI quality in a country as it encompasses several political variables in a single score and is
computed in such a way that facilitates inter-temporal analysis across countries.
Bank performance variables
Bank performance is gauged by means of two accounting variables commonly employed in
previous empirical studies: the return on assets and the cost-income ratio. Data on these variables
are obtained from the World Bank data indicators database. Return on assets (ROA), a widely employed profitability ratio, is measured as average net income to total assets, and reflects the
ability of management to utilise bank financial and real investment resources to generate profits,
thereby encompassing both management decisions and policy objectives (Sufian and Habibullah,
2010; and Olson and Zoubi, 2011). The cost-income ratio (COSTINC), measured as total overheads or costs of running the bank (the major element of which is normally salaries) to gross
income generated before provisions, is essentially a measure of bank cost efficiency, or more
precisely, cost inefficiency, as the higher this measure the lower the degree to which costs are
under control in relation to income.
Other bank-specific variables
Previous empirical studies may be criticised for a lack of consistency in the selection of bank and
industry specific characteristics (Athanasoglou et al., 2008). To address this issue, we select several bank-specific control variables on the basis of maximizing the log likelihood function
from a likelihood ratio test (consistent with the approach of Olson and Zoubi, 2011). First, net
interest margin (INTM) is computed as the accounting value of a bank’s net interest revenue as a proportion of its interest-bearing assets. Second, overhead cost (OVHD) is measured as total overhead costs divided by total assets. Third, whilst bank size can be measured in a number of
different ways, we choose to measure it as deposit money bank assets scaled by gross domestic
production (DMBA). Fourth, bank market capitalization (MCAP) is represented as the natural logarithm of a bank’s share price multiplied by the number of shares outstanding. Fifth, bank
concentration (BCONC) shows the assets of the three largest banks as a share of the assets of all commercial banks in a given country. Sixth, government ownership (GOV) is measured as the fraction of a banking system's assets that are 50% or greater government owned. Other potential
control variables such as liquidity, non-performing loans, the interest spread, risk portfolio,
private credit, and activity (Beck et al., 2005, Athanasoglou et al., 2008, Lensink et al., 2008) are
found either to be insignificant or to evidence weaker significance than those control variables
selected, and hence are excluded from the analysis. It might be argued in any case that the
excluded variables are already proxied by the other explanatory variables included (Berger and
Humphrey, 1997).
Macroeconomic variables
The macroeconomic variables selected in this paper are GDP per capita, the GDP growth rate,
the real interest rate, and inflation, with all variables sourced from the International Monetary
Fund (World Economic Outlook database). The GDP per capita (GDP/CAP) variable is included to gauge the size of the economy, whilst the GDP growth rate (GDPG) proxies for general economic development across sample countries. The real interest rate (RIR) represents the lending interest rate adjusted for inflation as measured by the GDP deflator. The inflation
variable is measured as the natural logarithm of average consumer index values (whereby the
year 2000 base value equals 100 across countries), and is included on the basis that banks
typically generate greater profits in inflationary environments (Demirguc-Kunt et al., 2004).
The models
We estimate four sets of models in our study. The first set of models examines the relationship
between bank cost inefficiency and PRI quality. The general model specification is given in
Equation 1. We estimate eight different model specifications to avoid potential multicollinearity
between model variables.
ln(CSTNC)it = α + β1 ln(OVHD)it+ β2 ln(INTM)it+ β3 ln(DMBA)it+ β4ln(MCAP)it
+ β5(BCONC)it+ β6(GOV)it+ β7ln(GDP/CAP)it+ β8ln(INF)it
+ β9(GDPG)it+ β10(RIR)it + β11(LS)it + β12(POLITY2)it + β13(SG)it +
+ β14(SM)it+ β15(FT)it+ β16(REG)it+ β17(SI)it+ εit (1)
Where: lnCSTNC = Natural logarithm of the cost-income ratio; lnOVHD = Natural logarithm of overhead costs/total assets; lnINTM = Natural logarithm of the net interest margin; lnDMBA =
Natural logarithm of deposit money bank assets/GDP; lnMCAP = Natural logarithm of market capitalization; BCONC = Bank concentration; GOV = Government ownership of banks;
lnGDP/CAP = Natural logarithm of gross domestic product per capita; lnINF = Natural logarithm of consumer price index; GDPG = Gross domestic product growth rate; RIR = Real interest rate; LS = Legal structure, POLITY2 = Property rights institutions quality score; SG =
Size of government; SM = Sound money; FT = Free trade; REG = Regulations; and SI =
Summary index of size of government, legal system, sound money, freedom to trade and regulation indices.
The second set of models also examines the relationship between bank cost inefficiency and
PRI quality, though this time by country income level, employing the same model specification
given in Equation 1. The model specifications relate to low income, lower middle income, upper
middle income, and high income groups of countries, respectively.
The third set of models estimated examines the relationship between bank profitability and PRI
quality. The general model specification is given in Equation 2 and we estimate eight different
model specifications to avoid potential multicollinearity between the model variables.
ln(ROA)it = α + β1ln(OVHD)it+ β2ln(INTM)it+ β3ln(DMBA)it+ β4ln(MCAP)it
+ β5(BCONC)it+ β6(GOV)it+ β7 ln(GDP/CAP)it+ β8 ln(INF)it
+ β9(GDPG)it + β10(RIR)it + β11ln(CSTNC)it + β12(LS)it + β13(POLITY2)it
+ β14(SG)it+ + β15(SM)it+ β16(FT)it
+ β17(REG)it+ β18(SI)it+ εit (2)
Where the variable definitions are as above, with the addition of lnROA defined as the natural logarithm of the return on assets.
The fourth set of models estimated examines the relationship between bank profitability and
PRI quality, though this time by country income level, with the general specification as given in
Equation 2.
Results and discussion
Descriptive statistics and correlation matrix of the model variables
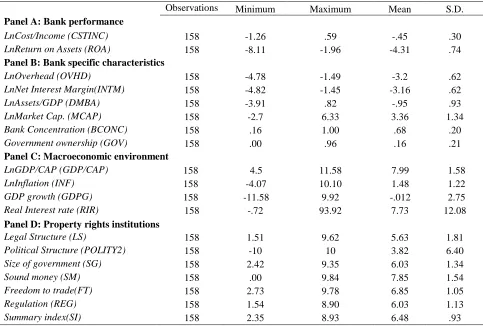
Table 2 presents descriptive statistics for the model variables of this paper. In our study, the
quality of the legal structure and the security of property rights index (LS) variable is scaled from 0 to 10, where 10 represents high government protection. We observe a tendency towards a
developed legal structure with a mean value of 5.63 across countries. The quality of the political
structure variable (POLITY2) covers the entire range from -10 to +10 across countries, and it has a mean of less than 4, hence there is a tendency towards institutionalised democracy, though this
is far from universal across countries. In terms of bank performance, omitting the natural
logarithm prefix, banks tend to exhibit a high cost-income ratio (COSTINC) of almost 67%, with a low return on assets (ROA) of 1% (not shown in Table 2 for reasons of brevity). However, for both measures, the standard deviation is high across the sample countries, implying a very wide
distribution for each variable.
[Insert Table 2 here]
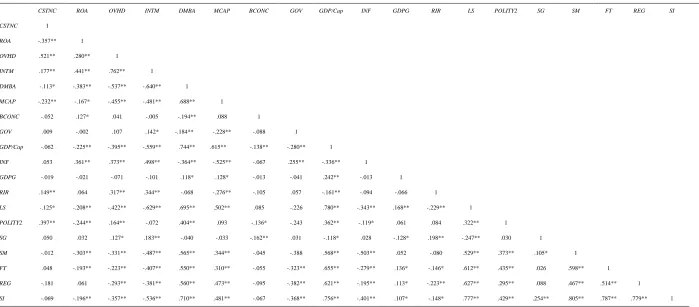
Before modelling bank cost efficiency and profitability, it is important to examine correlations
between the key model variables. The correlation matrix presented in Table 3 reveals some
significant relationships across the variables. For example, bank cost inefficiency (CSTNC) is significantly negatively correlated with the quality of the legal structure (LS), returns on assets (ROA), overhead costs (OVHD), and net interest margin (INTM), and has a significant positive relationship with the quality of the political structure (POLITY2) in our sample. The return on assets variable is significantly positively correlated with net interest margin and significantly
negatively correlated with bank size (DMBA) and the quality of legal and political structures. Importantly, PRI quality exhibits a significant correlation with several of the control variables,
and thus we need to address the potential issue of multicollinearity in the statistical analysis and
modelling.
[Insert Table 3 here]
An analysis of variance of the study variables
A one way analysis of variance of bank performance characteristics and external institutional
environment factors across banks in different income groups is reported in Table 4.
[Insert Table 4 here]
The internal bank performance characteristics and external institutional environment factors
differ significantly across income groups, with the exception of our cost inefficiency measure.
Similarly, other bank-specific variables differ significantly across income groups (not shown in
Table 4 for reasons of brevity). The results show that the variance within groups is much greater
than the variance between groups for all bank performance characteristics and institutional
variables across the four income groups at the 5% level, with the exception of bank cost
inefficiency (the cost to income ratio), thereby confirming the need to incorporate country
income grouping into our modelling strategy.
The impact of PRI quality on cost efficiency
Table 5 reports eight different specifications of a model of bank cost inefficiency against PRI
quality and the firm-level and macroeconomic control variables. Model 1 contains the control
variables alone and reveals that banks with higher overhead costs and lower interest margins tend
to suffer from significantly higher cost inefficiency, consistent with the predictions of Olson and
Zoubi (2011). The model captures a significant proportion of the variation in cost inefficiency,
with an F-statistic significant at the 1% level, and an adjusted R2 of 0.39.
[Insert Table 5 here]
In model 2, we add the quality of the legal structure variable and find that it is a significant
negative driver of cost inefficiency at the 5% level. Thus, as expected, the presence of quality
PRIs significantly increases the cost efficiency of banks. The model produces an F-statistic significant at the 1% level, and an adjusted R2 of 0.38.
In models 3 to 8 we include the quality of the political structure and other Economic Freedom
of the World (EFW) indices to investigate the relative importance of other institutions to bank
efficiency, in turn, and find that the quality of the legal structure maintains its significance, with
a negative impact, consistent with existing study predictions. Interestingly, adding the quality of
the political structure decreases bank efficiency in model 3, while more freedom of trade reduces
bank efficiency in model 6. The sound money, regulation and EFW summary index variables
show no impact on bank efficiency in models 5, 7 and 8. In terms of model diagnostics, the
maximum/minimum Value Inflation Factors (VIF) for the models are all below the benchmark of
5 degrees, indicating an absence of significant multicollinearity (Studenmund, 2006), and the
Goldfeld–Quandt (1965) test statistic is insignificant. On the basis of the estimated models of
bank cost efficiency, then, hypothesis H1 is not rejected as efficiency (inefficiency) is positively (negatively) related to the quality of legal structures. Similarly, hypothesis H2 is not rejected as efficiency (inefficiency) is negatively (positively) related to the quality of political structures.
The presence of better quality political structures would appear to lead to greater industry
competition, lower entry barriers, and ultimately increased costs for banks as they strive to be
more competitive and retain/grow their market shares.
The impact of PRI quality on bank profitability
We next analyse the drivers of bank profitability (defined here as the return on assets), focusing
in particular on PRI quality. Model 1 in Table 6 shows that the cost to income ratio is a
significant negative determinant of bank profitability at the 1% level, consistent with
Athanasoglou et al. (2008), and Olson and Zoubi (2011). Overhead costs are a significant positive determinant, perhaps due to an interaction with the cost to income ratio, while
government ownership exhibits a significant negative relationship with bank profitability, as
expected, though only at the 10% level. Thus, more profitable banks tend to be more cost
efficient and lend more in relation to their ownership structure than less profitable banks. All of
the models exhibit a significant F-statistic at the 1% level. [Insert Table 6 here]
Model 1 has an adjusted R2 of 0.34. We add the quality of the legal structure in model 2 and observe a significant positive impact on profitability across the models. Interestingly, the quality
of the political structure has no impact in model 3 while the sound money variable in model 5
exerts a significant negative impact on bank profitability at the 5% level.
The VIF test for all models confirms the absence of significant multicollinearity and the
Goldfeld-Quandt test statistic shows no sign of significant heteroscedasticity. In summary,
hypothesis H1 is not rejected as bank profitability is positively related to the quality of legal structures. Conversely, hypothesis H3 is rejected due to the absence of a significant negative relationship between the quality of political structures and bank profitability across countries.
This result contrasts with the findings of Verriest et al. (2008) for the manufacturing sector, as the banking industry is heavily regulated and supervised, thereby hindering banks from enjoying
high (interest) margins compared to other sectors of the economy. The main purpose of this
regulation is to safeguard the financial system and to ensure the soundness of bank fiduciary
responsibilities (Sufian and Habibulah, 2010). Thus, whilst there is evidence of a positive
relationship between the quality of legal structures, efficiency and profitability in banks on an
international basis, there is a positive effect between the quality of political structures and cost
inefficiency though no apparent impact on bank profitability.
The impact of PRI quality on cost efficiency by country income level
To examine whether country income level exerts an impact on the relationship between cost
efficiency in banks and PRI quality, we estimate models by country income level subgroup and
report the results in the first two columns of Table 7. We present two models, with banks in low
and lower middle income countries in model 1 and banks in upper middle and high income
countries in model 2. Interestingly, although the quality of legal structures tends to increase
(reduce) cost efficiency (inefficiency) across the country income group models, this positive
(negative) impact is only a significant driver in the upper middle and high income group of
countries (model 2) where it is significant at the 1% level. Further, our results show that the
quality of political structures significantly reduces bank efficiency only in upper middle and high
income of countries (model 2) at the 5% level. Thus, the erosion of bank efficiency as the quality
of political structures increases tends to have its greatest impact in upper middle and high income
countries. This latter model has an adjusted R2 of 0.45 and a significant F-statistic at the 1% level. This can be partly explained in that the existence of high quality property rights institutions
in high income countries may reduce the marginal benefits from any further institutional
improvements which may give rise to a nonlinear relationship between quality institutions and
bank performance. This relationship would benefit from further investigation in the future.
[Insert Table 7 here]
In terms of the model control variables, increasing overheads tend to promote higher cost
inefficiency whereas higher interest margins tend to lead to lower cost inefficiency, the latter
marginally more evident in the lower income group of countries.
The impact of PRI quality on profitability by country income level
The third and fourth columns of Table 7 report the results of models of bank profitability after
controlling for country income level. The cost to income ratio is a significant negative
determinant of profitability across models 3 and 4, though at different significance levels, whilst
the overhead cost is a significant positive determinant at the 1% level. Thus, more profitable
banks tend to have a lower cost to income ratio which makes logical sense. Interestingly, the
quality of legal structures maintains a positive impact on bank profitability across all income
groups (models 3 and 4) at the 5% level. Conversely, the quality of political structures has no
impact on bank profitability across country income groups. The adjusted R2 statistics are 0.39 for model 3 and 0.38 for model 4, with overall F-statistics significant at the 10% and 1% levels, respectively. Thus, PRI quality appears to exert a differing strength of impact on profitability
across country income groups.
Conclusions and recommendations
This paper investigates the impact of PRI quality on the cost efficiency and profitability of banks
across 136 countries over the period 1999 to 2006. We find that the quality of the legal structure
and security of property rights institutions positively affects bank cost efficiency and
profitability, consistent with our predictions. In addition, our evidence suggests that banks in
high quality political structure countries suffer from low cost efficiency, though this result relates
mainly to upper middle and high income countries. It is argued that cost inefficiencies may arise
here from the inability of banks to generate new sources of revenue and/or reduce operating costs
to tackle the increasing competition that accompanies an increase in PRI quality. Further, we find
some support for the political economy view and the market power hypothesis in upper middle
and high middle income countries within which banks may suffer from lower efficiency in the
face of bank concentration and/or competition. The impact of PRIs on bank cost efficiency is
more evident in the upper middle and high income group of countries than in the low and lower
middle income group of countries.
One implication of our results is that the cost structure of banks varies across countries with
different legal and political environments. The senior management of transnational banks should
employ appropriate operating income and cost strategies to respond to differences in PRI quality
across countries in order to maximize shareholder wealth. International policy makers and
regulators should work to reduce any competitive inequality due to international differences in
PRI quality to maintain financial stability and foster financial globalization. Our study has
certain limitations in that it focuses on large banks as a result of data availability issues with
smaller banks, and it does not test the effect of quality institutions on different types of banks,
which may limit the generalizability of our results. Future studies might include various
intermediary policy channels such as taxation through which PRI quality may affect bank
performance.
References
Alesina, A., S. Ozler, N. Roubini, and P. Swagel (1996), “Political instability and economic
Athanasoglou, P.P., S.N. Brissimis, and M.D. Delis (2008), “Bank-specific, industry-specific and
macroeconomic determinants of bank profitability”, Journal of International Financial Markets, Institutions and Money, Vol. 18 No. 2, pp. 121–136.
Ball, R., S.P., Kothari, and A., Robin (2000), “The effect of international institutional factors on
properties of accounting earnings”, Journal of Accounting and Economics, Vol. 29 No. 1, pp.1-51.
Beck, T., and R. Levine (2004), “Stock markets, banks, and growth: panel evidence”, Journal of Banking and Finance, Vol. 28 No. 3, pp. 423-442.
Beck, T., A. Demirguc-Kunt, and V. Maksimovic (2005), “Financial and legal constraints to firm
growth: Does size matter?” Journal of Finance, Vol. 60 No. 1, pp. 137-177.
Beck, T., A. Demirgüç-Kunt, and R. Levine (2009), “Financial institutions and markets across
countries and over time: data and analysis”, Working Paper No. 4943, World Bank Policy
Research.
Ben Naceur, S., and M. Omran (2011), “The effects of bank regulations, competition, and
financial reforms on banks’ performance”, Emerging Markets Review, Vol. 12 No. 1, pp. 1-20.
Berger, A. (1995), “The profit-structure relationship in banking: Test of market-power and
efficient market hypotheses”, Journal of Money, Credit, and Banking, Vol. 27 No. 2, pp. 404-431.
Berger, A., and D. Humphrey (1997), “Efficiency of financial institutions: International survey
and directions for future research”, European Journal of Operational Research, Vol. 98 No. 2, pp. 175-212.
Bushman, R.M., J.D., Piotroski, and A.J., Smith (2004), “What determines corporate
transparency?”, Journal of Accounting Research, Vol. 42 No. 2, pp. 207-252.
De-Jong, E., and R. Semenov (2006), “Cultural determinants of ownership concentration across
countries”, International Journal of Business Governance and Ethics, Vol. 2 No. 1, 145-165.
Demirguc-Kunt, A., Leaven, L. and Levine, R. (2004), “Regulations, market structure,
institutions, and the cost of financial intermediation”, Journal of Money, Credit and Banking, Vol. 36 No. 3, 593–622.
Djankov, S., R. La Porta, F. Lopez-De-Silanes, and A. Shleifer (2002), “The regulation of entry”,
Quarterly Journal Of Economics, Vol. 117 No. 1, pp. 1-37.
Doupnik, T., and S. Salter (1995), External environment, culture, and accounting practice: A
preliminary test of a general model of international accounting development, International Journal of Accounting, Vol. 30 No. 3, pp. 189-207.
Goldfeld, S.M. and R.E. Quandt (1965), “Some tests for homoscedasticity”, Journal of the American Statistical Association, Vol. 60 No. 310, pp. 539–547.
Gwartney, J.D., R.A. Lawson, and R.G. Holcombe (2006), “Institutions and the impact of
investment on growth”, Kyklos, Vol. 59 No. 2, pp. 255-273.
Humphrey, D. and L. Pulley (1997), “Banks' responses to deregulation: Profits, technology, and
efficiency”, Journal of Money, Credit and Banking, Vol. 29 No. 1, pp. 73-93.
La Porta, R., F. Lopez-De-Silanes, A. Shleifer, and R. Vishny (1997), “Legal determinants of
external finance”, Journal of Finance, Vol. 52 No. 3, pp. 1131-1164.
La Porta, R., F. Lopez-De-Silanes, A. Shleifer, and R. Vishny (1998), “Law and finance”,
Journal of Political Economics, Vol. 106 No. 6, pp.1113-1155.
La Porta, R., F. Lopez-De-Silanes, A. Shleifer, and R. Vishny (2002), “Investor protection and
corporate valuation”, Journal of Finance, Vol. 57 No. 3, pp. 1147-1170.
La Porta, R., F. Lopez-De-Silanes, A. Shleifer, and R. Vishny, (2002a), “Investor protection and
corporate valuation”, Journal of Finance, Vol. 57 No. 3, pp. 1147-1170.
Lensink, R., A. Meesters, and I. Naaborg (2008), “Bank efficiency and foreign ownership: Do
good institutions matter?” Journal of Banking and Finance, Vol. 32 No. 5, pp. 834-844. Leuz, C., D. Nada, and P. Wysocki (2003), “Earnings management and investor protection: An
international comparison”, Journal of Financial Economics, Vol. 69 No. 3, pp. 505-527. Levi, M. (2000), “The economic turn in comparative politics”, Comparative Political Studies,
Vol. 33 No. 6-7, pp. 822-844.
Molyneux, P. and J. Thornton (1992), “Determinants of European bank profitability: A note”,
Journal of Banking and Finance, Vol. 16 No. 6, pp. 1173–1178.
Nobes, C.W., (1987), “Classification of financial reporting practices”, Advances in International Accounting, Vol. 1 No.1, pp.1-22.
North, D. (1981), “Structure and Change in Economic History”, W.W. Norton and Company, Inc., NY.
Olson, D. and T. Zoubi (2011), “Efficiency and bank profitability in MENA countries”,
Emerging Markets Review, Vol. 12 No. 2, pp. 94–110.
Pagano, M., and P. Volpin (2000), “The political economy of corporate governance”, American Economic Review, Vol. 95 No. 4, pp.1005-1030.
Pasiouras, F., and K. Kosmidou (2007), “Factors influencing the profitability of domestic and
foreign commercial banks in the European Union”, Research in International Business and Finance, Vol. 21 No. 2, pp. 223-237.
Rajan, R. and L. Zingales (1998), “Financial dependence and growth”, American Economic Review, Vol. 88 No. 3, pp. 559-586.
Roe, M. (2003), “Political Determinants of Corporate Governance: Political Context, Corporate Impact”, Oxford University Press, Oxford, UK.
Studenmund, A.H. (2006), “Using Econometrics: A Practical Guide”, 5th Ed., Pearson Education Inc., NY.
Sufian, F., and M. Habibullah (2010), “Does economic freedom foster banks’ performance?
Panel evidence from Malaysia”, Journal of Contemporary Accounting and Economics,
Vol. 6 No. 2, pp. 77-91.
Verriest, A., L. Cherchye, and A. Gaeremynck (2008), “Institutional characteristics and firm
profitability”, Working paper, Erasmus Research Institute of Management, Netherlands,
Available at: http//www.ssrn.com/abstract=1013143.
Table 1
Summary of variables and source of data
All data collected are country-level data Panel A: Bank performance
LnCost/Income (CSTINC) The natural logarithm of total overhead costs to gross income. The World Bank
LnReturn on Assets (ROA) The natural logarithm of average net income to total assets. The World Bank
Panel B: Bank specific characteristics
LnOverhead (OVHD) The natural logarithm of total overhead costs divided by total assets. The World Bank
LnNet Interest Margin(INTM)
The natural logarithm of a bank’s net interest revenue as a proportion of its interest-bearing assets.
The World Bank
LnAssets/GDP (DMBA) The natural logarithm of deposit money bank assets scaled by gross domestic production.
The World Bank
LnMarket Cap. (MCAP) The natural logarithm of share price times the number of shares outstanding. Listed domestic companies are those domestically incorporated companies listed on a country's stock exchange(s) at the end of the year.
The World Bank
Bank Concentration (BCONC)
The assets of three largest banks as a share of the assets of all commercial banks. The World Bank
Government ownership (GOV)
The fraction of the banking system's assets that are 50% or more government owned. The World Bank
Panel C: Macroeconomic environment
LnGDP/CAP (GDP/CAP) The natural logarithm of gross domestic product per capita. The World Bank
LnIflation (INF) The natural logarithm of the inflation rate. The World Bank
GDP growth (GDPG) The natural logarithm of gross domestic product growth. The World Bank
Real Interest rate (RIR) The lending interest rate adjusted for inflation as measured by the GDP deflator. The World Bank
Panel D: Property rights institutions
Legal Structure (LS) The extent of government protection of persons and their rightfully acquired property. It includes the level of judicial independence, impartial courts, protection of property rights, military interference in the rule of law and the political process, integrity of the legal system, legal enforcement of contracts, and regulatory restrictions on the sale of real property. Scaled from 0 to 10, where 10 represents high government protection.
Gwartney et al.
(2006)
Political structure (POLITY2)
The extent of quality institution for the distribution of political power among members of a society, and constraints on executive performance. It is measured by subtracting the institutionalised autocracy score from the institutionalised democracy score. Scaled from +10 (strongly democratic) to -10 (strongly autocratic).
Centre for Systematic Peace (CSP)
Size of government (SG) The extent to which countries rely on the government to allocate resources and goods and services. Scaled from 0 to 10, with 10 representing a significant sized government.
Gwartney et al.
(2006)
Sound money (SM) The extent of the consistency of monetary policy (or institutions) with long-term price stability and the ease with which other currencies can be used via domestic and foreign bank accounts. Scaled from 0 to 10, where 10 represents more sound monetary policy.
Gwartney et al.
(2006)
Freedom to trade(FT) The extent of international exchange restraints such as tariffs, quotas, hidden administrative restraints, and controls on exchange rates and capital. Scaled from 0 to 10, where 10 represent more freedom to trade.
Gwartney et al.
(2006)
Regulation (REG) The extent of regulatory restraints that limit freedom of exchange in the credit, labour, and product markets. Scaled from 0 to 10, where 10 represents more freedom of exchange.
Gwartney et al.
(2006)
Summary index(SI) An average summary index of the legal structure, size of government, sound money, freedom to trade and regulation indices. Scaled from 0 to 10, where 10 represents more economic freedom.
Gwartney et al.
(2006)
YR Dummy variable for the year effect that takes a value of 1, 2, or 3 if year is 1999, 2002, or 2006, respectively.
Table 2
Descriptive statistics for the study variables
Observations Minimum Maximum Mean S.D.
Panel A: Bank performance
LnCost/Income (CSTINC) 158 -1.26 .59 -.45 .30
LnReturn on Assets (ROA) 158 -8.11 -1.96 -4.31 .74 Panel B: Bank specific characteristics
LnOverhead (OVHD) 158 -4.78 -1.49 -3.2 .62
LnNet Interest Margin(INTM) 158 -4.82 -1.45 -3.16 .62
LnAssets/GDP (DMBA) 158 -3.91 .82 -.95 .93
LnMarket Cap. (MCAP) 158 -2.7 6.33 3.36 1.34
Bank Concentration (BCONC) 158 .16 1.00 .68 .20
Government ownership (GOV) 158 .00 .96 .16 .21 Panel C: Macroeconomic environment
LnGDP/CAP (GDP/CAP) 158 4.5 11.58 7.99 1.58
LnInflation (INF) 158 -4.07 10.10 1.48 1.22
GDP growth (GDPG) 158 -11.58 9.92 -.012 2.75
Real Interest rate (RIR) 158 -.72 93.92 7.73 12.08 Panel D: Property rights institutions
Legal Structure (LS) 158 1.51 9.62 5.63 1.81
Political Structure (POLITY2) 158 -10 10 3.82 6.40
Size of government (SG) 158 2.42 9.35 6.03 1.34
Sound money (SM) 158 .00 9.84 7.85 1.54
Freedom to trade(FT) 158 2.73 9.78 6.85 1.05
Regulation (REG) 158 1.54 8.90 6.03 1.13
Summary index(SI) 158 2.35 8.93 6.48 .93 Variable definitions are reported in Table 1.
Table 3
Correlation matrix for the study variables
Variable definitions are reported in Table 1. (**) and (*) indicate significance at the 1% and 5% levels, respectively, in a 2-tailed test.
CSTNC ROA OVHD INTM DMBA MCAP BCONC GOV GDP/Cap INF GDPG RIR LS POLITY2 SG SM FT REG SI
CSTNC 1
ROA -.357** 1
OVHD .521** .280** 1
INTM .177** .441** .762** 1
DMBA -.113* -.383** -.537** -.640** 1
MCAP -.232** -.167* -.455** -.481** .688** 1
BCONC -.052 .127* .041 -.005 -.194** .088 1
GOV .009 -.002 .107 .142* -.184** -.228** -.088 1
GDP/Cap -.062 -.225** -.395** -.559** .744** .615** -.138** -.280** 1
INF .053 .361** .373** .498** -.364** -.525** -.067 .255** -.336** 1
GDPG -.019 -.021 -.071 -.101 .118* .128* -.013 -.041 .242** -.013 1
RIR .149** .064 .317** .344** -.068 -.276** -.105 .057 -.161** -.094 -.066 1
LS -.125* -.208** -.422** -.629** .695** .502** .085 -.226 .780** -.343** .168** -.229** 1
POLITY2 .397** -.244** .164** -.072 .404** .093 -.136* -.243 .362** -.119* .061 .084 .322** 1
SG .050 .032 .127* .183** -.040 -.033 -.162** .031 -.118* .028 -.128* .198** -.247** .030 1
SM -.012 -.303** -.331** -.487** .565** .344** -.045 -.388 .568** -.503** .052 -.080 .529** .373** .105* 1 FT .048 -.193** -.223** -.407** .550** .310** -.055 -.323** .655** -.279** .136* -.146* .612** .435** .026 .598** 1
REG -.181 .061 -.293** -.381** .560** .473** -.095 -.382** .621** -.195** .113* -.223** .627** .295** .088 .467** .514** 1
SI -.069 -.196** -.357** -.536** .710** .481** -.067 -.368** .756** -.401** .107* -.148* .777** .429** .254** .805** .787** .779** 1
Table 4
Analysis of variance of bank performance characteristics and institutional environment across countries across all income groups
Variable definitions are reported in Table 1.
Sum of Squares
Mean Square
F
Sig.
Bank Performance:
LnCost/Income (CSTNC) Between Groups .045 .045 .474 .492
Within Groups 35.19 .094
Total 35.23
LnReturn on Assets (ROA) Between Groups 6.09 6.09 9.51 .002
Within Groups 203.62 .640
Total 209.72
Institutional Quality:
Legal Structure (LS) Between Groups 519.15 519.15 213.15 .000
Within Groups 857.32 2.43
Total 1376.47
Political Structure (POLITY2)
Between Groups 2217.95 2217.95 62.37 .000
Within Groups 13868.41 35.56
Total 16086.36
Size of Gov. (SG) Between Groups 10.82 10.82 5.01 .026
Within Groups 760.17 2.16
Total 771.00
Sound Money (SM) Between Groups 139.47 139.47 59.68 .000
Within Groups 822.63 2.33
Total 962.11
Free Trade (FT) Between Groups 114.66 114.66 115.06 .000
Within Groups 349.77 .997
Total 464.44
Regulations (REG) Between Groups 118.01 118.01 103.59 .000
Within Groups 400.99 1.13
Total 519.00
Summary Index (SI) Between Groups 113.18 113.18 155.16 .000
Within Groups 256.76 .729
Total 369.94
Table 5
Fixed effects models of the relationship between bank cost inefficiency and PRI quality
Variable definitions are reported in Table 1. Standardized beta coefficients are reported, with t-values presented in parentheses. VIF is the variable inflation factor. (***), (**) and (*) indicate significance at the 1%, 5% and 10% levels, respectively, on the basis of a 2-tailed test.
Dependent variable: cost/income (COSTINC)
(1) (2) (3) (4) (5) (6) (7) (8)
Constant .113
(.399) -.243 (-.785) -.227 (-.745) -.172 (-.485) -.138 (-.418) -.814 (-2.32) -.040 (-.113) -.223 (-.553)
LnOverhead (OVHD) .388
(8.27)*** .384 (8.35)*** .356 (7.62)*** .386 (8.34)*** .385 (8.36)*** .358 (7.89)*** .385 (8.38)*** .385 (8.28)***
LnNet Int Margin (INTM) -.173
(-3.23)*** -.220 (-3.96)*** -.207 (-3.78)*** -.220 (-3.94)*** -.227 (-4.05)*** -.212 (-3.93)*** -.225 (-4.04)*** -.221 (-3.94)***
Assets/GDP (DMBA) .038
(.944) .021 (.528) .016 (.403) .023 (.565) .022 (.554) .015 (.381) .011 (.262) .021 (.528)
LnMarket Cap (MCAP) -.019
(-.940) -.003 (-.169) .001 (.034) -.003 (-.123) -.005 (-.241) .000 (.021) -.002 (-.112) -.003 (-.166)
Bank Conc. (BCONC) .020
(.198) .104 (1.01) .101 (1.00) .100 (.970) .0013 (1.09) .067 (.674) .090 (.874) .104 (1.01)
Gov. ownership (GOV) .074
(.743) .111 (1.12) .115 (1.19) .108 (1.09) .078 (.752) .196 (1.98)* .052 (.464) .107 (1.00)
LnGDP/CAP(GDP/CAP) .027
(1.38) .064 (2.68)*** .044 (1.77)* .062 (2.52)** .066 (2.75)*** .058 (2.53)** .063 (2.66)*** .064 (2.66)***
LnInflation rate (INF) (-.079) -.002 (.097) .002 (.123) .003 (.020)** .000 (-.127) -.003 (.051) .001 (-.090) -.002 (.074) .002
GDP growth (GDPG) -.007
(-.840) -.007 (-.784) -.003 (-.395) -.007 (-.805) -.007 (-.847) -.006 (-.745) -.009 (-1.00) -.007 (-.785)
Interest rate (RIR) -.001
(-.542) -.001 (-.318) -.001 (-.533) -.001 (-.255) .000 (-.119) .000 (.034) -.001 (-.252) -.001 (-.299)
Legal Structure (LS) -.046
(-2.57)** -.043 (-2.41)** -.047 (-2.60)*** -.044 (-2.39)** -.065 (-3.53)*** -.036 (-1.75)* -.045 (-2.03)**
Pol. structure (POLITY2) .010
(2.44)**
Size of Gov.(SG) (-.416) -.006
Sound Money (SM) -.017
(-.949)
Free Trade (FT) .091
(3.20)***
Regulation (REG) -.039
(-1.12)
Summary Index (SI) -.003
(-.078)
Year (YR) Included Included Included Included Included Included Included Included
R2 .44 .44 .44 .47 .44 .44 .42 .41
Adjusted R2 .39 .38 .39 .42 .39 .38 .37 .36
Durbin-Watson 1.68 1.71 1.73 1.71 1.68 .173 1.69 1.70
F-statistic, (p-value) 8.57*** 9.30*** 8.81*** 8.55*** 8.73*** 10.06*** 8.90*** 8.52*** Max/Min VIF 2.99/1.06 3.31/1.06 3.50/1.09 3.31/1.06 3.39/1.07 3.31/1.06 3.45/1.08 4.28/1.07
Valid N 158 158 158 158 158 158 158 158
Table 6
Models of the relationship between bank profitability and PRI quality
Details of study variables are reported in Table 1. Standardized beta coefficients are reported, with t-values presented in parentheses. VIF is the variable inflation factor. (***), (**) and (*) indicate significance at the 1%, 5% and 10% levels, respectively, on the basis of a 2-tailed test.
Dependent variable: Return on Assets (LnROA)
(1) (2) (3) (4) (5) (6) (7) (8)
Constant (-2.71)*** -2.18 (-1.27) -1.12 (-1.27) -1.12 (-.483) -.484 (-.548) -.507 (-.941) -.984 (-1.68) -1.71 (-.006) -.007
LnOverhead (OVHD) .551
(3.40)*** .509 (3.20)*** .514 (3.20)*** .526 (3.30)*** .527 (3.35)*** .510 (3.19)*** .497 (3.12)*** .532 (3.35)***
LnNet Int Margin (INTM) .059
(.377) .224 (1.35) .223 (1.33) .226 (1.36) .175 (1.05) .226 (1.35) .244 (1.46) .203 (1.22)
Assets/GDP (DMBA) -.073
(-.630) -.027 (-.232) -.025 (-.219) -.011 (-.095) -.019 (-.171) -.026 (-.221) .004 (.031) -.021 (-.183)
LnMarket Cap (MCAP) -.079
(-1.40) -.123 (-2.13)** -.124 (-2.13)** -.114 (-1.98)* -.131 (-2.30)** -.123 (-2.13)** -.126 (-2.18)** -.120 (-2.10)**
Bank Conc. (BCONC) (-.814) -.228 (-1.67)* -.485 (-1.66)* -.486 (-1.79)* -.522 (-1.49) -.431 (-1.63) -.478 (-1.52) -.446 (-1.70)* -.492
Gov. ownership (GOV) -.525
(-1.86)* -.646 (-2.31)** -.649 (-2.31)** -.669 (-2.39)** -.835 (-2.86)*** -.669 (-2.27)** -.475 (-1.50) -.827 (-2.74)***
LnGDP/CAP(GDP/CAP) -.008
(-.152) -.124 (-1.80)* -.118 (-1.63) -.144 (-2.04)** -.112 (-1.63) -.124 (-1.79)* -.124 (-1.80)* -.133 (-1.93)*
LnInflation rate (INF) -.008
(-.126) -.019 (-.313) -.019 (-.316) -.034 (-.551) -.048 (-.778) -.019 (-.309) -.007 (-.117) -.044 (-.702)
GDP growth (GDPG) -.023
(-.948) -.024 (-1.00) -.025 (-1.03) -.026 (-1.08) -.028 (-1.16) -.024 (-1.00) -.018 (-.730) -.029 (-1.19)
Interest rate (RIR) -.008
(-1.26) -.009 (-1.51) -.009 (-1.47) -.008 (-1.31) -.007 (-1.09) -.009 (-1.52) -.009 (-1.57) -.007 (-1.24)
LnCost/income (CSTNC) -1.47
(-6.25)*** -1.34 (-5.67)*** -1.32 (-5.49)*** -1.35 (-5.73)*** -1.37 (-5.87)*** -1.32 (-5.40)*** -1.31 (-5.55)*** -1.34 (-5.71)***
Legal Structure (LS) .140
(2.68)*** .139 (2.66)*** .131 (2.51)** .155 (2.96)*** .145 (2.58)** .109 (1.87)* .196 (3.09)***
Pol. Structure. (POLITY2) -.003
(-.274)
Size of Gov.(SG) -.054
(-1.33)
Sound Money (SM) (-2.00)** -.103
Free Trade (FT) -.022
(-.255)
Regulation (REG) .116
(1.16)
Summary Index (SI) -.190
(-1.54)
Year (YR) Included Included Included Included Included Included Included Included
R2
.40 .43 .43 .43 .44 .43 .43 .44
Adjusted R2 .34 .37 .37 .38 .38 .37 .37 .38
Durbin-Watson 1.41 1.43 1.43 1.43 1.47 1.43 1.50 1.43
F-statistic, (p-value) 7.48*** 6.58*** 6.03*** 6.04*** 6.34*** 6.03*** 7.07*** 6.03*** Max/Min VIF 3.34/1.06 3.61/1.06 3.61/1.09 3.38/1.07 3.37/1.07 3.64/1.06 3.65/1.08 4.31/1.07
Valid N 158 158 158 158 158 158 158 158
Table 7
Models of the relationship between bank efficiency, bank profitability and PRI quality by country income level
Variable definitions are reported in Table1. Standardized beta coefficients are reported, with t-values presented in parentheses. VIF is the variable inflation factor. (***), (**) and (*) indicate significance at the 1%, 5% and 10% levels, respectively, on the basis of a 2-tailed test.
LnCost/income (CSTNC) LnReturn on Assets (ROA)
Low and lower middle income level countries Upper middle and high income level countries Low and lower middle income level countries Upper middle and high income level countries
(1) (2) (3) (4)
Constant -.134
(-.127) -.594 (-1.29) 2.82 (.985) .378 (.273)
LnOverhead (OVHD) .516
(3.47)*** .346 (6.49)*** 1.61 (3.36)*** .563 (2.95)***
LnNet Int Margin (INTM) -.378
(-3.64)*** -.183 (-2.61)*** -.021 (-.062) .296 (1.36)
Assets/GDP (DMBA) .080
(.724) -.004 (-.073) .547 (1.81)* -.037 (-.258)
LnMarket Cap (MCAP) -.020
(-.447) .001 (.023) -.282 (-2.32)** -.134 (-1.77)*
Bank Conc. (BCONC) -.195
(-1.01) .141 (1.19) -.197 (-.372) -.602 (-1.68)*
Gov. ownership (GOV) -.112
(-.532) .111 (.795) .335 (.582) -.907 (-2.15)
LnGDP/CAP(GDP/CAP) .082
(1.26) .093 (2.08)** -.128 (-.708) -.255 (-1.85)*
LnInflation rate (INF) -.077
(-1.04) .013 (.545) -.352 (-1.72)* -.035 (-.489)
GDP growth (GDPG) .000
(-.006) -.010 (-.991) -.040 (-.925) -.027 (-.876)
Interest rate (RIR) -.006
(-1.33) -.001 (-.491) -.033 (-2.75)*** -.009 (-1.08)
LnCost/income (CSTNC) -1.00
(-1.99)*
-1.55 (-5.16)***
Legal Structure (LS) .006
(.178) -.069 (-2.73)*** .262 (2.87)*** .196 (2.50)**
Pol. Structure (POLITY2) .008
(1.38) .013 (2.59)** .00 (.071) -.013 (-.694)
Year (YR) Included Included Included Included
R2 .60 .52 .60 .47
Adjusted R2 .40 .45 .39 .38
Durbin-Watson 2.43 1.76 2.40 1.58 F-statistic, (p-value) 3.35*** 7.60*** 2.15* 4.76*** Max/Min VIF 4.82/1.33 3.74 7.48/1.45 3.74/1.12
Valid N 44 114 44 114