Krull IS, Zhou F-X, Bourque AJ, Szulc M, Yu J and Strong R (1994) Solid-phase derivatization reactions for biomedical liquid chromatography. Journal of Chromatography B659: 19}50.
Krull IS, Mazzeo J, Szulc M, Stults J and Mhatre R (1996) Detection and identiRcation in biochromatography. In: Katz E (ed.) High Performance Liquid Chromatogra-phy: Principles and Methods in Biotechnology, pp. 163}232. New York: John Wiley&Sons.
Krull IS, Szulc ME and Dai J (1997) Derivatizations in HPCE.A Primer. Thermo Bioanalysis Corporation, San Jose, CA.
Lawrence JF (1981) Organic Trace Analysis by Liquid Chromatography. New York: Academic Press.
Lingeman H and Underberg WJM (eds) (1990) Detection-Oriented Derivatization Techniques in Liquid Chrom-atography. New York: Marcel Dekker.
Detectors: Electron Spin Resonance
K. Osterloh, Magnettech GmbH, Berlin, and Institute
of Physiology, Freie Universita(t Berlin, Berlin, Germany
H.-H. Borchert, Institute of Pharmacy,
Humboldt Universita(t zu Berlin, Berlin, Germany
C. Kroll, Hexal-Pharma GmbH, Magdeburg, Germany
Copyright^ 2000 Academic Press
Introduction
The role of radicals in (bio-)chemical reactions is currently becoming increasingly signiRcant. Free rad-icals may be generated by any kind of irradiation and contribute essentially to many aging processes in many materials, particularly in the presence of oxy-gen. They are even able to cause manifold organic damages as in lipid peroxidation or in inSammatory diseases. Organic reperfusion injuries after ischaemia are currently the subject of intensive research activ-ities. On the other hand, stable free radicals are used practically in a number of applications in manyRelds, e.g. as additives in industrial processes such as polym-erization or as analytical tools in research on mem-brane, emulsion and surface properties of materials or formulations. The utilization of such substances as protective additives, e.g. for process control or as research tools, has stimulated interest in the synthesis of new compounds of this class. The increasing search for radicals is paralleled with a rising demand for methods to detect, identify and quantify them. In the context of separation techniques, this means having a technique at hand to trace them in eluted fractions.
High chemical reactivity combined with low
speci-Rcity is typical of the majority of radicals. As a conse-quence, solutions containing such substances are like-ly to alter their composition within a short time owing to the decreasing content of reactive compo-nents and to the accumulation of reaction products. This kind of change can easily be monitored by chromatographic methods. Having separated all the constituents at a given time, it may become necessary
to identify original or intermediate radicals to evalu-ate the particular stage of an ongoing reactive pro-cess. However, the detectors routinely used in HPLC cannot indicate directly any radical present in the separated fractions. The most advanced method suit-able for this purpose is electron spin resonance spec-troscopy (ESR), but most ESR spectrometers are currently installed as large and heavy instruments, not at all suitable as detectors for chromatographic methods. It will be shown here that this kind of spectroscopic method can be realized with devices of table-top size that can easily be integrated into any chromatographic separation line.
Electron spin resonance (or electron paramagnetic resonance, EPR) spectroscopy is the only direct method to measure radicals since it is based on the existence of unpaired electrons. Likewise, paramag-netic metal complexes are also sensitive to this spec-troscopic method. A substantial advantage for the study of radical reactions would be the rapid analysis of a fraction directly upon separation to avoid cha-nges caused by putative consecutive reactions. This can only be achievable by direct coupling of the separator (HPLC) with the speciRc detector (ESR) in the shortest possible way without any unnecessary dead volume (long tubing lines or valves). An abso-lute prerequisite for such an instrumental set-up is a spectrometer of a size that allows installation at the site of the sample separation, and not necessarily vice versa. The other problem is synchronization of sample separation and recording of a spectrum which requires a deRnite period of time. Both problems have been solved in the on-line coupling of HPLC and ESR spectroscopy described here.
ESR Spectroscopy as Detector
An introduction into the principles of ESR (or EPR) spectroscopy can be found in most textbooks on physical chemistry or in specialized monographs. Since this spectroscopic technique is rather uncommon
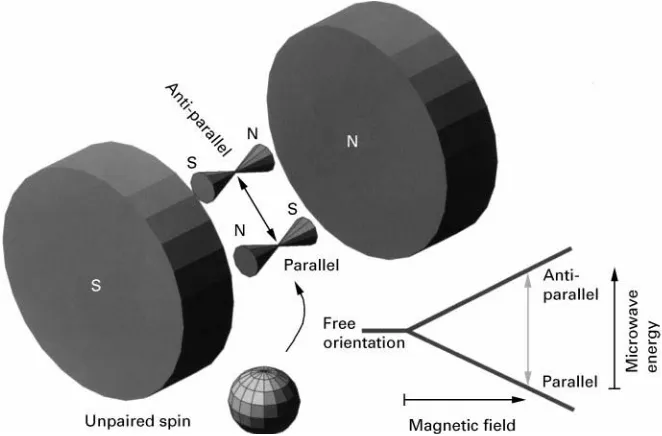
Figure 1 Alignment of an unpaired electron in a magnetic field.
in theReld of separation sciences, a brief description of the principle is given here.
Electron spin resonance was detected by the Rus-sian scientist Zavoisky in 1946 while researching the paramagnetic properties of matter. Radicals and metal complexes with an odd number of electrons in d-orbitals show paramagnetism since unpaired elec-trons generate local electromagneticRelds. They can be detected whenever they interact with an external magneticReld. This interaction can be understood in the way that the external Reld forces any unpaired electron to align (Figure 1).
Once in line with the parallel magneticReld, lines of a given strength the electrons are able toSip into the opposite direction while absorbing energy. The stimulating energy (E"h, h is Planck’s constant andis the frequency) to cause such aSip over must be of a frequency able to resonate with the unpaired electron tumbling in the magneticReld like a spinning top (Larmor frequency). This frequency again is lin-early dependent on the applied magnetic Reld; in other words, the stronger theReld, the higher must be the frequency of the energy to stimulate theSip over of a single electron. (E"gBHwhereBrepresents
the Bohr magneton,Hthe external magneticReld and
g is a dimensionless proportional factor,&2 for a single electron, the so-called LandeH factor. The whole term is part of the Hamiltonian operator which is used to describe the state of energy of a given system.) In essence, the alignment of an unpaired electron in an external magnetic Reld can have two directions, either with theReld (low-energy state) or against the
Reld (high-energy state). This is the same kind of energy splitting (Zeeman splitting) as in nuclear
mag-netic resonance (NMR) spectroscopy. The transition between these two states needs energy in the range of high-frequency radio waves or microwaves, depend-ing on the strength of the applied external magnetic
Reld. Nowadays, it is quite common to use a micro-wave frequency between 9 and 10 GHz (within the so-called X-band) which requires a magneticReld in the range of 300}400 mT. ToRnd the exact absorp-tion energy of an unpaired electron, e.g. in a radical at a given strength of the applied magnetic Reld, two ways are possible in principle: either to scan the microwave at aRxed magneticReld, or vice versa, to scan the magneticReld at aRxed wavelength. Since it is technically much easier to vary the magneticReld rather than to tune a microwave source over a large range, ESR spectra are recorded by scanning the ex-ternal magneticReld. They are commonly displayed as Rrst derivatives which is different to all other spectroscopic techniques where absorption peaks are shown.
Interactions of unpaired electrons with surround-ing paramagnetic nuclei result in additional splittsurround-ing of energy levels (hyperRne splitting) that become vis-ible as multiples of absorption lines. In some cases, different radical moieties can be identiRed by their individual hyperRne splitting structure.
Coupling between Radical Separation
and Detection
ESR Spectrometer Size
Common ESR spectrometers have a large magnet which makes the instruments rather heavy, up to half a ton in weight. However, newly developed ESR spectrometers have been reduced to a size comparable with commonly used diode array detectors.
Flow Conditions of HPLC Mobile Phases
Owing to the properties of the microwave, the sample size is geometrically restricted to a thickness of 0.3 mm, allowing only a total sample volume of some 50L (if theSuid phase contains water, the volume could be larger otherwise). The sample cuvette (a quartzSat cell) is located in aRxed position inside the instrument having open access from the bottom and top allowing tubing to be attached toRll the cuvette upwards and toSow out at the top of the instrument. This vertical Sow direction of the mobile phase helps to avoid accidental trapping of gas bubbles that could spoil any spectral measurement. At a Sow of 1 mL min\1 no turbulence occurs at any site within
the sample cuvette ensuring homogeneousRlling and
Sushing without any problem. The use of capillary tubing minimizes the dead volume between the com-mon UV/visual light monitor and the ESR spectrom-eter and thus theSow delay between these two devices.
Tubing Material Required for Radical Detection
In all cases, non-metal tubing is used. It should be noted that steel capillaries can never be used in the vicinity of the magnetic Reld of the spectrometer. Moreover, it is advisable to avoid any metal surface at all when working on free radicals. Particularly if oxygen is present, even minute amounts of iron, for example, may be sufRcient to catalyse the Fenton reaction.
Synchronization of Separation and Detection
A major problem to be solved is synchronization of the continuous sample Sow from the chromato-graphic equipment and the scan time required for taking an ESR spectrum. This subject has already been tackled by a number of authors. However, prob-lems regarding signal separation and measurement sensitivity remain. A typical ESR scanning time is one minute for a spectrum and this may be in conSict with the elution time of a single fraction from a HPLC column. Since complete chromatograms usually take some 8}15 min, single fractions are likely to take less than a minute to elute so no constant conditions can be expected in the sample cuvette while a spectrum is running. Simply stopping the Sow for the time of recording a spectrum may result in local diffusion, causing a loss of resolution in the separation step, so
this approach is not recommended. Pulsed short-time spectra (FT-spectroscopy) are very sophisticated re-quiring a much more complicated instrumentation, so the ‘cw’ (continuous wave) technique still remains the current standard method.
Instrumental Arrangement and Operation
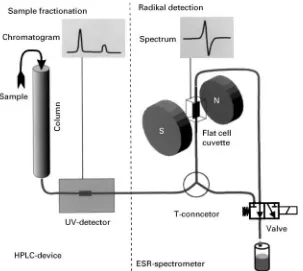
A practical solution that allows both continuousSow from the HPLC column and a resting period of a sample fraction in the ESR spectrometer cuvette is depicted inFigure 2. In principle, a shunt is provided to short-cut the passage through the ESR spectrom-eter. It is opened while an ESR spectrum is in progress and closed at any other time. This allows the cuvette to beRlled with a fraction, to leave it for the time of scanning a spectrum, and to Sush the sample upon completion. A disadvantage of this procedure is that is does not allow spectra of fractions running closely together to be obtained since the spectrum of theRrst sample is still being recorded while the second one is starting to elute from the column. In this case, it is necessary to repeat the chromatographic separation step for the second fraction of interest.
In order to control theSow either through or by-passing the ESR spectrometer, a T-connector is in-serted into the tubing between the HPLC detector and the ESR spectrometer for branching off to the shunt. Both the outlet tubing from the spectrometer and the shunt are connected to a valve which alternately opens or closes either way. This arrangement has two major advantages: on the one hand, unnecessary and irregularly shaped dead volume that may disturb the sampleSow from the HPLC device to the spectrom-eter is avoided by placing the control valve after both devices, and on the other hand, it is not possible to close off both paths by control error, thus minimizing the risk of accidentally building up destructive pres-sure in the tubing system. In a simple set-up, the valve can be operated by hand via an electrical switch. The delay time from the appearance of the peak of interest in the monitor system of the HPLC to the moment of
Rlling the ESR cuvette with the corresponding frac-tion can be measured exactly and is highly reproduc-ible. In more standardized or routine applications, automatic control is possible. This whole arrange-ment makes the ESR spectrometer truly an additional HPLC monitor that analyses radicals.
Supplementary Equipment
In some cases substances may turn into (short living) radicals after stimulation either by light irradiation or in the course of a reaction triggered by an added reagent. In other cases, reactive and short-lived rad-icals may be trapped in an adduct with a so-called
Figure 2 Instrumental set-up of synchronized online HPLC-X-band}ESR coupling (modified in accordance with Osterloh and Kroll (1998)).
[image:4.568.63.266.504.683.2]Figure 3 Attachment of supplementary equipment to the ESR spectrometer as radical detector.
Figure 4 Synthesis scheme for PCA anhydride using DCC in purified methylenechloride.
‘spin-trap’. To provide the possibility for monitoring such reactions online with an eluted fraction, certain supplementary equipment may be added to the whole instrumental set-up as shown inFigure 3.
Application Examples
The following practical examples should demonstrate the advantages in detection of free radicals in HPLC
direct and online by ESR. One deals with separation of a synthesized product, while the other deals with a reactive, short-lived radical species.
Synthesis of Stable Radicals
Stable radicals such as nitroxyl compounds become increasingly of interest for process control of radical reactions, e.g. polymerization. This practical example demonstrates both the complexity of sample com-position after such a synthesis and the changes owing to the instability of a single component. The starting point here is a cleavable biradical which decomposes immediately in aqueous solution.
[image:4.568.294.514.618.685.2]Figure 5 Chromatogram of synthesis product obtained by means of online coupled HPLC}ESR.
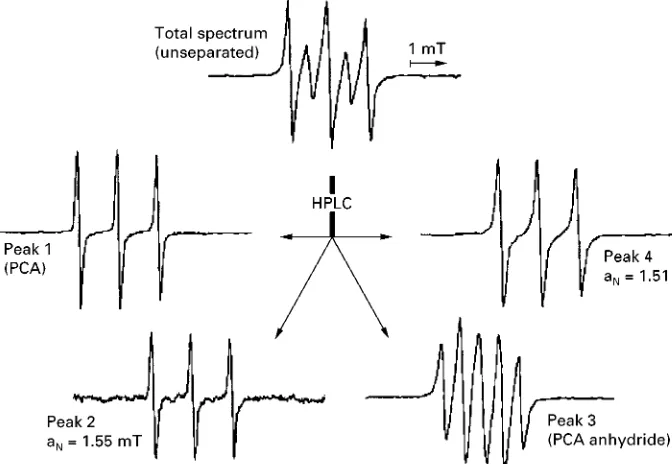
Figure 6 ESR spectra of the initial substance and four separated paramagnetic compounds. HPLC: Merck-Hitachi-HPLC with DAD (diode
array detector), RP-18 (5m) column (125/4 mm) and methanol}water solutions (Sow rate 1 mL min\1, pH 7, isocratic as well as gradient mode).
ESR: Miniscope MS-100 desk X-band spectrom-eter (Magnettech GmbH, Germany). GC-MS, IR and NMR-techniques were also used for the identiRcation of unknown products.
In following the synthesis, mixtures of PCA an-hydride [II] were investigated by online coupled HPLC}ESR. This anhydride in practice represents a suitable tool for the spin labelling of macro-molecules such as albumin. The puriRed synthesis product was analysed. In contrast to the available
literature, the chromatogram obtained showed four ESR-active compounds after HPLC separation (Figure 5).
These were the PCA anhydride [II] (peak 3 with
tR"4.95 min) and PCA [I] (peak 1 with tR"
1.39 min) as expected as well as two new para-magnetic compounds with typical 14N-hyperRne
coupling (peak 2 with tR"3.34 min and peak 4
with tR"7.41 min). Further, 1H-NMR, IR and
GC}MS experiments showed the compound with tR"7.71 min (peak 4) to be PCA
dicyclohexylurea-amide. No other peaks gave an ESR signal.
Figure 6represents the ESR spectra of the sample before and after chromatographic separations. Spectra of peak 1, 2 and 4 show a line triplet typical
Figure 7 Scheme of formation of stable radicals in biological systems using PBN.
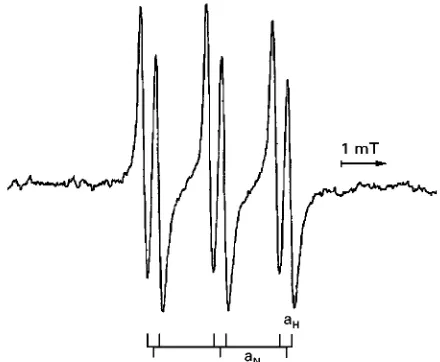
Figure 8 ESR spectra of a paramagnetic PBN adduct after HPLC separation measured by online HPLC}ESR coupling technique.
for nitroxyl radicals owing to the interaction between the unpaired electron and the nitrogen nucleus. The uneven number of protons and neutrons results in nuclear spin quantum numbers of!1, 0 and#1, in equal distribution. Those nuclei with a spin different from 0 cause a magneticReld recognized by the un-paired electron in addition to that generated by the magnet of the spectrometer. The result is a hyperRne splitting into three spectral lines as shown in the respective spectra. Peak 3 comprises the biradical PCA anhydride [II] with two nitroxyl groups in close vicinity. The ESR spectrum is determined by addi-tional interactions between these two radical moie-ties. All the single spectra of the separated peaks add to the composite one seen with the initial unseparated sample.
Common Radical Analysis
A typical characteristic of most radicals is their high reactivity so they normally have a short life. As a con-sequence, they may be present only in rather low concentrations so they may be difRcult to analyse. Therefore, the spin-trapping technique was de-veloped to detect short-lived radicals.Figure 7shows an example of this technique in which the reagent PBN (-phenyl-N-t-butylnitrone; not itself a radical)
forms a stable adduct with a reactive, short-lived radical. The highly reactive compounds analysed here are inherently linked to the aging process in living tissues.
The spectrum inFigure 8shows, in addition to the hyperRne splitting owing to the nitrogen nucleus (aN),
an additional one caused by the hydrogen nucleus in the-position to the unpaired electron (aH). This spin
trap does not necessarily allow differentiation be-tween radical species so combination of a separation step with the spin trapping reaction could provide this kind of information.
Conclusions
The simple and straightforward coupling of HPLC and ESR causes problems owing to the necessity to synchronize the chromatographic and the spectro-scopic techniques. TheRrst example presented shows that it is impossible to distinguish between more than two similar paramagnetic compounds with either technique alone. Therefore, the direct combination of both techniques requires additional equipment to solve the problems encountered. The second example demonstrates a tool to identify low concentrations, but highly reactive radicals, in separate fractions.
Our modiRed online HPLC}ESR coupling tech-nique represents a suitable tool to solve such prob-lems without any signiRcant time lag with a high signal sensitivity comparable to conventional cw-ESR. Furthermore, the technique presented prevents severe problems that frequently occur in stop-Sow chromatographic applications.
See also: II/Chromatography: Liquid: Detectors: Fluorescence Detection; Detectors: Infrared; Detectors: Mass Spectrometry; Detectors: Refractive Index Detection; Detectors: Ultraviolet and Visible Detection; Nuclear Mag-netic Resonance Detectors.
Further Reading
Atkins P (1990)Physikalische Chemie. Weinheim: VCH. Gallez B, Lacour V, Demeure R, Debuyst R, Dejehet F,
[image:6.568.54.274.492.673.2]Janzen EG and Blackburn BJ (1968) Detection and
identi-Rcation of short-lived free radicals by an electron spin resonance trapping technique.Journal of the American Chemical Society90: 5909}5910.
Kroll C, Osterloh K, MaKder K and Borchert H-H (1998) On-line coupled HPLC-ESR: Application for separation and characterization of organic radicals. Archiv der Pharmazie }Pharmaceutical and Medicinal Chemistry 331 (2): 40.
Osterloh K, Kroll C, MaKder K, Borchert H-H, Sammler B and Kirmse C (1998) HPLC und Elektronenspin-resonanz-Spektroskopie on-line gekoppelt [On-line Coupling of HPLC and Electron Spin Resonance Spec-troscopy] (German). GIT Labor-Fachzeitschrift 42: 24}25.
Poole CP (1983)Electron Spin Resonance, 2nd edn. New York: John Wiley.
Poole CP and Farach HA (1994)Handbook of Electron Spin Resonance: Data Sources, Computer Technology, Relaxation, and Endor.Berlin: Springer.
Sugata R, Iwahashi H, Ishii T and Kido R (1989) Separ-ation of polyunsaturated fatty acid radicals by high-performance liquid chromatography with electron spin resonance and ultraviolet detection. Journal of Chromatography487: 9}16.
Suzuki S, Nakazawa H, Fujita M, Ono S, Suzuki M, Takitani S, Sonoda M and Sakagishi Y (1992) Flow analysis of UV-irradiated chemicals by chemilumines-cence and electron spin resonance spectroscopy. Ana-lytica Chimica Acta261: 39}43.
Detectors: Evaporative Light Scattering
R. P. W. Scott, Avon, CT, USA
Copyright^ 2000 Academic Press
The evaporative light-scattering detector evolved from the early work of Charlseworth and MacRae. The device consists of a spray system that continuous-ly atomizes the column eluent into small droplets. The droplets evaporate, leaving the solute as Rne particulate matter suspended in the atomizing gas. In practice, the column eluent passes into a concentric nebulizer where it is nebulized in a hot stream of gas that may be air or, if so desired, an inert gas such as helium or argon. The suspended particulate matter is then made to pass through an intense light beam from a source such as a helium}neon laser. The light scat-tered by the particles is viewed at 453to the incident beam by means, for example, of a pair of properly placed optical Rbres. The scattered light that enters the Rbres is transmitted to a photomultiplier, the output of which is electronically processed and passed either to a computer acquisition system or to a potentiometric recorder. The evaporative light-scat-tering detector might be considered to be a form of transport detector where the transport medium is the nebulizing gas. A diagram of the light-scattering de-tector is shown inFigure 1.
The column eluent enters the centre oriRce of a dual, concentric jet nebulizer where it meets a heated stream of nebulizer gas from the surrounding annular oriRce. The gasSow rate is adjusted to pro-vide a jet velocity that is just above the speed of sound. The stream of droplets that are produced normally have a relatively wide range of size distribu-tion and pass down a heated tube, called the drift
tube. In this tube the solvent evaporates, leaving the solute as residual solid particles still carried in the gas stream. It is clear that this type of detector cannot function effectively if solid involatile buffers are used in the mobile phase. After passing through the laser beam, the gas containing the solvent vapour and particles is aspirated through a simple water pump which safely disposes of both the solvent vapour and the solutes. The laser is employed as a convenient source of high intensity light and its coherence does not appear to confer any particular advantage on the detection system.
The amount of scattered light that is collected is related to the diameter of the particles, the wave-length of the incident light and the angle at which it is collected. It is not linearly related to the concentra-tion of solute in the mobile phase, but varies as either the power or the exponent of the solute concentra-tion. For a given set of operating conditions the droplet size will remain sensibly constant during the development of a chromatogram. Now the aver-age diameter of the solid particles produced will be the average size of the droplets multiplied by the cube root of the solute concentration. Thus, if the solute has a concentration of 10\6g mL\1, the solute
par-ticles will be 100 times smaller than the size of the droplets and, assuming a common value for the mean diameter of the droplets of 20m, the solute particles will be 0.2m in diameter. Thus the mean particle diameter is of approximately the same order of mag-nitude as the wavelength of the scattered light.
Physical Properties of the Nebulizer
The intensity of the scattered light will be determined, among other factors, by the diameter of the solid