ICDAR 2003 Page Segmentation Competition
A. Antonacopoulos
1, B. Gatos
2and D. Karatzas
11PRImA Group, Department of Computer Science, University of Liverpool,
Peach Street, Liverpool L69 7ZF, United Kingdom http://www.csc.liv.ac.uk/~prima
2Computational Intelligence Laboratory, Institute of Informatics and Telecomunications,
National Center for Scientific Research “Demokritos”, GR-153 10 Agia Paraskevi, Athens, Greece http://www.iit.demokritos.gr/cil
Abstract
There is a significant need to objectively evaluate layout analysis (page segmentation and region classification) methods. This paper describes the Page Segmentation Competition (modus operandi, dataset and evaluation criteria) held in the context of ICDAR2003 and presents the results of the evaluation of the candidate methods. The main objective of the competition was to evaluate such methods using scanned documents from commonly-occurring publications. The results indicate that although methods seem to be maturing, there is still a considerable need to develop robust methods that deal with everyday documents.
1 Introduction
Over the last two decades, a plethora of layout analysis—page segmentation in particular—methods have been reported in the literature. It can be argued that the field is now beginning to mature and yet new methods are being proposed claiming to outperform existing ones. Frequently, each algorithm is devised with a specific application in mind and is fine-tuned to the test image data set used by its authors, thus making a direct comparison with other algorithms difficult. The need for objective performance evaluation of Layout Analysis algorithms is evident. This competition focuses on the evaluation of page segmentation and region classification subsystems.
To the best of the Authors’ knowledge, there has not been any previous international generic layout analysis competition. The closest instance, focussing on a specific application domain, was the First International Newspaper Page Segmentation Contest [1] held by the Authors in the context of ICDAR2001. Before that, an evaluation of page segmentation (as part of OCR systems) was performed at UNLV [2], based on the results of OCR. That approach, however, cannot not be strictly considered to evaluate layout analysis methods since the OCR-based evaluation does not give sufficient information on the performance of page segmentation and
region classification and is only applicable to regions of text (or text-only documents).
The motivation for this competition was the evaluation of page segmentation and region classification methods in realistic circumstances. By realistic it is meant that the participating methods are applied to scanned documents from a variety of sources, occurring in real life. This is in contrast to the majority of datasets and reports of results using mostly structured documents (e.g., technical articles).
The competition and its modus operandi is described next. In Section 3, an overview of the dataset and the ground-truthing process is given. The performance evaluation method and metrics are described in Section 4, while each of the participating methods is summarised in Section 5. Finally, the results of the competition are presented and the paper is concluded in Sections 6 and 7, respectively.
2 The
competition
The main objective of the competition was to evaluate layout analysis (page segmentation and region classification) methods using scanned documents from commonly-occurring publications. A secondary objective was to create a useful dataset not only consisting of the document pages selected for the competition but with additional images and groundtruth to make available to Layout Analysis researchers, well beyond ICDAR2003.
The competition run in an off-line mode. The authors of candidate methods registered their interest in the competition and downloaded the training dataset (document images and associated groundtruth). One week before the competition closing date, registered authors of candidate methods were able to download the document images of the evaluation dataset. At the closing date, the organisers received the results of the candidate methods, submitted by their authors in a pre-defined format. The organisers then evaluated the submitted results.
It should be noted that the off-line mode is based on trust that the results submitted by the methods’ authors
are genuine. This can be more so if the evaluation system is publicly available. In this case, the evaluation system was not published (only the principles) and above all, the organisers have faith in the authors’ scientific integrity.
3 The
dataset
For any performance evaluation approach, the Achilles' heel is the availability of ground truth. As ground-truthing cannot (by definition) be fully automated, it remains a laborious and, therefore, expensive process. One approach is to use synthetic data [3]. It is the authors’ opinion, however, that for the realistic evaluation of layout analysis methods, ‘real’ scanned documents give a better insight. Furthermore, it should be noted that there is currently no ground truth available for the evaluation of methods analysing complex layouts having non-rectangular regions. Therefore, a new dataset had to be created for this competition and for later distribution.
Following the rationale of the competition (realism), the following types of documents were selected for inclusion in the dataset (in order of layout complexity):
• technical articles,
• memos,
• faxes,
• magazine pages, and
• advertisements.
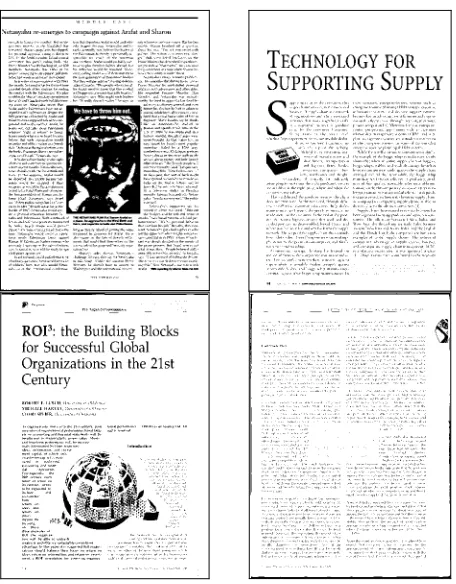
[image:2.612.64.292.71.363.2]It is the view of the organisers that the above categories represent a subset of documents that are both realistic in their frequent occurrence and, at the same time, of general interest to analyse.
Figure 2. Sample page image from the training dataset showing superimposed description of region contours.
For the test dataset for the competition, a balance had to be achieved between logistics (a manageable number of document images) and tractability for current methods. The decision was, therefore, made to focus on a cross section of 32 page images, comprising 25% technical articles (not necessarily with Manhattan layouts) and 75% magazine pages. It should be noted that also for reasons of tractability, the competition dataset was binarised (the originals in the augmented dataset are in colour). A representative sample of page images given as the training dataset can be seen in Fig. 1.
The ground-truth of each page image is an XML file (defined specifically for the competition) that contains image and layout specific information as well as the description of the regions in terms of isothetic polygons. The ground-truth for the competition was produced using a semi-automated tool [4]. An XML viewer was developed for examining the images and the corresponding ground-truth XML, and was distributed to the competition participants. Another sample page image with the corresponding description of regions superimposed as isothetic polygons can be seen in Fig. 2.
The types of regions defined for the competition (simplified from the total number of different types in the general dataset) are:
• text,
• graphics, Figure 1. Sample page images from the training
[image:2.612.354.511.135.345.2]• line-art,
• separator, and
• noise.
4 Performance
evaluation
The performance evaluation method used is based on counting the number of matches between the entities detected by the algorithm and the entities in the ground truth [5-7]. We use a global MatchScore table for all entities whose values are calculated according to the intersection of the ON pixel sets of the result and the ground truth (a similar technique is used at [8]).
Let I be the set of all image points, Gj the set of all points inside the j ground truth region, Ri the set of all points inside the i result region, gj the entity of j ground truth, ri the entity of i result, Τ(s) a function that counts the elements of set s. Table MatchScore(i,j) represents the matching results of the j ground truth region and the i result region. Based on a pixel based approach of [5], and using a global MatchScore table for all entities, we can define that: otherwise 0, r g if 1, where , ) I ) R (G T( ) I R G T( j) (i,
MatchScore j i
j j
j
j
{
== ∩
∪ ∩ ∩
=a a (1)
If Ni is the count of ground-truth elements belonging to entity i, Mi is the count of result elements belonging to entity i, and w1, w2, w3, w4, w5, w6 are pre-determined weights, we can calculate the detection rate and recognition accuracy for i entity as follows:
i i 3 i i 2 i i 1 i N g_many2one w N g_one2many w N one2one w
DetectRate = + + (2
) i i 6 i i 5 i i 4 i M d_many2one w M d_one2many w M one2one w racy
RecognAccu = + + (3)
where the entities one2onei, g_one2manyi, g_many2onei, d_one2manyi and d_many2onei are calculated from MatchScore table (1) following the steps of [5] for every entity i.
A performance metric for detecting each entity can be extracted if we combine the values of the entity’s detection rate and recognition accuracy. We can define the following Entity Detection Metric (EDMi):
i i i i racy RecognAccu DetectRate racy RecognAccu DetectRate 2
EDMi= + (4)
A global performance metric for detecting all entities can be extracted if we combine all values of detection rate and recognition accuracy. If I is the total number of entities and Ni is the count of ground-truth elements belonging to entity i, then by using the weighted average
for all EDMi values we can define the following Segmentation Metric (SM):
∑
∑
= I i I N EDM N SM i i (5)5 Participating
methods
The following were the methods whose results were submitted to the competition.
5.1 The DAN method
This method was submitted by L. Cinque, S. Levialdi and A. Malizia of the University of Rome “La Sapienza” in Italy. In brief, the DAN system architecture includes four main components:
(1) the preprocessor, (2) the split module, (3) the merge module, and (4) the classification module.
The preprocessing algorithm (1) component is applied in order to enhance the quality of input data, removing portions of the image, which could be considered as noise.
The Split module (2) takes input from the preprocessing phase and applies a particular quad-tree technique in order to split the document into small blocks. The result of the Split module is passed to the Merge module (3), which applies a pre-classification criterion, merging similar regions into larger regions. Local operators are used with variable thresholds in order to compute the pre-classification phase.
Finally, using global operators, the engine of the system is in the Classification module (4) which executes the classification procedure according to the classification logic. In fact, the “brain” of the system is this classification module, which outputs segmented regions and their attributes such as type and size in an XML file.
A more detailed description of the principles and working of the DAN system can be found in a recent paper [9].
5.2 The ISI method
This method was submitted by S.P. Chowdhury, A.K. Das, S. Mandal and B. Chanda of the Indian Statistical Institute (ISI) in Calcutta, India. The system was constructed using selected tools from a larger morphological-approach based system [10].
with greyscale images, the first step taken by the system is to blur the bilevel image (using a 3x3 mean filter), producing a grey-valued one. Using opening and closing operations, half-tone regions are extracted from the image.
Next, returning to the original binary image (minus the half-tones), large areas of noise near the edges of the image are removed using connected-components analysis. A skew detection and correction method is then applied to the image.
Separators, if any, are detected next. Text regions (as defined in the competition rules) are detected initially as individual math zones, headings and general text regions. The remaining regions in the image are noise and line-art. Finally, line-art regions are separated from noise using connected-component analysis and morphological operations. Individual methods are described in a number of publications by the system’s authors.
5.3 The Océ method
This method was submitted by Zoé Goey of Océ Technologies B.V. in The Netherlands. It works as follows.
First, connected components are identified and classified into small character, normal character, large character, photograph, graphic, vertical line, horizontal line or noise (in terms of the region types used in the competition, photographs are graphics, lines are separators and graphics are line-art) using a manually constructed decision tree based on features such as width, height, number of pixels etc. Using the result of this classification three images are split off:
(a) an image containing graphics, photos and noise, (b) an image containing lines, and
(c) an image containing text.
In the last case, those blocks, in which the majority of connected components are classified as large characters are split off to a separate image. Thus, the image containing text is divided into two images:
(c1) an image containing normal/small text (c2) an image containing headers
Next, the components in the normal/small text image (c1) and the graphic/photo/noise image (a) are joined into blocks using a run length smearing procedure. The resulting blocks are then classified by a trained decision tree that takes the connected component class statistics as its input. In the line image (b), each line is considered as a separate block with class label “separator”. The blocks in the header image (c2) are found by applying a connected component grouping algorithm, which also applies a post-classification step to assure that the blocks really contain text.
At this stage, all blocks are only described by their bounding boxes, since the above algorithms, currently, do not support arbitrarily polygonal output. To output polygons, a white space covering algorithm is used on the smeared text (c1) image and the resulting polygons are intersected with original bounding boxes, removing polygons fully contained in other polygons. It should be noted that there is a lot of room for improvement in the polygon generation step as the desirable implementation (had the method’s authors had more time) would be using a boundary tracking approach.
6 Results
We evaluated the performance of the 3 segmentation algorithms using equations (1)–(5) for all 32 test images with parameters w1 = 1, w2 = 0.75, w3 = 0.75, w4 = 1,
w5 = 0.75 and w6 = 0.75. All evaluation results for all
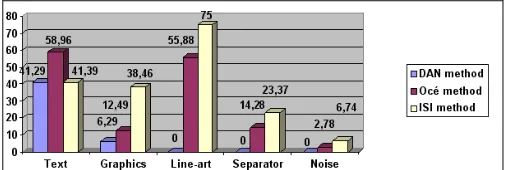
entities are shown in Fig. 3 where the EDMi values
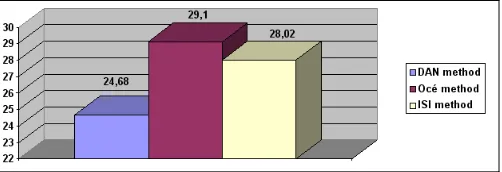
averaged over all images are depicted. Fig. 4 presents the Segmentation Metric (SM) values for all segmentation algorithms averaged over all images. Fig. 4 shows that the Océ method has an overall advantage.
[image:4.612.316.571.514.599.2]Concerning text region segmentation, the Océ method achieved the highest averaged EDM rate value (58.96%) while the DAN method and the ISI method achieved an averaged EDM rate value of about 41%. For graphics, line-art, separator and noise entities the ISI method achieved the highest averaged EDM rate values (38,46%, 75%, 23,37% and 6,74% respectively) while the Océ method achieved lower rates (12,49%, 55,88%, 14,28% and 2,78% respectively). The DAN method attained low or zero averaged EDM rate values for graphics, line-art, separator and noise entity segmentation (6,29%, 0%, 0% and 0% respectively).
Figure 3. Evaluation results for all entities (EDMi
Figure 4. Averaged Segmentation Metric (SM) values.
7 Conclusions
The motivation of the ICDAR2003 Page Segmentation Competition was to evaluate existing approaches for page segmentation and region classification using a realistic dataset and an objective performance analysis system. The image dataset used comprised scanned technical articles and (mostly) magazine pages. The performance evaluation method used is based on counting the number of matches between the entities detected by the algorithm and the entities in the ground truth. The competition run in an off-line mode and evaluated the performance of 3 segmentation algorithms: the DAN algorithm that includes four main components (the preprocessor, the split module, the merge module, and the classification module), the ISI algorithm that is based on selected tools from a larger morphological-approach based system, and the Océ algorithm that is based on connected component analysis. The evaluation results show that the Océ method has an overall advantage while the ISI method achieved the highest rates for graphics, line-art, separator and noise entity segmentation.
Acknowledgements
The organisers would like to express their gratitude to the main sponsor of the competition, the UK’s Government Communications Headquarters (GCHQ). The support of ABBYY and Scansoft, in terms of software, is gratefully acknowledged. Last, but not least, thanks are due to the following people who contributed their effort in different ways: David Bridson, Celia Casado-Castilla, Mark Ellis, Zhesi He, Dave Kennedy, Hong Meng, Stavros Perantonis and John Spafford.
References
[1] B. Gatos, S.L. Mantzaris and A. Antonacopoulos, “First International Newspaper Contest”, Proceedings of the 6th International Conference on Document Analysis and Recognition (ICDAR2001), Seattle, USA, September 2001, pp. 1190–1194.
[2] J. Kanai, S.V. Rice, T.A. Nartker and G. Nagy, “Automated Evaluation of OCR Zoning”, IEEE
Transactions on Pattern Recognition and Machine Intelligence, Vol. 17, No. 1, January, 1995, pp. 86-90.
[3] I.T. Philips, S. Chen and R.M. Haralick, “CD-ROM
Document Database Standard”, Proceedings of 2nd
International Conference on Document Analysis and Recognition (ICDAR’93), Tsukuba, Japan, 1993, pp. 478-483.
[4] A. Antonacopoulos and H. Meng, “A Ground-Truthing Tool for Layout Analysis Performance Evaluation”, in the book Document Analysis Systems V: Proceedings of the International Association for Pattern Recognition (IAPR) Workshop on Document Analysis Systems (DAS2002), D. Lopresti, J. Hu and R. Kashi (Eds.), Springer Lecture Notes in Computer Science, LNCS 2423, pp. 236–244.
[5] I. Phillips and A. Chhabra, "Empirical Performance
Evaluation of Graphics Recognition Systems," IEEE Transaction of Pattern Analysis and Machine Intelligence, Vol. 21, No. 9, pp. 849-870, September 1999.
[6] A. Chhabra and I. Phillips, "The Second International Graphics Recognition Contest - Raster to Vector Conversion: A Report," in Graphics Recognition: Algorithms and Systems, Lecture Notes in Computer Science, volume 1389, pp. 390-410, Springer, 1998.
[7] I. Phillips, J. Liang, A. Chhabra and R. Haralick, "A Performance Evaluation Protocol for Graphics Recognition Systems" in Graphics Recognition: Algorithms and Systems, Lecture Notes in Computer Science, volume 1389, pp. 372-389, Springer, 1998.
[8 ]B.A. Yanikoglu, and L Vincent, "Pink Panther: a complete environment for ground-truthing and benchmarking document page segmentation", Pattern Recognition, volume 31, number 9, pp. 1191-1204, 1994.
[9] I L. Cinque, S. Levialdi, A. Malizia, and F. De Rosa, “DAN: an automatic segmentation and classification engine for paper documents”, Proceedings of the Fifth IAPR International Workshop on Document Analysis Systems (DAS 2002), LNCS 2423, p. 491-502, August 2002, Princeton, New Jersey, USA.